

Abstract
Purpose of Review: In vivo imaging of the native substances, including lipoproteins, that comprise human atherosclerotic plaques is currently beyond the scope of any available imaging techniques. Color and near-infrared fluorescent angioscopy (CFA and NIRFA, respectively) systems have been recently developed for molecular imaging of lipoproteins within the human coronary arterial wall ex vivo and/or in vivo. The author reviews recent findings on lipoprotein deposition in human coronary plaques obtained by these imaging techniques.
Recent Findings: Using specific biomarkers, native pro-atherogenic substances such as oxidized low-density lipoprotein (ox-LDL), LDL, triglycerides (TG), apolipoprotein B-100 (ApoB-100), and lysophosphatidylcholine (LPC), and the anti-atherogenic substance such as high-density lipoprotein (HDL) were visualized by CFA, and LDL and cholesterol by NIRFA, in coronary plaques obtained from autopsy subjects. The relationship between incidence and plaque morphology differed for each substance. The incidence of ox-LDL and LDL on color fluorescence microscopy correlated well with that observed using immunohistochemical techniques. During coronary catheterization in patients, ox-LDL, LDL, and HDL in coronary plaques were visualized by CFA or NIRFA.
Conclusions: Using CFA or NIRFA, the distribution of the major native pro-atherogenic and antiatherogenic lipoproteins and their components within human coronary plaques can be evaluated ex vivo and/or in vivo. Fluorescent angioscopy could help our understanding of the molecular mechanisms of coronary atherosclerosis and in the evaluation of the effects of therapy targeting the substances comprising atherosclerotic coronary plaques.
Keywords: Apolipoproteins, Biomarkers, Color fluorescent angioscopy, Immunohistochemistry, Lipoproteins, Near-infrared fluorescent angioscopy
Introduction
Oxidized low-density lipoprotein (ox-LDL), which is formed by the oxidation of LDL, plays an important role in the initiation, progression, and destabilization of atherosclerotic coronary plaques1, 2). As its counterpart, high-density lipoprotein (HDL), an important anti-atherogenic substance, plays a key role in reverse cholesterol transport and is considered to inhibit the progression, and enhance the regression of atherosclerosis3, 4).
Structurally, ox-LDL has a cortex and a core. The cortex is composed of lysophosphatidylcholine (LPC), free cholesterol, and Schiff base derived by the oxidation of apolipoprotein B, and the core is composed of triglycerides (TG), cholesteryl esters, and proteins. LPC itself is a pro-inflammatory substance and plays a critical role in the atherogenic activity of ox-LDL. It is generated by lipoprotein-associated phospholipase A25–8). Apolipoprotein B-100 (ApoB-100) is a major protein of LDL9). Serum levels of Apo B-100 are elevated in patients with type 2 diabetes mellitus10) as well as in those with coronary artery disease11). The Apo B-100 level and Apo B-100/Apo A-1 ratio predict not only coronary artery disease12) but also other cardiovascular diseases13) and metabolic syndrome14). TG is also considered an important risk factor for cardiovascular disease, but lowering TG levels remains difficult to achieve15–17).
Although measurable in the serum, measurement or visualization of these native substances in the atherosclerotic plaque itself is currently beyond the scope of any available imaging technology used in patients. If they could be made visible in vivo, the initiation, progression and destabilization of plaques, and the effects of medical and interventional therapies could be objectively evaluated.
Based on the pathophysiology of atherosclerosis, both in vitro and in vivo animal studies and clinical trials have used different tracers including fluorescent probes, in plaque imaging studies, but most of these tracers are still not clinically applicable18, 19). Invasive optical coherence tomography (OCT) is used for coronary plaque imaging and can visualize macrophages20, 21). Near-infrared spectroscopy (NIRS) is also used for coronary plaque imaging in patients22). Although lipids as a whole can be imaged, distinguishing individual components is beyond the scope of these imaging techniques. Using magnetic resonance imaging or computed tomography for lipid imaging has also been attempted, but their clinical utility is not yet established23, 24).
Although invasive, angioscopy is a clinically established high-resolution imaging technique that enables direct, colored, and three-dimensional imaging of the coronary arterial wall. Fluorescent angioscopy (FA), both color and near-infrared, have been recently developed using low-molecular weight substances that selectively bind to individual molecules and present a specific fluorescent color for imaging of the molecular components of human coronary plaques not only ex vivo but also in vivo (Table 1)25–28). Dyes such as Evans blue (EB), Nile blue (NB) or Indocyanine green (ICG), Fast green (FG), Trypan blue (TP), and 3-amino-4-hydroxy-5-nitrobenzenesulfonic acid monohydrate (3-ANA) will evoke fluorescence specific for ox-LDL, LDL, HDL, LPC and TG, respectively, all known components of plaque but to date only measurable in serum.
Table 1. Clinically Used Invasive Imaging Techniques for Atherosclerotic Coronary Plaques.
| Tissue imaging | Cellular imaging | Molecular imaging | |
|---|---|---|---|
| Angiography | Yes | No | No |
| IVUS | Yes | No | No |
| OCT | Yes | Yes* | No |
| NIRS | Yes | No | Yes† |
| CA | Yes | No | No |
| DSA | Yes | No | Yes‡ |
| IVM | Yes | Yes§ | No |
| CFA | Yes | No | Yes |
| NIRFA | Yes | No | Yes |
Yes: visualized in vessels clinically. No: not visualized in vessels clinically.
IVUS: intravascular ultrasonography. OCT: optical coherence tomography.
NIRS: near-infrared spectroscopy. CA: conventional angioscopy. DSA: dye-staining angioscopy. IVM: intravascular microscopy. CFA: color fluorescent angioscopy. NIRFA: near-infrared fluorescent angioscopy.
macrophages only.
total lipids.
fibrin and damaged endothelial cells using Evans blue as a biomarker.
foam cell only.
Because, to our knowledge, systematic imaging of the native lipoproteins and their constituents in the human coronary arterial wall has not been performed until now and because the new FA systems might be unfamiliar to many clinicians, the FA systems and their use, focusing on our findings are described in this article.
Fluorescent Angioscopy System
Color Fluorescent Angioscopy (CFA)
The CFA system consists of a fluorescence-excitation unit, an angioscope, a fluorescence-emission unit, and a camera. The fluorescence-excitation unit is composed of a mercury-xenon lamp and 7 sets of band-pass filter (BPF) discs, exchangeable by rotation for the selection of the desired wave length of light ranging from 320 to 760 nm. Another without a filter is used to irradiate white light during conventional angioscopy. The angioscope (modified VecMover, Clinical Supply Co, Gifu, Japan) comprises a 2.5-F fiberscope and a 5-F guiding balloon catheter. It has been approved for clinical use by the Japanese Ministry of Health and Labor and Welfare, and is widely used clinically in Japan.
The fluorescence-emission unit has 7 sets of dichroic membrane and 7 sets of band-absorption filter (BAF) discs, which receive light wavelengths ranging from 360 to 880 nm, and is connected to a 3CCD digital camera (C7780, Hamamatsu Photonics, Hamamatsu, Japan). The obtained images are displayed on a computer screen through a camera controller (C7780, Hamamatsu Photonics).
To observe the vascular lumen, the light and image guides those are incorporated in the angioscope are connected to the excitation and emission units, respectively. After selecting the desired BPF and BAF, the light is irradiated through the BPF and the light guide towards the target. The evoked fluorescence is received by the digital camera through the DM and BAF for successive three-dimensional imaging. The details of this CFA system are described elsewhere29).
Principles for Fluorescent Imaging
To determine the localization of the target substance within the arterial wall, it is necessary to visualize (image) both the target substance and the substances that comprise the arterial wall, i.e., intima and media. Because collagen fibers that mainly contain collagen I are the major constituent of the intima, while smooth muscles the media, light wavelengths for BPF and BAF were searched for collagen I and smooth muscles. As a result, it was found that a pair of BPF of 345 ± 15 nm and a BAF of 420 nm (“A” imaging), and a pair of 470 ± 20 nm BPF and a BAF of 515 nm (“B”-imaging) elicit a blue and a green fluorescence of collagen I and smooth muscles, respectively. Using these pairs of filters, a biomarker that elicits fluorescence characteristic of the target substance was searched. The cut filter, which cuts the fluorescence other than the target substances, was not used in order to simultaneously image the target substance, collagen I, and smooth muscles for the determination of the location of the target substance (Fig. 1).
Fig. 1.
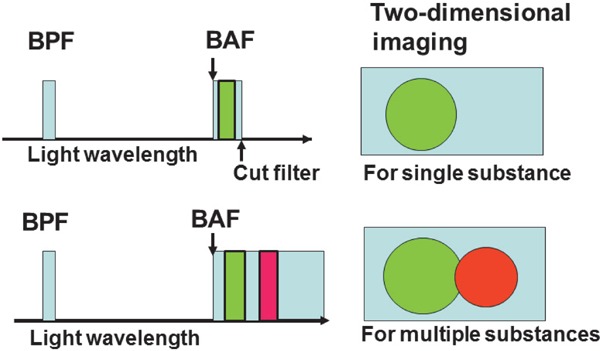
Schematic Representation of Fluorescent Imaging Techniques
A light with a desired wave length is formed by passing white light through a band-pass filter (BPF) to radiate the target substance, and fluorescence that is exhibited by the target substance is selected through a band-absorption filter (BAF). A cut filter is set behind the BAF to image the fluorescence of the target substance alone (upper half), but the cut filter is not set to image fluorescence of both the target substance and other substances (lower half).
Near-infrared Fluorescent Angioscopy (NIRFA) System
For NIRFA, a 710 ± 25 nm BPF and a 780-nm BAF are used for the visualization of the target substance alone because NIRF is monochromatic and it is difficult to distinguish the target substance and those that constitute the arterial wall. For NIRFA, the color CCD camera is replaced by an intensified CCD camera (C3505, Hamamatsu Photonics)26).
Fluorescence of the Major Substances Comprising Atherosclerotic Plaques Examined by Color Fluorescent Microscopy (CFM) or Near-Infrared Fluorescent Microscopy (NIRFM) Using Biomarkers (Fig. 2)
Fig. 2.
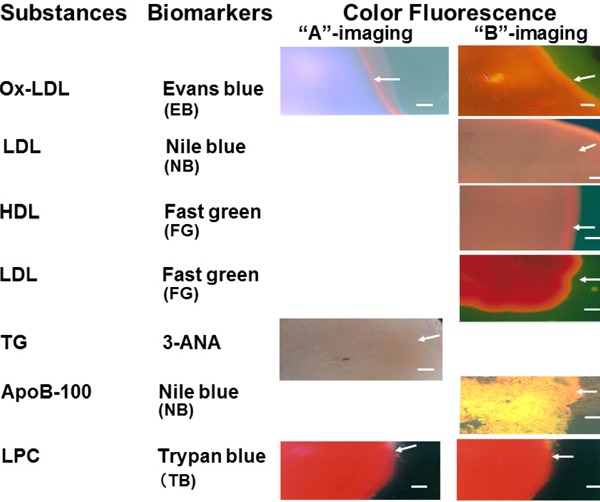
Fluorescent Colors of Major Substances Comprising Atherosclerotic Plaques Elicited by Biomarkers
3-ANA; 3-amino-4-hydroxy-5-nitrobenzenesulfonic acid monohydrate, ApoB-100; apolipoprotein B-100, HDL; high-density lipoprotein, LDL; low-density lipoprotein, LPC; lysophosphatidylcholine, Ox-LDL; oxidized low-density lipoprotein, TG; triglycerides. Bar = 100 µm.
CFM
Using a fluorescent microscopy (Olympus Co, Tokyo) with BPF and BAF for “A” and “B” imaging, the following results were obtained.
EB is clinically used for the evaluation of coronary, pulmonary, aortic, and peripheral vascular lesions30, 31), and the inhibitory effects atherosclerosis are proven32). When used as a biomarker, it evokes violet or reddish-brown fluorescence of ox-LDL with “A” or “B” imaging, respectively. A combination of these fluorescent colors is characteristic of ox-LDL only25, 33). NB has been used as an electromechanical biosensor of DNA34). This dye elicits brown fluorescence of LDL and golden fluorescence of ApoB-100 with “B” imaging35, 36). FG elicits a brown fluorescence of HDL and a red fluorescence of LDL and LPC with “B” imaging37, 38). 3-ANA elicits a dark-brown fluorescence of TG with “A” imaging39). TB, which was clinically used as a treatment for Trypanosoma parasitemia40, 41), elicits a red fluorescence of LPC with both “A” and “B” imaging. Because these distinctive fluorescent colors are not exhibited by any other major substances comprising atherosclerotic plaques, they can be used to identify the aforementioned substances.
NIRFM
LDL exhibits a NIRF in the presence of ICG42). Cholesterol, cholesteryl esters, and calcium phosphate individually do not exhibit NIRF but do so in the presence of β-carotene, which is known to co-deposit with lipotropic substances in atherosclerotic lesions. The other substances in atherosclerotic plaques do not show this characteristic26).
Molecular Imaging of Lipoproteins and Their Components by CFA and CFM in Human Coronary Plaques Ex Vivo
Lipoproteins
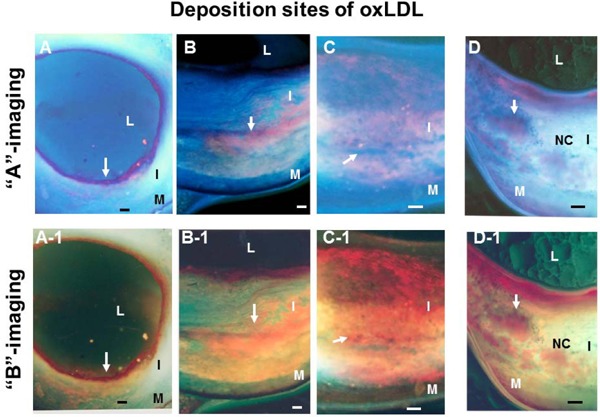
In an ex vivo study, not only yellow plaques without necrotic core (NC) (mature stage of plaque) and yellow plaques with NC (end stage of maturation) but also white plaques (growth stage of plaque) identified by conventional angioscopy29) frequently showed violet fluorescence with “A” imaging, and reddish-brown fluorescence with “B” imaging, after the intracoronary administration of EB, indicating the existence of ox-LDL (Fig. 3). The distribution of this fluorescence was patchy or diffuse.
Fig. 3.
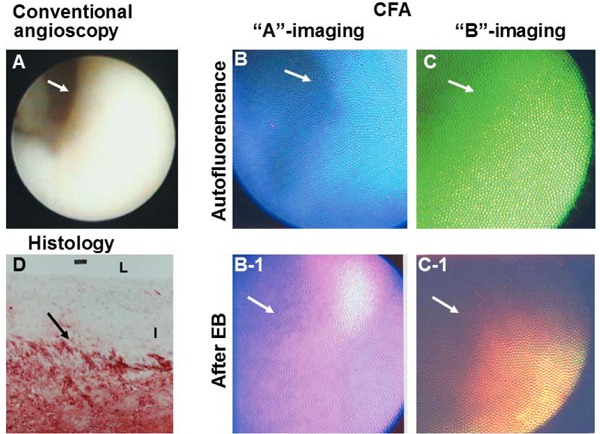
Oxidized Low-density Lipoprotein (Ox-LDL) Imaged by Color Fluorescent Angioscopy (CFA) Using Evans Blue (EB) as a Biomarker
White plaque imaged by conventional angioscopy. Arrow; portion observed by CFA. Before the administration of EB, the plaque shows blue auto-fluorescence with “A” imaging (B) and green auto-fluorescence with “B” imaging (C), indicating collagen I. After the intracoronary administration of EB, the plaque shows violet fluorescence with “A” imaging (B-1) and reddishbrown fluorescence (C-1), which indicates the deposition of ox-LDL. Lipids, which were stained with Oil Red-O and methylene blue, were deposited in deep layer but not in superficial layer of the plaque (D). L and I; lumen and intima, respectively. (cited with permission from ref. 25)
With the CFM scan of coronary luminal surface, ox-LDL frequently exhibited patchy or diffuse deposition pattern in white plaques and yellow plaques without NC (Fig. 4-A-1, A-2), and frequently a web-like deposition pattern in yellow plaques with NC (Fig. 4-B-1, B-2).
Fig. 4.
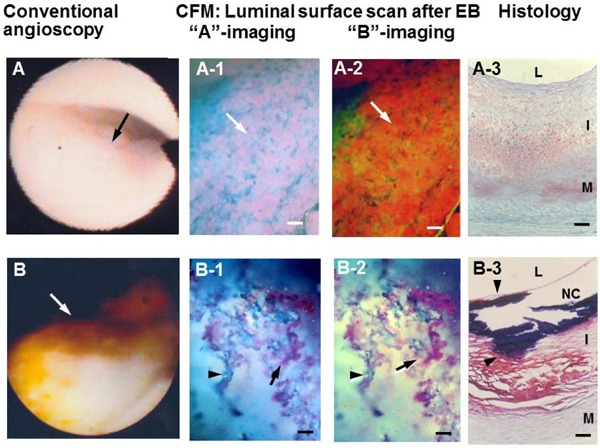
Oxidized Low-density Lipoprotein (Ox-LDL) Imaged by Luminal Surface Scan with Color Fluorescent Microscopy (CFM)
A light-yellow plaque on conventional angioscopy (arrow in A) exhibited diffuse violet (arrow in A-1) and reddish-brown fluorescence (arrow in A-2) after the administration of EB, indicating the deposition of ox-LDL. Histology showed no obvious lipid deposition in the observed portion (A-3). A yellow plaque with a NC on conventional angioscopy and histology (arrows in B and B-3) exhibited web-like violet (arrow in B-1) or reddish-brown fluorescence (arrow in B-2) after the administration of EB, indicating deposition of ox-LDL. L, I, M, and NC; lumen, intima, media, and necrotic core, respectively. Bar: 100 µm. (Cited with permission from ref. 33)
With CFM scan of the transected surface, ox-LDL frequently deposited in the superficial layer in normal segments (Fig. 5-A, A-1), in deep layers in white plaques and in both layers in yellow plaques without NC (Fig. 5-B, B-1; C, C-1), disseminated within NC (Fig. 5-D, D-1)25, 33). The findings suggested that ox-LDL is formed in the superficial layer or entered from the lumen into the coronary intima in normal segments, formed or entered from the adventitia in white or yellow plaques without NC.
Fig. 5.
Oxidized Low-density Lipoprotein (Ox-LDL) Imaged by Scanning the Transected Surface of Plaques by Color Fluorescent Microscopy (CFM)
Ox-LDL deposited either in superficial layer (arrows in A, A-1), deep layer (arrows in B, B-1), or in both (arrows in C, C-1). Ox-LDL deposits were disseminated in the NC (arrows in D, D-1). L, I, M, and NC; lumen, intima, media, and necrotic core, respectively. Bar = 100 µm. (Cited with permission from ref. 33)
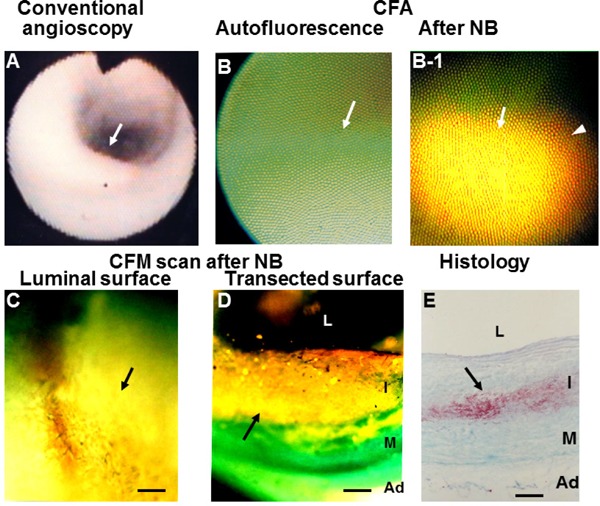
By CFA, the brown fluorescence of LDL elicited by NB was observed in both normal coronary segments and plaques that were classified by conventional angioscopy. LDL deposited alone or co-deposited with ApoB-10035).
The brown fluorescence of HDL evoked by FG showed a diffuse or patchy deposition or there was co-deposition with the red fluorescence of LDL and/or LDL in a mosaic pattern (Fig. 6)37, 38).
Fig. 6.
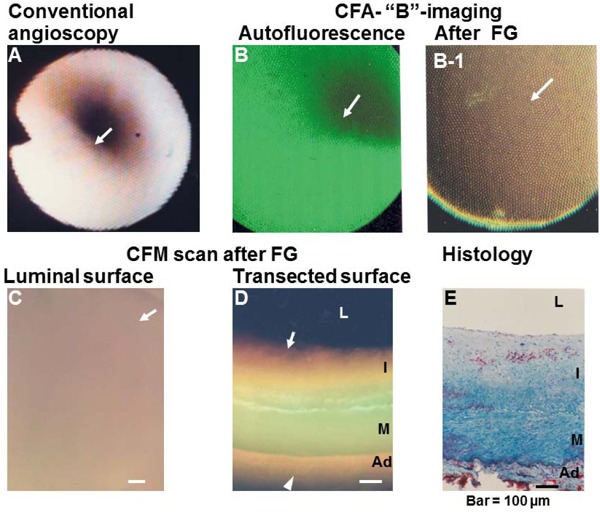
Deposition of High-density Lipoprotein (HDL) in a Coronary Plaque Visualized by “B” Imaging of Color Fluorescent Angioscopy (CFA) and Microscopy (CFM)
(A) Normal coronary segment. Arrow; portion observed by CFA. (B) CFA image of the plaque in (A), showing green fluorescence that indicates collagen I (arrow). (B-1) CFA image after the administration of Fast green (FG), showing brown fluorescence that indicates the deposition of HDL (arrow). (C, D) CFM images of the luminal and transected surfaces of the same plaque, showing brown fluorescence that indicates HDL (arrow). (E) Histology of the same segment after Oil Red-O and methylene blue staining. Lipids (cholesterol and/or cholesteryl esters) show a spotty pattern of distribution in the deep layer of the intima (arrow). L, I, M, and Ad: lumen, intima, media, and adventitia, respectively. Bar = 100 µm.
Substances That Comprise Lipoproteins
Visualization of TG, a major component of the core of ox-LDL and LDL, was successful with “A” imaging by CFA and CFM. TG predominantly deposited in the fibrotic portions of plaque without lipid deposition but not in lipid-laden portions (Fig. 7)39). ApoB-100 as visualized by golden fluorescence was found to be distributed alone or co-distributed with LDL (Fig. 8)36). The red fluorescence of LPC with both “A” and “B” imaging was elicited after the administration of TB to both white and yellow plaques detected by conventional angioscopy27).
Fig. 7.
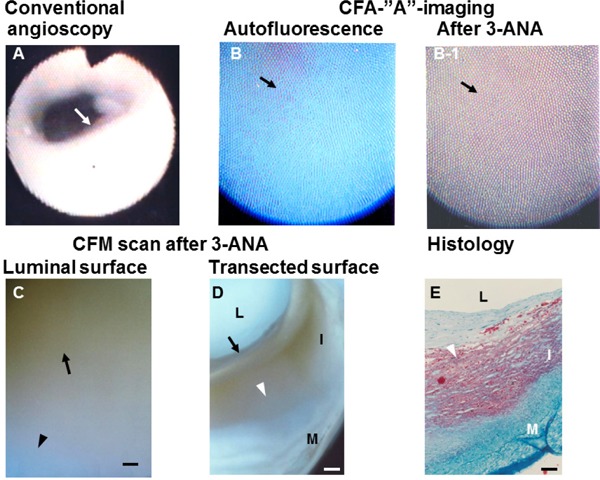
Triglyceride (TG) Imaged by “A” Imaging of Color Fluorescent Angioscopy (CFA) Using 3-ANA as A Biomarker
(A) White plaque (arrow). (B) Blue fluorescence of the same plaque imaged by CFA before the application of 3-ANA, indicating rich collagen I. (B-1) Dark-brown fluorescence elicited by the application of 3-ANA to the same plaque (arrow). (C). Color fluorescent microscopy (CFM) shows dark -brown luminal surface, indicating TG. The transected surface of the same plaque shows deposition of TG in the inner portions of plaque where lipid deposition was not observed (arrow in D). Arrowhead in (D) shows the lipid-laden portion in (E)(E) L, I, and M: lumen, intima, and media, respectively. Scale bars = 100 µm. (Cited with permission from ref. 39)
Fig. 8.
Apolipoprotein B-100 (ApoB-100) in a Coronary Plaque Imaged by Color Fluorescent Angioscopy (CFA) and Microscopy (CFM)
White plaque. Arrow; section observed by CFA. (B) Same plaque before administration of Nile blue (NB) dye (arrow) shows green fluorescence, indicating collagen I. (B-1) Same plaque after administration of NB shows golden fluorescence, indicating diffuse deposition of ApoB-100 (arrow). (C) Luminal surface of the same plaque scanned by CFM shows diffuse and golden fluorescence (arrow). (D) Scan of the transected surface of the same plaque, showing diffuse deposition of ApoB-100 (arrow). (E) Histology of the same plaque after Oil Red-O and methylene blue dye staining shows deposition of lipids in deeper layer of the intima. L, I, M, and Ad: lumen, intima, media, and adventitia, respectively. Bar = 100 µm. (Cited with permission from ref. 36)
Relationship Between the Incidence of Lipoproteins and Their Components and Plaque Morphology
The percentage (%) incidence of ox-LDL observed by CFA and CFM was low in normal segments, increased in white plaques (growth stage), and further increased in yellow plaques without NC (mature stage) but decreased in yellow plaques with a NC (end-stage of maturation), indicating that ox-LDL deposition developed with plaque growth and further increased with plaque maturation but decreased in the end-stage of maturation (Fig. 9). The incidence obtained using CFA was not significantly different from that with immunohistochemical staining, indicating the reliability of CFA in imaging ox-LDL (Fig. 10)33, 43). The mechanisms by which ox-LDL decreases in the end-stage of maturation are obscure. Possibly, it is metabolized or replaced by other substances such as debris. The incidence of LDL was low, showed a tendency to increase with plaque growth but decreased in mature stage (Fig. 9), and there was no significant difference between CFA and immunohistochemical staining (Fig. 10)35, 43).
Fig. 9.
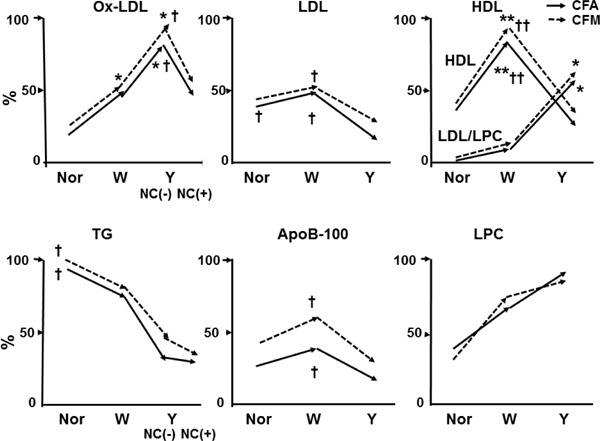
Relationship Between Plaque Morphology and the Percentage (%) Incidence of Lipoproteins and Their Components in Human Coronary Plaques Studied by Color Fluorescent Angioscopy (CFA) and Microscopy (CFM)
Constructed using data from our studies [25, 27, 33, 35, 36, 37, 38, 39]. The autopsy subject group differed for substances examined.
*; p < 0.05, **; p < 0.01 vs. normal segments (Nor). †; p < 0.05, ††; p < 0.01 vs. yellow plaques as a whole (Y) or Y with necrotic core [NC (+)]. No significant difference between CFA and CFM in any substances examined. Oxidized low-density lipoprotein (ox-LDL) increased in white plaques (W) and further in Y without [NC (−)] but decreased in Y NC (+); LDL decreased in Y (both NC (−) and NC (+); high-density lipoprotein (HDL) increased in W but decreased in Y, whereas LDL/LPC increased in Y; triglycerides (TG) decreased in W and further decreased in Y; ApoB-100 decreased in Y; and lysophosphatidylcholine (LPC) showed a tendency to increase in W and Y.
Fig. 10.
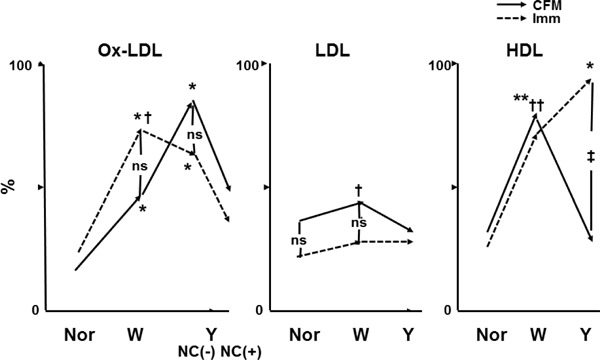
Comparison of the Percentage (%) Incidence of Lipoproteins Between Color Fluorescent Microscopy (CFM) and Immunohistochemical Staining (Imm)
Constructed using data from our studies [25, 35, 37, 38, 43]. Autopsy subject groups differed between CFM and Imm. *; p < 0.05, **; p < 0.01 vs. normal segments. †; p < 0.05, p < 0.01. †† vs. yellow plaques as a whole (Y) or Y with necrotic core [NC (+)]. ‡; p < 0.05 between CFM and Imm. ns; not significant.
The relationship between the incidence of oxidized low-density lipoprotein (ox-LDL) and plaque morphology did not differ between CFA and Imm. The incidence of low-density lipoprotein (LDL) was low for both CFM and Imm and showed no significant difference between them. High-density lipoprotein (HDL) increased in white plaques (W) and decreased in Y on CFM, whereas it increased further in Y on Imm. Because Fast green (FG) elicits a brown fluorescence of HDL while simultaneously eliciting red fluorescence of LDL and lysophosphatidylcholine (LPC), and because LDL/LPC increased in Y, it was considered that the brown fluorescence of HDL was masked by the red fluorescence of LDL/LPC, showing an apparent decrease in HDL in Y on CFM.
ns; not significant.
The incidence of HDL studied using FG as a biomarker increased with plaque growth but decreased in the mature stage (Fig. 9), whereas by immunohistochemical staining, HDL increased in the mature stage (Fig. 10)38, 43). Because FG also elicited red fluorescence of LDL/LPC, it is conceivable that the brown fluorescence of HDL was masked by that of LDL/LPC.
The incidence of TG using 3-ANA as a biomarker was highest in normal segments and decreased with plaque growth and plaque maturation (Fig. 9). Because TG was deposited in the plaques where lipids (cholesterol and/or cholesterol esters) did not deposit (Fig. 7-D, E), this finding suggest that TG deposition was inhibited by the lipids.
The incidence of ApoB-100 was low in any stage of plaque. LPC imaged using TB as a biomarker showed a tendency to increase with plaque growth, but the increase was not statistically significant (Fig. 9).
The difference in incidence between the mature stage and end stage of maturation was not compared in other substances than ox-LDL and TG. The incidence examined by CFM showed a tendency to be higher than with CFA for ox-LDL, HDL, TG, and ApoB-100. Because the depth of imaging by CFA is limited to 200 µm25), substances located deeper than this are not visualized.
Imaging of other important apolipoproteins such as Apo A-1 and E, phenotypes of lipo and apolipoproteins and their oxidized forms has not been performed because they currently do not have specific biomarkers.
Molecular Imaging of Lipoproteins in Coronary Plaques by NIRFA Ex Vivo
Native LDL in coronary plaques was imaged ex vivo by NIRFA using ICG as a biomarker. The percent (%) incidence of LDL increased with plaque growth and decreased in the mature stage as in CFA study. The peak incidence of LDL with NIRFA was higher than that with CFA, probably because of the difference in visualization depth (i.e., 700 µm with NIRFA vs. 200 µm with CFA42). There was no significant difference in the incidence of LDL between NIRFA and immunohistochemical staining42).
Cholesterol and cholesteryl esters exhibited a NIRF in the presence of β-carotene. Their deposits were also imaged by NIRFA in human coronary plaques ex vivo26).
Fluorescent Angioscopy in Patients with Coronary Heart Disease
In our in vivo study, selective injection of EB solution into the coronary artery revealed that not only the plaques but also apparently normal coronary segments frequently exhibited fluorescence, indicating the presence of ox-LDL25). Because NB is lipotropic, intravascular administration in patients was not performed. Instead, we used ICG to image LDL in patients. The in vivo incidence of LDL observed by NIRFA using ICG as a biomarker was similar to that in the ex vivo NIRFA study (Fig. 11)42). HDL was also visualized in patients by CFA using FG as a biomarker with a result similar to that in the ex vivo study37, 38).
Fig. 11.

Low-density Lipoprotein (LDL) Imaged by Near-infrared Fluorescent Angioscopy (NIRFA) Using Indocyanine Green (ICG) as a Biomarker in a Patient with Stable Angina
(A) Angiogram of right coronary artery. (B) Conventional angioscopic (a-1–d-1) and NIRFA images (a-2–d-2) correspond to a–d in (A). Yellow plaque (a-1) and white plaque (c-1) exhibit NIRF. Arrows indicate the same portions observed by conventional angioscopy and NIRFA. (Cited with permission from ref. 42)
Table 2 summarizes the substances comprising human atherosclerotic coronary plaques that were successfully imaged by either CFA or NIRFA in patients ex vivo and/or in vivo.
Table 2. Major Substances Comprising Atherosclerotic Plaques Visualized by Fluorescent Angioscopy in the Human Coronary Plaques.
| Ex vivo | In vivo | |
|---|---|---|
| Oxidizedlow-density lipoprotein | Yes | Yes* |
| Low-density lipoprotein | Yes | Yes† |
| High-density lipoprotein | Yes | Yes* |
| Cholesterol | Yes | Yes† |
| Phosphatidylcholine | No | No |
| Lysophosphatidylcholine | Yes | No |
| Apolipoprotein B-100 | Yes | No |
| Triglycerides | Yes | No |
| Calcium phosphate tribasic | Yes | Yes* |
| Ceramide | Yes | Yes* |
Yes: visualized. No: not visualized.
visualized by color fluorescent angioscopy (CFA).
visualized by near -infrared fluorescent angioscopy (NIRFA).
Other Report with Similar Findings
Sigara, et al. and Nishi, et al. observed an increased ox-LDL content in homogenized unstable human carotid plaques obtained by endoatherectomy44, 45). Vickers, et al. observed a positive relation between ox-LDL content in carotid atherectomy specimen and that in plasma46). Kayo, et al. observed deposition of ox-LDL in NC but not in other portions of ruptured human coronary plaques that were obtained by endoatherectomy47). Fukuchi, et al. observed 8-isoprostaglandin F (2 alpha), a marker of ox-LDL in deep layer of physiologically thickened intima of excised human coronary artery, but did not examine this substance in plaques48). The relationship between the plasma levels of lipoproteins or apolipoproteins and coronary or carotid plaque morphology has been intensively studied49–51); however, there is no published information on the localization of lipoproteins and apolipoproteins or their constituents in coronary or carotid plaques in patients. Thus, the findings presented here appear to be the sole systematic investigation of the imaging of lipoproteins and their components in human coronary plaques ex vivo and/or in vivo.
Study Limitations
Fluorescent angioscopy has the following shortcomings: (1) Visualization by CFA is limited only to substances deposited within 200 µm of the vascular luminal surface and by NIRFA to substances deposited within 700 µm. (2) Because a lens is used, the pictures obtained by CFA and NIRFA are fish-eye images, and therefore, quantitative assessment of the target substance is difficult. Development of new techniques for quantitative measurement of the aforementioned substances is awaited. (3) At present, imaging by FA is limited to certain of the substances that comprise coronary plaques. By selecting adequate biomarkers, substances other than those described here may become visible.
Clinical Implications
Because the incidence of native lipoproteins and their components is different among them, the plaque morphology should be taken into consideration for effective molecular treatment of coronary atherosclerosis.
Conclusion
FA has greatly contributed to our understanding of coronary arterial diseases. Several of the molecules comprising atherosclerotic coronary plaques are now observable in vivo. In the near future, the individual molecules of coronary plaques will become observable with FA systems. Thus, FA may open the door for molecular or chemical imaging of atherosclerotic coronary plaques and accordingly evaluation of therapies targeting coronary plaques.
Disclosure
There are no conflicts of interest to disclose.
Funding
None.
Relation with Industry
None.
References
- 1). Matsuura E, Hughes GR, Khamashta MA: Oxidation of LDL and its clinical implication. Autoimmun Rev, 2008; 7: 558-566 [DOI] [PubMed] [Google Scholar]
- 2). Chen JH, Riazzy, Smith EM, Proud CG, Steinbrecher U: Oxidized LDL-mediated macrophage survival involves elongation of factor-2 kinase. Arterioscler Thromb Vasc Biol, 2009; 29: 92-98 [DOI] [PubMed] [Google Scholar]
- 3). Tardif JC: Emerging high-density lipoprotein infusion therapies: fulfilling the promise of epidemiology? J Clin Lipidol, 2010; 4: 399-404 [DOI] [PubMed] [Google Scholar]
- 4). Negi S, Ballantyne CM: Insights from recent meta-analysis: role of high-density lipoprotein cholesterol in reducing cardiovascular events and rates of atherosclerotic disease progression. J Clin Lipidol, 2010; 4: 365-370 [DOI] [PubMed] [Google Scholar]
- 5). Vilani SS, Nambi V: The role of lipoprotein-associated phospholipse A2 as a marker of atherosclerosis. Curr Atheroscler Rep, 2007; 9: 97-103 [DOI] [PubMed] [Google Scholar]
- 6). Erdogan A, Schaefer MB, Kulmann CR, Most A, Hartmann M: Activation of Ca2+-induced potassium channels is involved in lysophosphatidylcholine-induced monocyte adhesion to endothelial cells. Atherosclerosis, 200; 190: 100-105 [DOI] [PubMed] [Google Scholar]
- 7). Matsubara M, Hasegawa K, Benipine A: A dihydopyridine-calcium channel blocker, prevents lysophosphatidylcholine-induced injury and reactive oxygen species production in human aortic endothelial cells. Atherosclerosis, 2005; 178: 57-66 [DOI] [PubMed] [Google Scholar]
- 8). Matsumoto T, Kobayashi T, Kamata K: Role of lysophosphatidylcholine (LPC) in atherosclerosis. Curr Med Chem, 2007; 14: 3209-3220 [DOI] [PubMed] [Google Scholar]
- 9). Stollenberk MM, Svensson O, Schiopu A, Jansson B, Arnebrant T: A desorption of low-density lipoprotein, its oxidation, and subsequent binding of specific recombinant antibodoes: an in situ ellipsometric study. Biochim Acta, 2011; 1810: 211-217 [DOI] [PubMed] [Google Scholar]
- 10). Kanani FH, Alallenberk MM: Apolipoprotein B in type 2 diabetes—a cross sectional study in a tertiary care set-up. J Pak Med Assoc, 2010; 60: 653-656 [PubMed] [Google Scholar]
- 11). Holewijn S, den Heijer M, Swinkels DW, Stalenhoef AF, de Graaf J: Apolipoprotein B, non-HDL cholesterol and LDL cholesterol for identifying individuals at increased cardiovascular risk. J Intern Med, 2010; 268: 567-577 [DOI] [PubMed] [Google Scholar]
- 12). Enkhmaa B, Annurad E, Zhang Z, Pearson TA, Berglund L: Usefulness of apolipoprotein B/ apolipoprotein A-1 ration to predict coronary artery disease independent of the metabolic syndrome in African Americans. Am J Cardiol, 2010; 106: 1264-1269 [DOI] [PMC free article] [PubMed] [Google Scholar]
- 13). Kappelle PJ, Gansevoort RT, Hillege JL, Wolffenbultel BH, Dullaart RP: Apolipoprotein B/ A-1 and total cholesterol/high-density lipoprotein cholesterol rations both predict cardiovascular events in the general population independently of nonlipid risk factors, albuminuria and C-reactive protein. J Intern Med, 2011; 269: 232-242 [DOI] [PubMed] [Google Scholar]
- 14). Lee YH, Choi SH, Lee KW, Kim DJ: Apolipoprotein B/A1 ratio is associated with free androgen index and visceral adiposity and may be an indicator of metabolic syndrome in male children and adolescence. Clin Endoclinol, 2011; 74: 579-586 [DOI] [PubMed] [Google Scholar]
- 15). Rosenson RS, Carlson DM, Kelly MT, Setze CM, Hirshberg B: Achievement of lipid targets with combination of rosuvastatin and fenofibric acid in patients with type 2 diabetes mellius. Cardiovasc Drugs Ther, 2011; 25: 47-57 [DOI] [PMC free article] [PubMed] [Google Scholar]
- 16). Labreuche J, Touboul PJ, Amarenco P: Plasma triglyceride levels and risk of stroke and carotid atherosclerosis: a systematic review of the epidemiological studies. Atherosclerosis, 203: 331-345 [DOI] [PubMed] [Google Scholar]
- 17). Gandotra P, Miller M: The role of triglycerides in cardiovascular risk. Curr Cardiol Rep, 2008; 10: 505-511 [DOI] [PubMed] [Google Scholar]
- 18). Arranz A, Rudin M, Zaragoza C, Ripoll J: Fluorescent molecular tomography for in vivo imaging of mouse atherosclerosis. Methods Mol Biol, 2015; 1339: 367-376 [DOI] [PubMed] [Google Scholar]
- 19). Olson ES, Whitney MA, Friedman B, Aguilera TA, Crisp JL: In vivo fluorescence imaging of atherosclerotic plaques with activatable cell-penetrating peptides targeting thrombin activity. Integr Biol, 2012; 4: 595-605 [DOI] [PMC free article] [PubMed] [Google Scholar]
- 20). Kataoka Y, Puri R, Hammadah M, Duggal B, Uno K, Kapadia SR: Sex differences in nonculprit coronary plaque microstructures on frequency-domain optical coherence tomography in acute coronary syndromes and stable coronary artery disease. Circ Cardiovasc Imaging, 2016; 9(8). pii: . 10.1161/CIRCIMAGING.116.004506 [DOI] [PubMed] [Google Scholar]
- 21). Wand K, Tetz K, Fischinger IR, Lohmann CP, Maier MM, Feucht N: Functional and morphological microstructural changes in SD-OCT in long-term treatment for neovascular AMD with Ranibizumab-monotherapy versus combination therapy with PDT. Klin Monbl Augenheilkd, 2016; PMID: [DOI] [PubMed] [Google Scholar]
- 22). Madder RD, Husaini M, Davis AT, VanOosterhout S, Khan M, Wohns D: Large lipid-rich coronary plaques detected by near-infrared spectoroscopy at non-stented sites in the target artery identify patients likely to experience future major adverse cardiovascular events. Eur Heart J Cardiovasc Imaging, 2016; 17: 393-399 [DOI] [PubMed] [Google Scholar]
- 23). Li D, Patel AR, Klibanov AL, Kramer CM, Ruiz M, Kang BY: Molecular imaging of atherosclerotic plaques targeted to oxidized LDL receptor LOX-1 by SPECT/CT and magnetic resonance. Circ Cardiovasc Imaging, 2010; 3: 464-472 [DOI] [PMC free article] [PubMed] [Google Scholar]
- 24). Briley-Saebo KC, Shaw PX, Mulder WJ, Choi SH, Vucic E, Aguinaldo JG: Targeted molecular probes for imaging atherosclerotic lesions with magnetic resonance using antibodies that recognize oxidation-specific epitopes. Circulation, 2008; 117: 3206-3215 [DOI] [PMC free article] [PubMed] [Google Scholar]
- 25). Uchida Y, Uchida Y, Kawai S, Kanamaru R, Sugiyama Y, Tomaru T: Detection of vulnerable coronary plaques by color fluorescent angioscopy. JACC Cardiovasc Imaging, 2010; 3: 398-408 [DOI] [PubMed] [Google Scholar]
- 26). Uchida Y, Uchida Y, Sugiyama Y, Kanai M, Sakurai T, Shirai S: Two-dimensional visualization of cholesterol and cholesteryl esters within human coronary plaques by near-infrared fluorescence angioscopy. Clin Cardiol, 2010; 33: 322-325 [DOI] [PMC free article] [PubMed] [Google Scholar]
- 27). Uchida Y, Uchida Y, Kawai S, Kanamaru R, Kameda N: Imaging of lysophosphatidylcholine in human coronary plaques by color fluorescence angioscopy. Int Heart J, 2010; 51: 129-133 [DOI] [PubMed] [Google Scholar]
- 28). Uchida Y, Uchida Y, Kameda N: Visualization of lipid components in human coronary plaques using color fluorescence angioscopy. Circ J, 2010; 74: 2181-2186 [DOI] [PubMed] [Google Scholar]
- 29). Uchida Y: Angioscopy system. In: Coronary angioscopy, Uchida Y. (ed), Futura Publishing Ltd, Armonk, NY, 2001; pp11-103 [Google Scholar]
- 30). Uchida Y, Nakamura F, Tomaru T: Observation of atherosclerotic lesions by an intravascular microscope in patients with arteriosclerosis obliterance. Am Heart J, 1995; 130: 1114-1117 [DOI] [PubMed] [Google Scholar]
- 31). Uchida Y, Uchida Y, Sakurai T, Kanai M, Shirai S, Morita T: Characterization of coronary fibrin thrombus in patients with acute coronary syndrome using dye-staining angioscopy. Arterioscler Thromb Vasc Biol, 2011; 31: 1452-1460 [DOI] [PubMed] [Google Scholar]
- 32). Uchida Y, Uchida H: Therapeutic tool for vascular disease. United States Patent, US7025981 B2, 2006 [Google Scholar]
- 33). Uchida Y, Maezawa Y, Uchida Y, Hiruta N, Shimoyama E, Kawai S: Localization of oxidized low-density lipoprotein and its relation to plaque morphology in human coronary artery. PLos One, 2013; 8: e55188. [DOI] [PMC free article] [PubMed] [Google Scholar]
- 34). Chen ZW, Balamurungan A, Chen SM: Detection of DNA by using bio-conducting polymer-Nile blue composite electrode; Nile blue as an indicator. Bioelectrochemistry, 2009; 75: 13-18 [DOI] [PubMed] [Google Scholar]
- 35). Uchida Y, Maezawa Y, Uchida Y, Hiruta N, Shimoyama E: Molecular imaging of low-density lipoprotein in human coronary plaques by color fluorescent angioscopy and microscopy. PLos One, 2012; 7: e50678. [DOI] [PMC free article] [PubMed] [Google Scholar]
- 36). Hiruta N, Uchida Y, Maezawa Y, Shimoyama E, Uchida Y: Molecular imaging of apolipoprotein B-100 in human coronary plaques by color fluorescent angioscopy and microscopy. Int Heart J, 2013; 54: 68-74 [DOI] [PubMed] [Google Scholar]
- 37). Uchida Y, Hiruta N, Yamanoi D, Shmoyam E, Maezawa Y, Uchida Y: Imaging of native high-density lipoprotein in human coronary plaques by color fluorescent angioscopy. JACC Cardiovasc Imaging, 2013; 6: 1015-1017 [DOI] [PubMed] [Google Scholar]
- 38). Uchida Y, Hiruta N, Yamanoi D, Shimoyama E, Maezawa Y, Uchida Y: Imaging of native high-density lipoprotein in human coronary plaques by color fluorescent angioscopy. Circ J, 2014; 78: 1667-1675 [DOI] [PubMed] [Google Scholar]
- 39). Uchida Y, Uchida Y, Hiruta N, Shirai S, Yoshida T: Imaging of triglycerides in human coronary plaques by color fluorescent angioscopy and microscopy. Am J Cardiol, 2016; 118: 1306-1310 [DOI] [PubMed] [Google Scholar]
- 40). Ralph P, Nakoinz I: Environmental and chemical dissociation of antibody-dependent phagocytosis from lysis mediated by macrophages: stimulation of lysis by sulfohydrylblocking and elastase-inhibitory agents and depression by trypan blue and trypsin. Cell Immunol, 1980; 50: 94-105 [DOI] [PubMed] [Google Scholar]
- 41). Brooks BO, Reed ND: The effect of trypan blue on the early control of Trypanosoma musculi parasitemia in mice. J Reticuloendothel Soc, 1979; 25: 325-328 [PubMed] [Google Scholar]
- 42). Uchida Y, Yoshida T, Shimoyama E, Uchida Y: Molecular imaging of native low-density lipoprotein by near-infrared fluorescent angioscopy in human coronary plaques. Am J Cardiol, 2016; 117: 781-786 [DOI] [PubMed] [Google Scholar]
- 43). Uchida Y, Uchida Y, Shimoyama E, Hiruta N, Kishimoto T, Watanabe S: Human pericoronary adipose tissue as storage and possible supply route for oxidized low-density lipoprotein and high-density lipoprotein in human coronary artery. J Cardiol, 2016; 69: 236-244 [DOI] [PubMed] [Google Scholar]
- 44). Sigara F, Kotosinas A, Savari P, Fillis K, Markantonis S, Lliodorontis EK, Gordoulis VG, Angreadou I: Oxidized LDL in human carotid plaques is related to symptomatic carotid disease and lesion instability. J Vasc Surg, 2010; 52: 704-713 [DOI] [PubMed] [Google Scholar]
- 45). Nishi K, Itabe H, Uno M, Kitazato KT, Horiguchi H, Shinno K, Nagahiro S: Oxidized LDL in carotid plaques associated with plaque instability. Atheroscler Thromb Vasc Biol, 2002; 22: 12649-1654 [DOI] [PubMed] [Google Scholar]
- 46). Vickers KC, Maguire CT, Wolfert R, Bums AR, Reardon M, Geis R, Volvoet P, Morrisett JD: Relationship of lipoprotein-associated phospholipase A2 and oxidized low density lipoprotein in carotid atherosclerosis. J Lipid Res, 2009; 50: 1735-1743 [DOI] [PMC free article] [PubMed] [Google Scholar]
- 47). Kayo S, Ohsawa M, Ehara S, Naruko T, Onoue K: Oxidized low-density lipoprotein levels circulating in plasma and deposited in the trissuues: comparison between Helicobacter pylori-associated gastritis and acute myocardial infarction. Am Heart J, 2004; 148: 818-825 [DOI] [PubMed] [Google Scholar]
- 48). Fukuchi M, Watanabe J, Kumagai K, Baba S, Shimozaki T: Normal and oxidized low-density lipoproteins accumulate deep in physiologically thickened intima of human coronary arteries. Lab Invest, 2002; 82: 1437-1447 [DOI] [PubMed] [Google Scholar]
- 49). Siemelink MA, van der Laan SW, van Setten J, de Vries JP, de Borst GJ, Moll FL, den Ruijter HM, Asselbergs FW, Pasterkamp G, de Bakker PI: Common variants associated with blood lipid levels do not affect carotid plaque composition. Atherosclerosis, 2015; 242: 351-356 [DOI] [PubMed] [Google Scholar]
- 50). Nakazato R, Gransar H, Berman DS, Cheng VY, Lin FY, Achenbach S, Al-Mallah M, Budoff MJ, Cademartiri F, Callister TQ, Chang HJ, Chinnaiyan K, Chow BJ, Delago A, Hadamitzky M, Hausleiter J, Kaufmann P, Maffei E, Raff G, Shaw LJ, Villenis TC, Dunning A, Cury RC, Feuchtner G, Kim YJ, Leipsic J, Min JK: Relationship of low-and highidensity lipoproteins to coronary artery plaque composition by CT angiography. J Cardiovasc Comput Tomogr, 2013; 7: 83-90 [DOI] [PubMed] [Google Scholar]
- 51). Tani S, Nagao K, Anazawa T, Kawamata H, Furuya S, Takahashi H, Iida K, Matsumoto M, Washio T, Kumabe N, Hirayama A: Relationship between apolipoprotein B/apolipoprotein A-1 ratio to coronary plaque regression after pravastatin treatment in patients with coronary artery disease. Am J Cardiol, 2010; 105: 144-148 [DOI] [PubMed] [Google Scholar]