Abstract
Androgen receptor (AR) regulation pathways are essential for supporting the growth and survival of prostate cancer cells. Recently, sub-populations of prostate cancer cells have been identified with stem cell features and are associated with the emergence of treatment-resistant prostate cancer. Here, we explored the function of AR in prostate cancer-associated fibroblasts (CAFs) relative to growth and stem-cell associated characteristics. CAFs were isolated from the murine cPten−/− L prostate cancer model and cultured with human prostate cancer epithelial (hPCa) cells. A murine-specific AR antisense oligonucleotide (ASO) was used to suppress expression of AR in the CAF cells. CAFs express low, but significant levels of AR relative to fibroblasts derived from non-malignant tissue. CAFs promoted growth and colony formation of hPCa cells which was attenuated by suppression of AR expression. Surprisingly, AR-depleted CAFs promoted increased stem cell marker expression in hPCa cells. Interferon gamma (IFN-γ) and macrophage colony stimulating factor (M-CSF) were increased in AR-depleted CAF cells and exhibited similar effects on stem cell marker expression as seen in the CAF co-culture systems. Clinically, elevated IFN-γ expression was found to correlate with histologic grade in primary prostate cancer samples. In summary, AR and androgen-dependent signaling is active in CAFs and exerts significant effects on prostate cancer cells. IFN-γ and M-CSF are AR-regulated factors secreted by CAF cells which promote expression of stem cell markers in prostate cancer epithelial cells. Understanding how CAFs and other constituents of stromal tissue react to anti-cancer therapies may provide insight into the development and progression of prostate cancer.
Keywords: prostate cancer, stroma, cancer associated fibroblast, androgen receptor
Introduction
Androgen receptor (AR) regulated pathways are critical for prostate cancer (PCa) cell proliferation and survival. AR-targeting therapies are a mainstay of treatment in prostate cancer based primarily on effects observed on cell growth, treatment resistance and metastasis in malignant epithelial cells (Huggins and Hodges 1972; Niu, et al. 2008). However, AR is also instrumental in development and maintenance of non-malignant cells in prostate stroma. In utero, AR mediated stromal signals are required for the maturation of epithelial cells and the initiation of ductal morphogenesis during periods when epithelial AR expression is silenced (Cunha, et al. 2004; Prins and Putz 2008). In the post-natal period, AR expression in both stroma and epithelial compartments is required to complete the maturation of the prostate into a functional adult organ. While epithelial cells express higher levels of AR, stromal AR is still essential to maintain the homeostasis between stromal and epithelial cells through the regulation of epithelial cell survival, proliferation, differentiation, and regeneration (Kurita, et al. 2001; Yu, et al. 2012a).
Interactions between the stromal and epithelial compartments are important in the development of normal and malignant prostate tissue. Cancer-associated fibroblasts (CAFs) are the dominant cell type present in stromal tissue in cancer. Previous studies have shown that CAFs express functional AR and play a role in the development and progression of prostate cancer. For example, Niu et al. reported that stromal AR promotes the growth TRAMP and PC3 prostate cancer models (Niu et al. 2008). Lai and colleagues demonstrated that loss of stromal AR in the Pten+/− mouse model led to a reduced incidence of prostatic intracellular neoplasia (PIN) as well as a decreased proliferation rate in non-malignant epithelial cells (Lai, et al. 2012). Yu et al. demonstrated that knocking down AR in CAF cells led to decreased proliferation of normal, non-cancerous, prostate epithelium (Yu, et al. 2012b). In contrast, clinical studies have shown decreased expression of stromal AR is associated with higher Gleason grade (Li, et al. 2008) and an increased risk of relapse after radical prostatectomy (Henshall, et al. 2001). Taken together, these studies support the importance of stromal AR in the development and progression of prostate cancer. However, the basis for tumor-promoting abilities of CAF on prostate cancer remains largely unexplored.
Standard androgen-deprivation therapy simultaneously targets both stromal and epithelial compartments, obscuring effects which may be specific to one compartment or the other. Moreover, concurrently targeting epithelial and stromal compartments precludes study of the cross-talk between compartments, which may uncover novel therapeutic targets. Here, we utilized a mixed-species, co-culture system to specifically explore effects of targeting expression and function of AR in stromal cells. Decreased-AR expression was achieved by co-incubation with a mouse-specific anti-sense oligonucleotide (ASO) to produce AR-depleted CAFs. Mouse CAFs increased the growth of human epithelial PCa cell lines which was attenuated by co-incubation with AR-depleted CAFs. Interestingly, expression of several stem cell marker genes were upregulated in PCa cells grown with AR-depleted CAFs. Further, interferon gamma (IFN-γ) and macrophage colony stimulating factor (M-CSF) were identified as secreted by AR-depleted CAFs which promoted expression of stem cell marker genes in human epithelial PCa cells.
Material and Methods
Cell culture
Mouse prostatic stromal cells, NPF and CAF, were isolated and established from the cPten−/− prostate cancer mouse model as described previously (Liao, et al. 2010a). Briefly, mouse prostatic tissues were minced and cultured in the BFS medium with 1 nM R1881 (Promega). After 2 to 4 passages, viable cells growing in a monolayer with flattened, polyhedral morphology consistent with fibroblasts were detectable with microscopy. The passage number of stromal cells used in this work was from 5 to 15 passages. Human prostate cancer cell lines, LNCaP, C4-2B, and PC3 were purchased from ATCC, cultured and maintained in RPMI1640 with 10% FBS and 1% antibiotics. Culture media was replaced every 3 days.
In co-cultures, stromal cells were seeded and cultured in inserts (pore size: 8.0 um) (BD Bioscience) in 6 well plates with BFS medium. Meanwhile, human PCa cells were seeded in other 6 well plates supplied with RPMI1640 and 10% FBS. On the second day, inserts with stromal cells were placed above the wells with human PCa cells, and the medium was replaced by fresh RPMI1640 with 0.5% charcoal-stripped serum (CSS) and either ASOs or enzalutamide (Selleckchem Chemicals) or control treatments as described. Human PCa cells were collected and analyzed after 24 hours or 7 days in co-culture.
Quantitative reverse transcription PCR (RT-qPCR)
Total cellular RNA, extracted by RNeasy mini kit (Qiagen), was reverse transcribed to cDNA by iScript Reverse Transcription Supermix (Bio-Rad). The reverse transcription reaction was than subjected to PCR amplication using iScript SYBR Green Master (Bio-Rad). PCR signals were recorded and analyzed in CFX96 Real-Time PCR Detection System (Bio-Rad) with CFX software (Bio-Rad). RT-qPCR primer sets used in this report are listed in Supplemental Table 1. All RT-qPCR results were normalized to either mouse β-actin for murine genes or human GAPDH for human genes and averaged across at least three independent replicates.
Cell proliferation analysis
Human cells were labeled with GFP and cultured with either mouse NPF or CAF cells in RPMI1640 (with 5% CSS and 1 nM R1881) and 2.5 μM ASOs. After three days in co-culture, enumeration of GFP-positive cells was performed with flow cytometry.
Two-dimensional (2D) colony forming assay
Human PCa cells (500 cells) and mouse CAFs cells (5×10⁴ cells) were mixed together and seeded in 6-well dishes with RPMI1640 and 10% FBS. Medium was replaced with RPMI1640 and 0.5% CSS after 24 hours. After 7 days, colonies-formed were imaged and counted. Plates were fixed in 4% PFA and stained by 0.05% crystal violet. Bright-field images across the entire plate were acquired and colony formation later quantified.
Detection of PSA expression in co-culture
LNCaP cells (104 cells) were seeded with stromal cells (104 cells) in RPMI1640 with 10% FBS in 24 well plates for overnight. On the second day, medium was replaced by fresh RPMI1640 with 1% CSS. After 24 hours, supernatant was collected and tested for PSA by ELISA (American Qualex).
Cytokine antibody array assay
Mouse CAFs were seeded in BFS medium supplied with 10% FBS for overnight. On the second day, cells were further cultured in serum-free BFS medium for 6 hours, following by a 24-hour culture in BFS with 0.5% CSS and 2.5 μM ASOs. Supernatant was collected and examined in the mouse cytokine antibody array kit panel A (R&D Systems). Array images were analyzed by HLimage++ software (Machine Vision Tools).
Flow cytometry analysis
Cultured cells were trypsinized and washed in PBS. After blocking in Cell Staining Buffer (Biolegend) for 10 minutes on ice, cells were stained by FITC-conjugated CD44 antibody (eBioscience, 0.1 μg / 106 cells) and APC-conjugated CD133 (Miltenyi Biotechnology, 0.1 μg / 106 cells) for 20 minutes on ice, and then examined using BD LSRII Flow Cytometer with BD FACSDiva and FlowJo software.
Immunohistochemistry (IHC) and immunofluorescent (IF) staining
Mouse prostatic tissues were dissected from cPten−/− Luc males. After overnight fixation in 4% PFA, tissues were processed and sectioned. IHC was performed as previously described with anti-mouse AR antibody (Santa Cruz) at 1:1000 dilution (Liao et al. 2010a). For IF staining, mouse NPF and CAF cells were seeded on Lab Tek II chamber slides (Thermo Scientific) with BFS medium for 24 hours, followed by fixing in 4% PFA for 10 mins and washing with PBS. After blocking, Smooth Muscle Actin (SMA) antibody conjugated with Cy3 dye (Sigma) was applied for 1 hour at a 1:60 dilution. For vimentin (Santa Cruz; 1:50 dilution) and N-Cadherin (Santa Cruz; 1:50 dilution), the primary antibody was applied for 1 hour, following by the staining of secondary antibody conjugated with either FITC or rhodamine. Samples were counter-stained with DAPI and then examined with fluorescent microscopy (Observer.Z1, ZEISS).
Western blot analysis
Whole-cell lysates were prepared as previously described (Liao et al. 2010a) with anti- mouse AR (1:100; Santa Cruz) and anti- mouse β-actin (1:1,000; Santa Cruz).
Spheroid formation assay
The basic method was adapted from a previously published protocol (Liao et al. 2010a). Briefly, the CELLection Biotin Binder kit (Invitrogen #115.33D) was used isolate CD44+ cells using the Indirect Isolation technique with anti-CD44 (eBioscience #13-0441-82) and anti-human CD16/CD32 and rat IgG2b K isotype as incubation controls (eBioscience14-0161-82 and 14-4031-82, respectively). One-thousand (103) CD44-selected cells were suspended in 2% Matrigel (BD Bioscience)/RPMI1640 (1% FBS) in a total volume of 500 μL. The mixture was then overlaid into a 24-well plate pre-coated with 100 μL Matrigel. Stromal cells were seeded into an insert (pore size 8.0-μm; BD Bioscience) incubated above the well. The mixture was supplied with additional 1.5 mL RPMI1640 containing 1% FBS and ASOs and cultured at 37°C. Spheroids were stained by 0.05% crystal violet / PBS and counted at 7 days after plating.
TCGA dataset analysis
Normalized RNA-seq expression (RSEM) and patient specific clinical annotations were obtained from the cBio Cancer Genomes portal (http://www.cbioportal.org). The data as reported in The Cancer Genomes Atlas (2015) was derived from 236 patients with either low (n = 174) or high Gleason (n = 62) Scores. The unpublished provisional prostate cancer dataset was derived from 491 patients with low (n = 351) or high (n =140) Gleason scores. RSEM values corresponding to IFN-γ and M-CSF were analyzed using commercially available software (JMP pro, version 12, for Windows). A paired two-tailed t test with a 0.05 confidence interval was used to compare the expression among high Gleason (9,10) or low-/intermediate Gleason (6–8) biopsy scores.
Statistical analysis
All experimental results were repeated a minimum of three times (independent replicates) and are presented as means ± SD. Statistical calculations were done with Microsoft Excel analysis tools. Means were compared using a paired Student’s t test. A threshold of p<0.05 was considered as significant.
Results
Cancer Associated Fibroblasts Express Low Levels of Androgen Receptor in the cPten−/−L mouse prostate cancer model
We compared distribution of AR expression in fibroblasts adjacent to normal prostate glands, prostate intra-epithelial neoplasia (PIN), and invasive adenocarcinoma in murine prostate tissue (Figure 1A). In wild-type (cPten+/+ Luc) animals, diffuse positive staining is noted in peri-glandular fibroblasts (indicated by black arrows). Interestingly, AR+ fibroblasts are also found adjacent (within ~ 10 μm) to a PIN lesion in cPten−/−Luc animals. In contrast, more AR− fibroblasts (green arrows) are noted in regions adjacent to invasive cancer (also in cPten−/−Luc animals). This pattern of low AR expression in CAFs is similar to that observed in human PCa patients (Li et al. 2008). We conclude that peri-tumoral stromal cell express low levels of AR relative to PIN or areas of normal prostate in the mouse cPten−/−L model.
Figure 1.
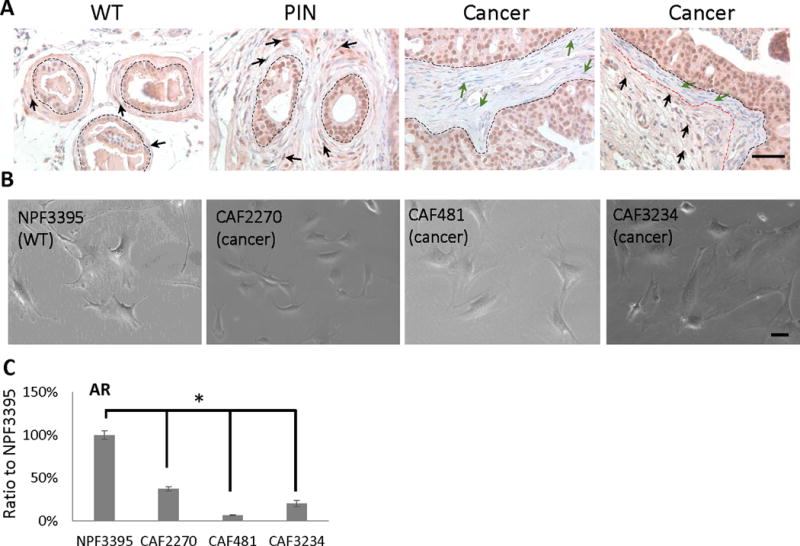
Characterization of mouse prostatic cancer-associated fibroblasts. A, IHC staining of mouse AR on mouse tissue sections from wildtype, PIN and Cancer samples. Black dot line: separating prostate epithelium and stroma; red dot line: separating AR+ and AR− stromal cells; black arrow: AR+ stromal cell; green arrow: AR− stromal cell. Bar: 10 μm. B, bright field images of mouse NPF and CAF cells. Bar: 10 μm. C, comparison of mouse AR mRNA expressions in mouse NPF and CAF cells by RT-qPCR. This RT-qPCR were repeated at least 3 times. (*, p<0.05).
Stromal cells were isolated from cPten−/−Luc animals for further study. Three mouse CAF cell lines, termed 2270, 3234, and 481, were established from cPten−/−Luc animals according to previously published methods (Liao et al. 2010a). A normal prostatic fibroblast (NPF) primary cell line (3395) was also established from a non-cancer (cPten+/+Luc) male mouse as a control. With phase contrast microscopy, both CAFs and NPFs demonstrated an elongated, bipolar morphology typical for fibroblasts (Figure 1B). All four lines exhibited similar expression levels of SMA, N-Cad, and Vimentin expression consistent with a fibroblast phenotype (Supplemental Figures 1–2). As expected the CAF lines demonstrated low expression of CK18 expression, a epithelial cell marker, compared to a mouse prostate cancer cell line as previously described (Liao, et al. 2010c) (Supplemental Figure 2). Interestingly, RT-PCR demonstrated AR expression was observed to be 60–90% lower in CAF lines compared to the NPF control (Figure 1C). Taken together, the CAF2270, CAF3234, and CAF481 cell lines recapitulate the pattern of low AR expression in peri-glandular stromal cells observed in cPten−/−Luc prostate cancer.
Mouse AR-ASO Specifically knocks-down AR Expression in Mouse Cells
We sought to investigate the functional significance of the low level of AR expression in CAFs using a siRNA-based knockdown strategy. Although siRNA is widely used in transient assays to suppress gene expression in cell culture, the short half-life and instability of siRNA make this technique difficult to study for longer-term exposures in vitro. Also, siRNA molecules are double-stranded and require lipid mediated transfection agents to deliver them into cells, which can cause non-specific effects on cells growing in culture and are poorly suited for use as a therapeutic agent in vivo (Frazier 2015). To address these issues, we utilized ASO with 2′–4′-constrained ethyl (cEt)- modifications, which have demonstrated significant pharmacological activities in both preclinical and clinical studies without the need for complex lipid delivery modalities (Hong, et al. 2015; Yamamoto, et al. 2015).
To test the specificity of the mouse AR-ASO, mouse stromal (CAF2270, CAF234, CAF481, and NPF3395) and human PCa (LNCaP and C4-2B) cells were incubated with various concentrations of the mouse AR-ASO for 24 hours in the absence of any transfection reagent, and cellular RNA extracts were analyzed by RT-PCR. The results show a dose-dependent decrease in mouse AR mRNA levels in the NPF and CAF cell lines compared with treatment with a control ASO with the same chemistry but no known targets in murine cells (Figure 2A). Additionally, because cells treated with 2.5 μM mouse AR-ASO showed a 50% or greater suppression in mouse AR mRNA expression, this concentration was used for most of the co-culture experiments in this report, unless otherwise specified. The effect of AR-ASO on AR protein expression was confirmed by Western blot as we also observed a significant decrease in mAR protein expression in NPF and CAF cells after 24-hour incubation with 2.5 μM mAR-ASO. In contrast, no effect on AR expression was observed in cells treated with the control ASO (Figure 2B). Furthermore, as the cEt Gapmer chemistry is stable for several days in biologic conditions (Yamamoto et al. 2015), we tested the effect after 7 days with the mAR-ASO. Consistent with prior results, a significant decrease in mAR expression was observed after 1 day which was decreased even further at 4 and 7 days (Figure 2C). Next, we investigated if the mAR-ASO had any effect on the growth and survival of stromal cell cultures. NPF3395 and CAF2270 were treated with various concentration of mAR-ASO for 3 days and the effect on cell growth was measured with a MTS assay. Neither NPF3395 nor CAF2270 exhibited any decrease in cell growth following mAR-ASO treatment (Figure 2D). Finally, we tested the species specificity of the mAR-ASO. As shown in Figure 3, we observed no effect following treatment with the mouse AR-ASO on AR expression in the human-dervied, AR+ LNCaP or C42B cell lines. Taken together, our results indicate the mouse AR-ASO is able to specifically target and suppress AR expression without affecting cell growth in mouse prostate stromal cells.
Figure 2.
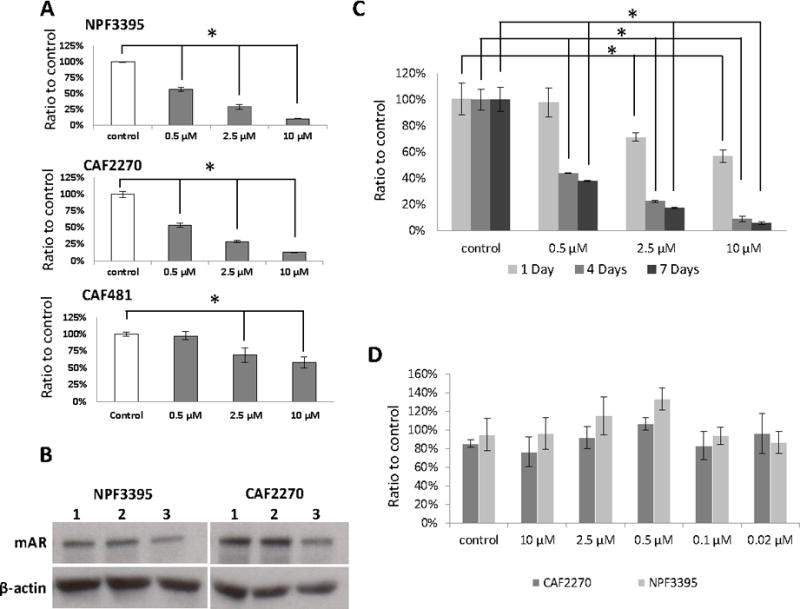
Mouse AR-ASO decreases AR expression in stromal cell lines with little effect on proliferation. A, RT-PCR results of mouse AR mRNA levels in mouse NPF (3395) and CAF (2270 & 481) cells treated with the mouse AR-ASO for 24 hours. B, Western blot results of mouse AR expression in untreated NPF3395 and CAF2270 (lane 1) or following 24 hour treatment with 2.5 μM control ASO (lane 2) or AR-ASO (lane 3). Actin served as the loading control. C, Mouse CAF3234 cells were treated with mouse AR-ASO at various concentrations for 1, 4, and 7 days. Mouse AR expression was analyzed by RT-qPCR. Control, control-ASO (10 μM). (*, p<0.05). D, Mouse CAF and NPF cells were treated with 10 μM control-ASO or mouse AR-ASO at indicated concentrations for 24 hours. Proliferation was assessed by MTS assay. Representative results are presented from ≥3 independent replicates.
Figure 3.
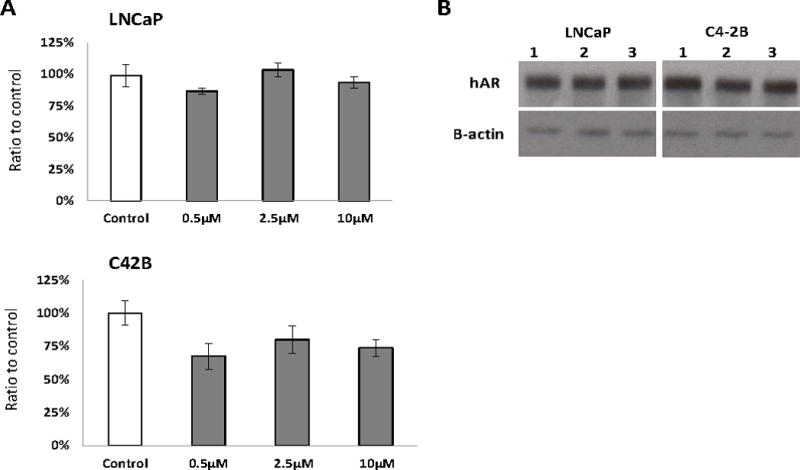
Mouse AR-ASO does not affect the AR expression in human PCa cells. A, RT-qPCR results of the human AR mRNA expression in human prostate cancer LNCaP and C4-2B cells cultured with the mouse AR-ASO for 24 hours. B, Western blot results of human AR expression in untreated LNCaP or C4-2B (lane 1) or following 24 hour treatment with 2.5 μM control ASO (lane 2) or AR-ASO (lane 3). Representative results are presented from ≥3 independent replicates.
CAF-AR Supports Prostate Cancer Cell Growth
To understand the function of stromal AR in prostate cancer, human LNCaP and C4-2B prostate cancer cells were grown along with mouse CAFs. AR expression in CAFs was decreased by treatment with the mouse-specific AR-ASO. Prostate cancer epithelial tumor cells were labeled with GFP by lentiviral vector for enumeration in the co-culture growth assay. In cell proliferation assays, co-culture of LNCaP-GFP or C4-2B-GFP with CAF2270 for 3 days produced a 25% and 200% increase in cell proliferation, respectively (Figure 4A–4B). The growth promoting effect of CAFs was attenuated when AR expression was knocked-down in CAF cells by AR-ASO treatment with a 20% and 65% decrease in proliferation in LNCaP-GFP and C4-2B-GFP co-cultures incubated with AR-ASO, respectively.
Figure 4.
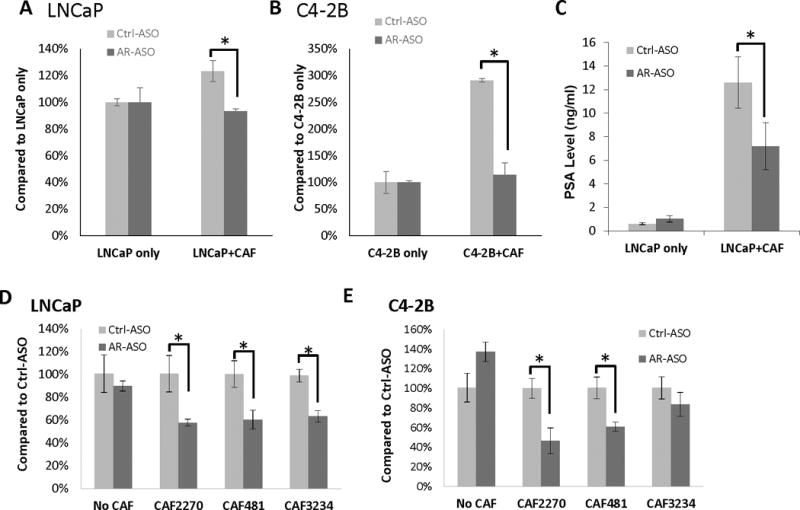
AR expressed in mouse CAFs contributes to the growth of human PCa cells. A and B, Quantification of GFP-labeled LNCaP (A) and C4-2B (B) cells in co-cultures with CAF2270 assessed by flow cytometer (n=3). C, PSA secretion in media collected after 24-hour co-cultures of LNCaP and mouse CAF2270 assessed by ELISA. D and E, Detection of human AR expression levels in LNCaP (D) and C4-2B (E) 1 day after co-culturing with CAFs and assessed by RT-qPCR (*, p<0.05). Representative results are presented from ≥3 independent replicates.
We next investigated if AR expressed in CAFs influenced the expression of androgen-dependent genes in prostate cancer cells. Using the co-culture approach, we found that CAF2270 increased expression of PSA from LNCaP cells by about 12-fold after 24 hours. However, adding the mouse specific AR-ASO to the co-culture attenuated PSA expression to only about 6-fold (Figure 4C). As AR is itself an important AR-target gene (reviewed in (Bluemn and Nelson 2012; Brooke and Bevan 2009; Heinlein and Chang 2004)), we next investigated the effect of knock-down of AR expression in CAFs on AR expression in cancer cells in the co-culture system. Incubation of LNCaP and C4-2B cells alone with control or the mouse specific AR-ASO had no effect on cell proliferation or AR expression (Figure 3 and 4D–E). However, when LNCaP and C4-2B cells were grown with CAF cells, treatment with AR-ASO led to a decreased AR expression in prostate cancer cells within 1 day (Figure 4D–E). Taken together, our data shows AR expressed in CAFs increases growth and expression of androgen-dependent genes in epithelial cancer cells.
Next, we sought to determine if AR expression in CAFs influenced tumorigenesis using a 2D colony formation assay. Five hundred LNCaP-GFP cells were seeded with 5×10⁴ mouse CAF cells and incubated with control or mAR-ASO. After 7 days, LNCaP-GFP cells formed colonies which were surrounded by fibroblast cells (Figure 5A). Co-culture of LNCaP cells with CAFs produced 2–3-fold more colonies than LNCaP cells cultures alone (Figure 5B). Knock-down of AR expression in CAF cells significantly reduced LNCaP colony formation while no effect was observed with the control ASO (Figure 5B and 5D). A similar effect was observed when AR− PC3 cells were incubated with CAFs in the presence of AR-ASO versus control ASO (Figure 5C). These results show the importance of AR expression in CAFs in supporting proliferation and 2D colony formation independent of expression or changes in AR-expression in epithelial cells. Overall, we demonstrate that AR expressed in CAFs influences the growth, AR expression, and tumorigenic phenotypes in human prostate cancer cells.
Figure 5.
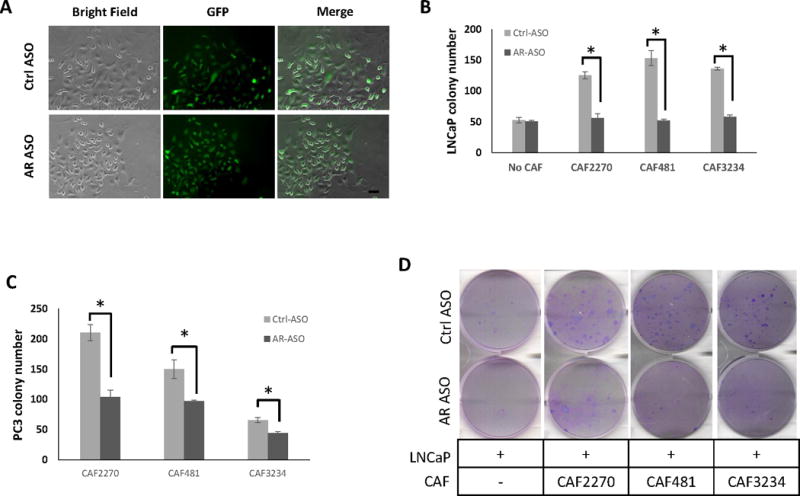
AR expression in CAFs increases colony forming ability of PCa cells. A, Cell morphology of LNCaP cells in colonies with CAFs under AR suppression or control. LNCaP cells were labeled with GFP. Bar, 50um. B and C, the comparison of the number of colony formed in LNCaP (B) and PC3 (C) in co-cultures with different CAFs treated with 2.5 μM mouse AR-ASO or control ASO (Ctrl-ASO) (n=3) (*, p <0.05). D, Colonies (dark purple) formed from LNCaP in the wells of 6-well plates without or with CAFs on day 7 (n=3).
AR Expression in CAFs influences stem cell marker expression in epithelial cells
As previous work demonstrated CAFs can induce stem cell-like characteristics in prostate cancer cells and expression of stem cell markers is known to be related to tumorigenesis (Eppert, et al. 2011; Geary, et al. 2014; Hu, et al. 2015; Liao, et al. 2010b; Merlos-Suarez, et al. 2011; Syed, et al. 2016), we investigated if selective suppression of AR in CAFs affected expression of stem cell markers in human prostate cancer cells.
RNA was isolated from LNCaP cells grown with CAFs in the presence of AR-ASO or the control ASO and the expression of genes associated with stem cells was analyzed by RT-qPCR. After 1 day, a significant increase in Oct4, Sox2, and Nanog mRNA levels was noted in most cultures, and was observed in all cultures on day 7 (Figure 6A). We observed a similar trend in co-cultures of PC3 (Figure 6B) and C4-2B (Supplemental Figure 3) cells with CAFs. Our observations suggest that decreasing expression of AR in CAF cells increases the expression of “stemness” markers in prostate cancer cells.
Figure 6.
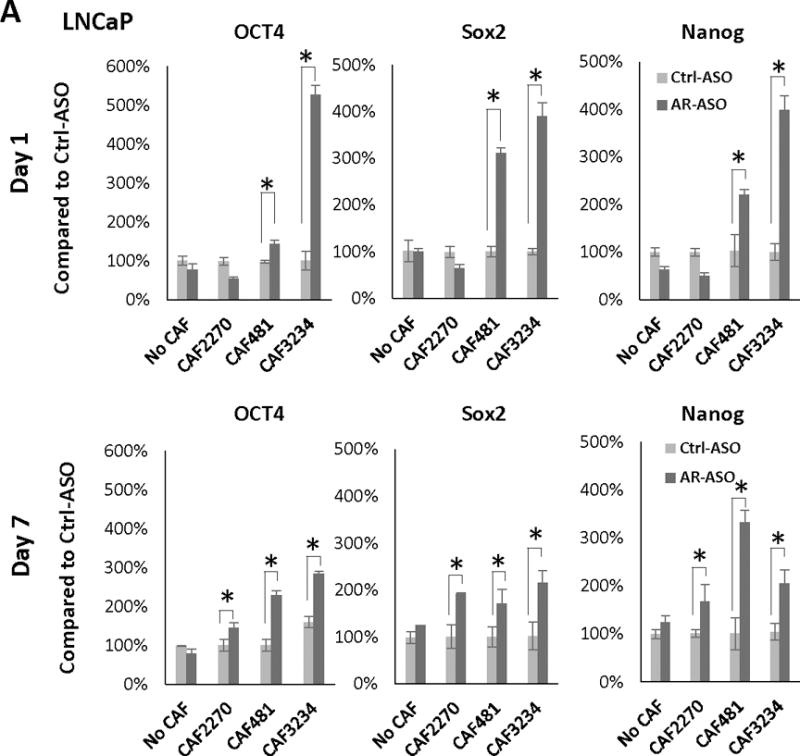
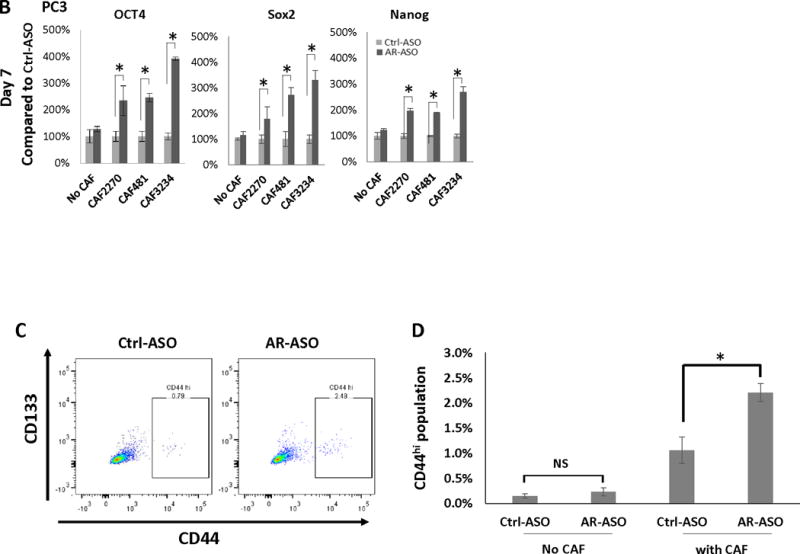
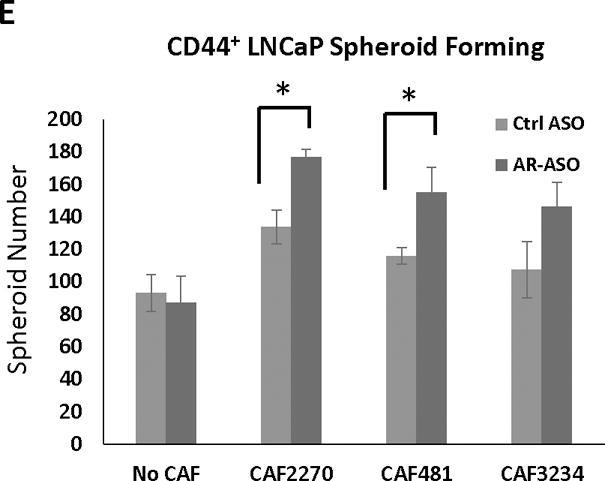
Decreased AR-expression in CAFs increases stem cell marker expression and stem cell population in PCa cells. Expression of Oct4, Sox2, and Nanog in LNCaP (after 1 or 7 days treatment) (A) and PC3 (after 7 days of treatment) (B) cells cultured with or without CAFs following the treatment with 2.5 μM AR-ASO or control ASO analyzed with RT-PCR is presented. C, Flow cytometry analysis of stem cell marker expression in LNCaP cells. 2D gating plot of CD133 and CD44 positive LNCaP cells after 7 days in the presence of CAF3234 and treatment with control-ASO or AR-ASO, as indicated. D, Relative abundance of CD44hi LNCaP cells in co-cultures with mouse ASOs with or without CAF3234. NS, not significant. E. Colony formation of CD44+ PCa cells co-cultured with 2.5 uM AR-ASO and control ASO, and colonies were counted after 7 days. (*, p<0.05). Representative results are presented from ≥ 3 independent replicates.
Next, we sought to validate the relationship between AR expression in CAF and stem cell marker expression in prostate cancer cells at the protein level. CD133 and CD44 are considered markers for cancer stem cells based on their enrichment in cells with “stem cell-like” properties such as tumor-initiation and treatment resistance (Clevers 2011; Collins, et al. 2005). Therefore, we tested whether inhibition of AR-expression in CAFs influenced the expression of CD133 and CD44 in prostate cancer cells (Figure 6C and 6D). No significant CD133 expression was detected in LNCaP cells in any of the conditions tested. However, CD44+ was detected in a small sub-population (~0.2%) of LNCaP cells. Co-culture of the LNCaP cells with CAF3234 significantly increased the proportion of CD44hi cells to ~1% which was even further increased to 2.2% by treatment with AR-ASO (Figure 6C and 6D). Thus, our results show that co-culture with AR-depleted CAFs leads to significantly increased expression of stem cell markers in human PCa cells.
Our previous study revealed that the spheroid-forming ability of PCa CSCs in 3D cultures is highly regulated by CAFs (Liao et al. 2010a). Therefore, to investigate whether stromal-AR in CAF may participate in this regulation, we performed spheroid-forming assay by co-culturing CD44+ enriched LNCaP cells with CAFs and ASOs in Matrigel. While spheroid formation was observed in all conditions, incubation with AR-depleted CAFs significantly increased LNCaP spheroid formation compared to controls (Figure 6E). However, no effect was observed when AR-depleted CAFs were incubated with unsorted LNCaP cells (data not shown). These results suggest that AR-depleted CAFs promote the growth of a sub-population of epithelial cancer cells with stem-cell like features.
IFN-γ and M-CSF are AR-regulated Factors Secreted by CAFs which affect Stem Cell Marker Expression in PCa cells
As the changes in stem cell marker expression were observed with CAFs grown on porous inserts placed above prostate cancer cells, we hypothesized that soluble factors produced by CAFs could mediate this effect. We used a commercially available antibody array to investigate differential expression of secreted proteins in CAF-conditioned media following culture with AR-ASO or control ASO. Mouse CAFs were seeded in RPMI1640 with 10% FBS overnight. Then, the media was changed to 0.5% CSS for 6 hours followed by treatment with AR-ASO or control ASO. The cell-free supernatants were collected and protein expression in the conditioned media was analyzed with a commercially available cytokine antibody array (Figure 7A). With this approach, we identified IFN-γ and M-CSF as candidate cytokines up regulated in AR-ASO treated CAF2270. Similar results were observed with the other CAF cell lines such that treatment with mAR-ASO led to ~4–6-fold induction of IFN-γ (Figure 7B) and ~1–3-fold induction of M-CSF (Supplementary Figure 4). We used RT-qPCR to confirm the results observed with the protein array. Specifically, we observed an increased in IFN-γ expression in CAFs following treatment with the AR-ASO (Figure 7D). Therefore, we hypothesized that IFN-γ and M-CSF could promote expression of stem cell genes in prostate cancer cells.
Figure 7.
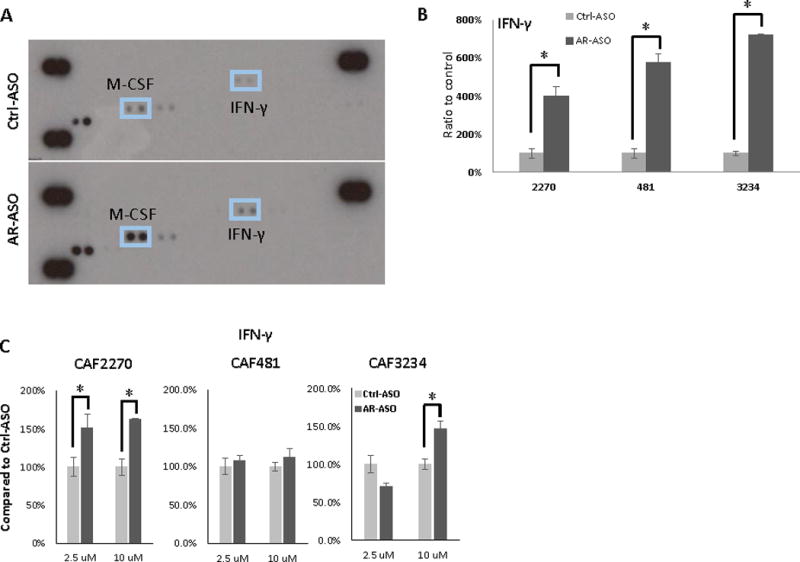
Differential expression of secreted proteins in media obtained from CAF cells incubated with AR-ASO. A, Representative images of cytokine array incubated with the media from CAF2270 cells treated with AR-ASO or Ctrl-ASO. Tabulated results from multiple independent experiments are presented. Images were quantified and compared across duplicates for IFN-γ (B) with media obtained from CAF2270, CAF481, and CAF3234 cells. C, RT-qPCR detection of IFN- IFN-γ in CAFs after treatment with ASOs. (*, p<0.05). Cytokine array analysis and RT-qPCR were repeated at least 3 times.
To further explore the effects of IFN-γ on human prostate cancer cells, LNCaP cells were treated with increasing doses of mouse IFN-γ (mIFN-γ, 10–200 ng/ml) or a vehicle control and the expression of Nanog, Sox2, and Oct4 were measured by RT-qPCR. The results show a dose-dependent increase in expression of all 3 stem cell markers following mIFN-γ treatment in LNCaP, PC3, and C4-2B cells (Figure 8A–C). Similar results were observed for human IFN-γ (hIFN-γ) treatment. Specifically, we also observed a dose-dependent increase in Oct4, Nanog, and Sox2 with hIFN-γ treatment of LNCaP cells (Figure 8D). Finally, the effect of mIFN-γ on stem cell marker expression was confirmed using a blocking antibody. Specifically, LNCaP cells were treated with mIFN-γ with or without an IFN-γ receptor blocking antibody (anti-hIFN-γR). The results show that anti-hIFN-γR decreases the stimulation of Oct4 and Nanog observed with mIFN-γ treatment of CAF cells.
Figure 8.
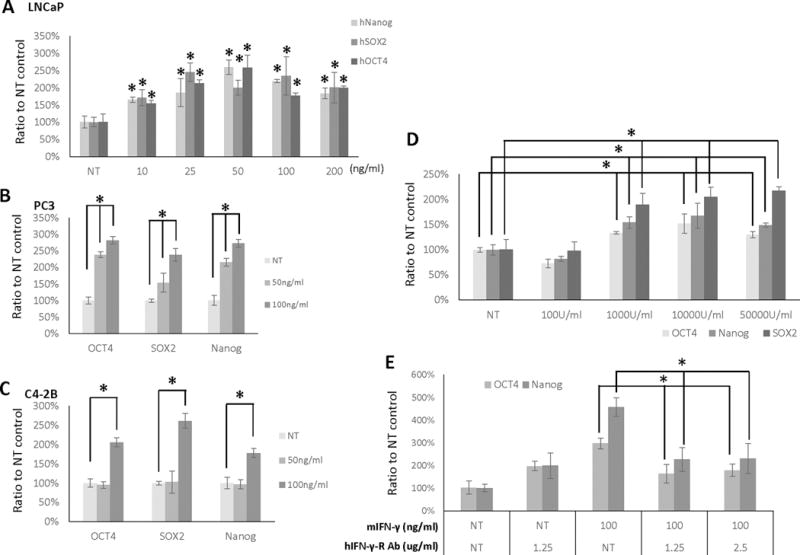
IFN-γ stimulates expression of “stemness” markers in PCa cells, which is attenuated by anti- IFN-γR antibody. LNCaP (A), PC3 (B), and C4-2B (C) cells were treated with mIFN- γ treatment for 24 hours at the doses indicated. D, LNCaP cells were treated with hIFN-γ at the indicated doses for 24 hours. E, LNCaP cells incubated with mIFN-γ and anti-IFN-γR antibody for 24 hours at the doses indicated. NT, non-treated. (*, p<0.05). Representative results are presented from ≥ 3 independent replicates.
A similar approach was used to explore the effects of M-CSF on stem cell marker expression in human prostate cancer cells. Accordingly, mouse M-CSF (mM-CSF) demonstrated a dose dependent increase in stem cell marker expression in LNCaP, PC3, and C4-2B cells (Supplemental Figure 5A–C). A similar dose-dependent effect on Oct4, Sox2, and Nanog expression was also observed in LNCaP cells treated with human M-CSF (Supplemental Figure 5D). Furthermore, M-CSF-receptor blocking antibody decreased the effect of mM-CSF treatment on Oct4 and Nanog expression (Supplemental Figure 5E).
Anti-androgen treatment promotes expression of IFN-γ and stem-cell markers
Enzalutamide is a highly potent antiandrogen recently approved for the treatment of metastatic castrate-resistant prostate cancer. As anti-androgen treatments are expected to exert effects equally on stromal and epithelial cells, we sought to confirm the results observed with the AR-depleted CAFs with enzalutamide treatment in the same co-culture system. First, we observed the treatment of CAF cells with 25 μM enzalutamide for increased IFN-γ expression analyzed with RT-qPCR (Figure 9A). As PC3 represents an AR− human prostate cancer cell line, enzalutamide has no effect on the growth of this cell line. In control cultures without CAFs, enzalutamide did not affect the mRNA expressions of Oct4, Sox2 and Nanog in PC3 after 24 hours (Figure 9B). However, when CAFs were grown along with PC3 cells, enzalutamide significantly increased stem cell marker expression (Figure 9B). Thus, these results support the importance of stromal AR signaling on promoting stem-cell expression in prostate cancer cells.
Figure 9.
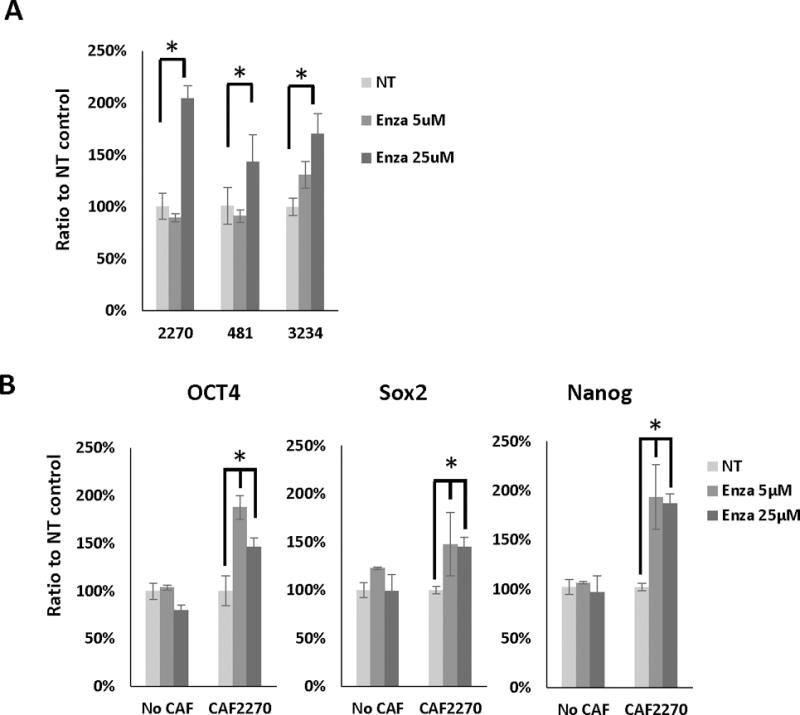
Enzalutamide increases IFN-γ and stem cell marker expression in CAFs and prostate cancer cells. A, RT-qPCR results of IFN-γ expression in CAFs treated with 5 or 25 μM enzalutamide or no treatment (NT) control. B, RT-qPCR results of Oct4, Sox2 and Nanog expression PC3 cells co-cultured with CAFs and treated 5 or 25 μM enzalutamide for 24 hours. *, p<0.05. Representative results are presented from ≥ 3 independent replicates.
Elevated IFN-γ expression is associated with high Gleason grade
Pathologic Gleason grade is a critical pathologic feature used in prognostication and treatment planning for patients with newly diagnosed prostate cancer (Epstein, et al. 2006). Our data suggests that IFN-γ expression in prostate tissue would promote the growth of a rare sub-population of epithelial cancer cells with stem-cell like phenotypes. Other data suggests that increases in a stem-cell like population would be expected to lead to worse prognosis. Thus, we investigated a possible link between IFN-γ and Gleason score. We identified two TCGA datasets (Cerami, et al. 2012; Gao, et al. 2013) with patient specific annotations including Gleason score and gene expression. Interrogation of these TCGA datasets revealed that INF-γ expression is elevated in patients with high Gleason score (p < 0.006 and <0.0001, Figure 10 A–B).
Figure 10.
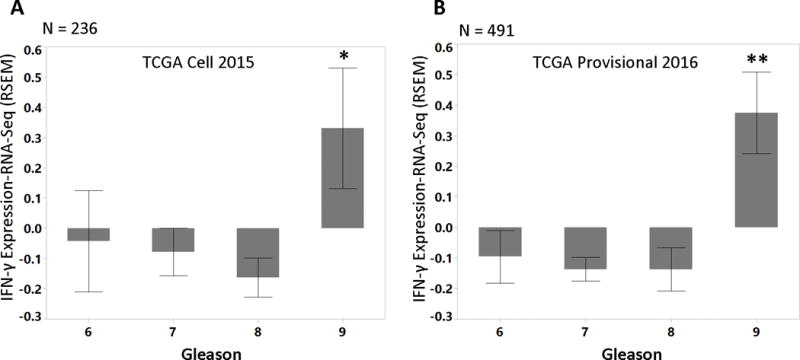
Patients with Gleason score 9 and above showed elevated IFN-γ expression. Two TCGA datasets with clinical annotation including Gleason scores were used to interrogate the RNA expression of IFN-γ: (A) 236 patients from the dataset published in Cell (2015) (2015) (* p<0.006), and (B) 491 patients from unpublished provisional prostate cancer dataset (Cerami et al. 2012; Gao et al. 2013)(** p<0.0001).
Discussion
In this report, we explored the role of AR expressed in CAFs to the growth and development of prostate cancer. Our work suggests that while AR is decreased in fibroblasts isolated from areas near malignant glands compared with those isolated from non-malignant regions, this residual AR is still functional. Specifically, we show AR expressed in CAFs contributes to the tumor-promoting abilities that CAFs exert on epithelial prostate cancer cells. Further, we found that decreased AR expression in CAFs is also associated with an increase in stem cell marker gene expression in prostate cancer epithelial cells. Finally, we identify IFN-γ and M-CSF as candidate cytokines secreted by CAFs and increased by AR-suppression, which promote the expression of stem cell markers in prostate cancer cells.
IFN-γ has been extensively studied based on its potent role as an immunomodulatory cytokine relevant to immune response and cancer (Borden, et al. 2007). Of particular relevance, IFN-γ has been associated with both pro- and anti-tumor effects depending on factors specific tumor types, microenvironments, and immune contexts (Zaidi and Merlino 2011). While stem cell markers are not known to be direct IFN-γ regulated genes, IFN-γ has been associated with changes in development and differentiation in the hematopoietic and lymphocytic systems (Baldridge, et al. 2010; de Bruin, et al. 2013; Schroder, et al. 2004). Similarly, increased IFN-γ signaling has been associated with aplastic anemia in patients (Chang, et al. 2010; Dufour, et al. 2004; Lin, et al. 2014; Serio, et al. 2011) and with induction of a hematopoietic stem cell phenotype in an animal model (Lin et al. 2014). However, we are not aware of any previous studies which suggested a role of IFN-γ in epithelial cell reprogramming or maintenance of cancer stem cells.
M-CSF (also known as colony-stimulating-factor-1, CSF1) has also been previously studied in the context of immune regulation and cancer (Stanley, et al. 1997). M-CSF controls survival and differentiation of macrophages. Mice homozygous for an inactivating M-CSF mutation exhibit osteopetrosis due to a defect in generation of osteoclasts, a specialized type of tissue macrophage (Yoshida, et al. 1990). High M-CSF expression has been associated with early development of metastasis and a poor prognosis for a variety of solid tumors including breast, ovarian, endometrial, sarcoma, and renal cell carcinoma (Laoui, et al. 2014). M-CSF/CSF1R signaling is involved in recruitment of tumor associated macrophages. In particular, M-CSF/CSF1R promotes differentiations and survival of TAMs with an M2-like, “pro-tumorogenic” phenotype. Recently, Escamilla et al. reported on the role of M-CSF/CSF1R and androgen-deprivation therapy in prostate cancer. Specifically, they found that androgen-deprivation therapy induced recruitment of TAMs which expressed CSF1R and exhibited an M2-phenotype. Anti-androgen therapy increased M-CSF expression in cancer cells and a CSF1R inhibitor increased the duration of response to androgen-blocking therapy. The current work shows that CAFs are also a potent source of M-CSF in response to androgen-targeting therapy which can also support recruitment of M2 TAMs and may be therapeutically targeted with M-CSF/CSF1R inhibitors, which could lead to the improvement in the efficacy and durability of ADT for prostate cancer.
Other data suggests that acquisition of stem cell marker expression and stem cell phenotypes are critical in primary prostate cancer tumorigenesis and progression to treatment resistant, metastatic prostate cancer (Glinsky, et al. 2005; Goldstein, et al. 2010; Markert, et al. 2011; Smith, et al. 2015). Based on the CSC hypothesis, cancer cells can be characterized into three groups: CSCs, transient-amplifying (TA) cells, terminal-differentiation (TD) cells, and only CSCs are immortalized with no limitation in proliferation and are able to resistant to cancer treatments (Pfeiffer and Schalken 2010). Here, we show that decreasing expression of AR in CAFs can stimulate stem cell marker expression in PCa cells, though it is unclear which cell subpopulation (CSC, TA or TD) is affected by the signals. Moreover, while both IFN-γ and M-CSF are identified as stromally-secreted factors which influence stem cell marker expression, our work does not exclude the presence of other factors which could work alone or together along with IFN-γ and M-CSF to promote cancer stem cell marker expression.
Interestingly, we found AR-depleted CAFs supported cancer epithelial cells to form spheroids in matrigel in 3D cultures, but not colonies in a 2D proliferation assay. It has been reported that cancer spheroids in biomaterial scaffolds are developed from single CSCs, which differentiate to various daughter cells that construct glandular-like spheroids in three-dimensional environment (Leong, et al. 2008; Liao et al. 2010a). Similar to normal stem cells, the role of CSCs in cancer is majorly maintaining the homeostasis of cancer (Lawson and Witte 2007). And the growth of cancer is contributed by proliferation of more differentiated cancer cells (White and Lowry 2015). Hence, the secreted signaling by AR-depleted CAFs is most likely directing the fate of CSCs, not differentiated cells, in prostate cancer development.
Our results should be viewed in context with other reports also focusing on the role of stromal AR expression in prostate cancer. Previously, Tanner et al. found that genes in the TGFβ, Wnt, Hedgehog, and MAP kinase pathways were differentially expressed in androgen-treated, AR-transfected human prostate stromal cell line (WPMY) (Tanner, et al. 2011). Subsequently, Leach et al. found that stromal-AR is important in maintenance of an extra-cellular matrix which is less permissive to prostate cancer cell invasion using AR-transfected, hTERT- immortalized prostate myofibroblast cell lines in a subrenal capsule tumor formation model (Leach, et al. 2015). Neither of these studies report changes in IFN-γ or M-CSF expression after AR-transfection or androgen-stimulation. This may reflect inherent limitations in the techniques and cell lines used for these studies as our approach focused on changes in secreted proteins associated with decreased AR-expression. Thus, we provide the first evidence that stromal AR and epithelial stemness are linked through the IFN-γ and M-CSF regulation pathways.
A unique feature of our approach is the use of murine-human co-culture system which allows for the species-specific knock down of mAR in CAF cells without direct effects on AR expression in epithelial cancer cells (Figures 2 and 3). Xenografts are a standard approach to study human prostate cancer cells in the context of murine stromal tissues in vivo. Here, we have extended this methodology by mixing murine stromal cells with human prostate cancer epithelial cells with a co-culture system in vitro. However, there are potential limitations inherent in our approach as it is possible that there are species-specific differences in signaling pathways and cellular responses which could limit the generalizability of our observations to human cancer patients. Although we did verify the effects of both human and murine-derived IFN-γ and M-CSF on prostate cancer cells, we cannot rule out the possibility the AR expression in human stromal cells reacts differently to AR-depletion than our studies based on murine CAFs.
The clinical relevance of our work extends to the use of androgen-deprivation therapy in caring for patients with advanced prostate cancer. While targeting the androgen axis in epithelial cancer cells has been the focus for drug development in caring for prostate cancer patients, our work suggests that efforts should also be directed at understanding the relative effects on androgen-targeting and other therapies on the stromal compartment as well. Further, one could envision a strategy of combining stromal- and epithelial-targeting therapies to produce maximize an anti-cancer effect. Additional studies will be needed to more directly translate these results into patient care.
Supplementary Material
Supplemental Figure 1. IF staining on mouse NPF3234, CAF2270, CAF481, and CAF3234. A, SMA (red); B, Vimentin (green); C, N-Cad (red). Cell nuclei were colored by DAPI (blue). Bar: 10 μm.
Supplemental Figure 2. mRNA expression levels of mesenchymal and epithelial markers in mouse CAFs and NPFs. Relative expression of N-Cad (A), Vimentin (B), and CK18 (C) in NPF3395, CAF 2270, CAF3234, and CAF481by RT-PCR is presented (n=3). CE1 and E2 are mouse epithelial prostate cancer cells as previous described (Liao et al. 2010b) (*, p<0.05). Representative results are presented from ≥ 3 independent replicates.
Supplemental Figure 3. AR-depleted CAFs induced expressions of stemness genes in C4-2B. C4-2B cells were co-cultured with CAF3234 and ASOs (2.5 μM) after 7 days of treatment. mRNA expressions of OCT4, Sox2, and Nanog in C4-2B were examined by RT-qPCR (n=3). *, p<0.05. Representative results are presented from ≥ 3 independent replicates.
Supplemental Figure 4. M-CSF stimulates expression of “stemness” markers in PCa cells, which is attenuated by anti-M-CSF-R antibody. A, M-CSF expression in cytokine array incubated with media from CAFs treated with AR-ASO or Ctrl-ASO were quantified and compared (n=3). LNCaP (B), PC3 (C), and C4-2B (D) cells were treated with mM-CSF treatment for 24 hours at the doses indicated (n=3). E, LNCaP cells were treated with hM-CSF at the indicated doses for 24 hours (n=3). F, LNCaP cells incubated with mM-CSF and anti-MCSF-R antibody for 24 hours at the doses indicated (n=3). NT, non-treated (*, p<0.05). Representative results are presented from ≥ 3 independent replicates.
Supplemental Table 1. List of RT-PCR primer sets.
Acknowledgments
We thank Dr. David Agus and all members of the Center for Applied Molecular Medicine for assistance in various aspects of this work. We also gratefully acknowledge Dr. Pradip Roy-Burman for providing mouse prostatic stromal cells. The content is solely the responsibility of the authors and does not necessarily represent the official views of the National Cancer Institute or the National Institutes of Health.
Funding
We would like to express our deepest gratitude to our philanthropic supporters, Gladys and Melvin Rubin, whose generous support made this research possible. This work was partially supported by National Cancer Institute Cancer Center Shared Grant award P30CA014089.
Abbreviations
- Pten
phosphatase and tensin homolog
- CAF
cancer-associated fibroblast
- AR
androgen receptor
- ASO
antisense oligonucleotide
Footnotes
Disclosures: A. Robert MacLeod/Youngsoo Kim Employment, Stock Ownership, Patents/Intellectual Property with Ionis Pharmaceuticals
References
- The Molecular Taxonomy of Primary Prostate Cancer. Cell. 2015;163:1011–1025. doi: 10.1016/j.cell.2015.10.025. [DOI] [PMC free article] [PubMed] [Google Scholar]
- Baldridge MT, King KY, Boles NC, Weksberg DC, Goodell MA. Quiescent haematopoietic stem cells are activated by IFN-gamma in response to chronic infection. Nature. 2010;465:793–797. doi: 10.1038/nature09135. [DOI] [PMC free article] [PubMed] [Google Scholar]
- Bluemn EG, Nelson PS. The androgen/androgen receptor axis in prostate cancer. Curr Opin Oncol. 2012;24:251–257. doi: 10.1097/CCO.0b013e32835105b3. [DOI] [PMC free article] [PubMed] [Google Scholar]
- Borden EC, Sen GC, Uze G, Silverman RH, Ransohoff RM, Foster GR, Stark GR. Interferons at age 50: past, current and future impact on biomedicine. Nat Rev Drug Discov. 2007;6:975–990. doi: 10.1038/nrd2422. [DOI] [PMC free article] [PubMed] [Google Scholar]
- Brooke GN, Bevan CL. The role of androgen receptor mutations in prostate cancer progression. Curr Genomics. 2009;10:18–25. doi: 10.2174/138920209787581307. [DOI] [PMC free article] [PubMed] [Google Scholar]
- Cerami E, Gao J, Dogrusoz U, Gross BE, Sumer SO, Aksoy BA, Jacobsen A, Byrne CJ, Heuer ML, Larsson E, et al. The cBio cancer genomics portal: an open platform for exploring multidimensional cancer genomics data. Cancer Discov. 2012;2:401–404. doi: 10.1158/2159-8290.CD-12-0095. [DOI] [PMC free article] [PubMed] [Google Scholar]
- Chang H, Zeng F, Zhang JY, Mu XY, Meng WT, Ma HB, Liu T. Association of the interferon-gamma single nucleotide polymorphism +874(T/A) with response to immunosuppressive therapy in patients with severe aplastic anemia. Blood Cells Mol Dis. 2010;45:313–316. doi: 10.1016/j.bcmd.2010.09.003. [DOI] [PubMed] [Google Scholar]
- Clevers H. The cancer stem cell: premises, promises and challenges. Nat Med. 2011;17:313–319. doi: 10.1038/nm.2304. [DOI] [PubMed] [Google Scholar]
- Collins AT, Berry PA, Hyde C, Stower MJ, Maitland NJ. Prospective identification of tumorigenic prostate cancer stem cells. Cancer Res. 2005;65:10946–10951. doi: 10.1158/0008-5472.CAN-05-2018. [DOI] [PubMed] [Google Scholar]
- Cunha GR, Ricke W, Thomson A, Marker PC, Risbridger G, Hayward SW, Wang YZ, Donjacour AA, Kurita T. Hormonal, cellular, and molecular regulation of normal and neoplastic prostatic development. J Steroid Biochem Mol Biol. 2004;92:221–236. doi: 10.1016/j.jsbmb.2004.10.017. [DOI] [PubMed] [Google Scholar]
- de Bruin AM, Demirel O, Hooibrink B, Brandts CH, Nolte MA. Interferon-gamma impairs proliferation of hematopoietic stem cells in mice. Blood. 2013;121:3578–3585. doi: 10.1182/blood-2012-05-432906. [DOI] [PubMed] [Google Scholar]
- Dufour C, Capasso M, Svahn J, Marrone A, Haupt R, Bacigalupo A, Giordani L, Longoni D, Pillon M, Pistorio A, et al. Homozygosis for (12) CA repeats in the first intron of the human IFN-gamma gene is significantly associated with the risk of aplastic anaemia in Caucasian population. Br J Haematol. 2004;126:682–685. doi: 10.1111/j.1365-2141.2004.05102.x. [DOI] [PubMed] [Google Scholar]
- Eppert K, Takenaka K, Lechman ER, Waldron L, Nilsson B, van Galen P, Metzeler KH, Poeppl A, Ling V, Beyene J, et al. Stem cell gene expression programs influence clinical outcome in human leukemia. Nat Med. 2011;17:1086–1093. doi: 10.1038/nm.2415. [DOI] [PubMed] [Google Scholar]
- Epstein JI, Allsbrook WC, Jr, Amin MB, Egevad LL. Update on the Gleason grading system for prostate cancer: results of an international consensus conference of urologic pathologists. Adv Anat Pathol. 2006;13:57–59. doi: 10.1097/01.pap.0000202017.78917.18. [DOI] [PubMed] [Google Scholar]
- Frazier KS. Antisense oligonucleotide therapies: the promise and the challenges from a toxicologic pathologist’s perspective. Toxicol Pathol. 2015;43:78–89. doi: 10.1177/0192623314551840. [DOI] [PubMed] [Google Scholar]
- Gao J, Aksoy BA, Dogrusoz U, Dresdner G, Gross B, Sumer SO, Sun Y, Jacobsen A, Sinha R, Larsson E, et al. Integrative analysis of complex cancer genomics and clinical profiles using the cBioPortal. Sci Signal. 2013;6:pl1. doi: 10.1126/scisignal.2004088. [DOI] [PMC free article] [PubMed] [Google Scholar]
- Geary LA, Nash KA, Adisetiyo H, Liang M, Liao CP, Jeong JH, Zandi E, Roy-Burman P. CAF-secreted annexin A1 induces prostate cancer cells to gain stem cell-like features. Mol Cancer Res. 2014;12:607–621. doi: 10.1158/1541-7786.MCR-13-0469. [DOI] [PMC free article] [PubMed] [Google Scholar]
- Glinsky GV, Berezovska O, Glinskii AB. Microarray analysis identifies a death-from-cancer signature predicting therapy failure in patients with multiple types of cancer. J Clin Invest. 2005;115:1503–1521. doi: 10.1172/JCI23412. [DOI] [PMC free article] [PubMed] [Google Scholar]
- Goldstein AS, Huang J, Guo C, Garraway IP, Witte ON. Identification of a cell of origin for human prostate cancer. Science. 2010;329:568–571. doi: 10.1126/science.1189992. [DOI] [PMC free article] [PubMed] [Google Scholar]
- Heinlein CA, Chang C. Androgen receptor in prostate cancer. Endocr Rev. 2004;25:276–308. doi: 10.1210/er.2002-0032. [DOI] [PubMed] [Google Scholar]
- Henshall SM, Quinn DI, Lee CS, Head DR, Golovsky D, Brenner PC, Delprado W, Stricker PD, Grygiel JJ, Sutherland RL. Altered expression of androgen receptor in the malignant epithelium and adjacent stroma is associated with early relapse in prostate cancer. Cancer Res. 2001;61:423–427. [PubMed] [Google Scholar]
- Hong D, Kurzrock R, Kim Y, Woessner R, Younes A, Nemunaitis J, Fowler N, Zhou T, Schmidt J, Jo M, et al. AZD9150, a next-generation antisense oligonucleotide inhibitor of STAT3 with early evidence of clinical activity in lymphoma and lung cancer. Sci Transl Med. 2015;7:314ra185. doi: 10.1126/scitranslmed.aac5272. [DOI] [PMC free article] [PubMed] [Google Scholar]
- Hu QP, Kuang JY, Yang QK, Bian XW, SC Yu. Beyond a tumor suppressor: Soluble E-cadherin promotes the progression of cancer. Int J Cancer. 2015 doi: 10.1002/ijc.29982. [DOI] [PubMed] [Google Scholar]
- Huggins C, Hodges CV. Studies on prostatic cancer. I. The effect of castration, of estrogen and androgen injection on serum phosphatases in metastatic carcinoma of the prostate. CA Cancer J Clin. 1972;22:232–240. doi: 10.3322/canjclin.22.4.232. [DOI] [PubMed] [Google Scholar]
- Kurita T, Wang YZ, Donjacour AA, Zhao C, Lydon JP, O’Malley BW, Isaacs JT, Dahiya R, Cunha GR. Paracrine regulation of apoptosis by steroid hormones in the male and female reproductive system. Cell Death Differ. 2001;8:192–200. doi: 10.1038/sj.cdd.4400797. [DOI] [PubMed] [Google Scholar]
- Lai KP, Yamashita S, Huang CK, Yeh S, Chang C. Loss of stromal androgen receptor leads to suppressed prostate tumourigenesis via modulation of pro-inflammatory cytokines/chemokines. EMBO Mol Med. 2012;4:791–807. doi: 10.1002/emmm.201101140. [DOI] [PMC free article] [PubMed] [Google Scholar]
- Laoui D, Van Overmeire E, De Baetselier P, Van Ginderachter JA, Raes G. Functional Relationship between Tumor-Associated Macrophages and Macrophage Colony-Stimulating Factor as Contributors to Cancer Progression. Front Immunol. 2014;5:489. doi: 10.3389/fimmu.2014.00489. [DOI] [PMC free article] [PubMed] [Google Scholar]
- Lawson DA, Witte ON. Stem cells in prostate cancer initiation and progression. J Clin Invest. 2007;117:2044–2050. doi: 10.1172/JCI32810. [DOI] [PMC free article] [PubMed] [Google Scholar]
- Leach DA, Need EF, Toivanen R, Trotta AP, Palethorpe HM, Tamblyn DJ, Kopsaftis T, England GM, Smith E, Drew PA, et al. Stromal androgen receptor regulates the composition of the microenvironment to influence prostate cancer outcome. Oncotarget. 2015;6:16135–16150. doi: 10.18632/oncotarget.3873. [DOI] [PMC free article] [PubMed] [Google Scholar]
- Leong KG, Wang BE, Johnson L, Gao WQ. Generation of a prostate from a single adult stem cell. Nature. 2008;456:804–808. doi: 10.1038/nature07427. [DOI] [PubMed] [Google Scholar]
- Li Y, Li CX, Ye H, Chen F, Melamed J, Peng Y, Liu J, Wang Z, Tsou HC, Wei J, et al. Decrease in stromal androgen receptor associates with androgen-independent disease and promotes prostate cancer cell proliferation and invasion. J Cell Mol Med. 2008;12:2790–2798. doi: 10.1111/j.1582-4934.2008.00279.x. [DOI] [PMC free article] [PubMed] [Google Scholar]
- Liao CP, Adisetiyo H, Liang M, Roy-Burman P. Cancer-associated fibroblasts enhance the gland-forming capability of prostate cancer stem cells. Cancer Res. 2010a;70:7294–7303. doi: 10.1158/0008-5472.CAN-09-3982. [DOI] [PMC free article] [PubMed] [Google Scholar]
- Liao CP, Adisetiyo H, Liang M, Roy-Burman P. Cancer stem cells and microenvironment in prostate cancer progression. Horm Cancer. 2010b;1:297–305. doi: 10.1007/s12672-010-0051-5. [DOI] [PMC free article] [PubMed] [Google Scholar]
- Liao CP, Liang M, Cohen MB, Flesken-Nikitin A, Jeong JH, Nikitin AY, Roy-Burman P. Mouse prostate cancer cell lines established from primary and postcastration recurrent tumors. Horm Cancer. 2010c;1:44–54. doi: 10.1007/s12672-009-0005-y. [DOI] [PMC free article] [PubMed] [Google Scholar]
- Lin FC, Karwan M, Saleh B, Hodge DL, Chan T, Boelte KC, Keller JR, Young HA. IFN-gamma causes aplastic anemia by altering hematopoietic stem/progenitor cell composition and disrupting lineage differentiation. Blood. 2014;124:3699–3708. doi: 10.1182/blood-2014-01-549527. [DOI] [PMC free article] [PubMed] [Google Scholar]
- Markert EK, Mizuno H, Vazquez A, Levine AJ. Molecular classification of prostate cancer using curated expression signatures. Proc Natl Acad Sci U S A. 2011;108:21276–21281. doi: 10.1073/pnas.1117029108. [DOI] [PMC free article] [PubMed] [Google Scholar]
- Merlos-Suarez A, Barriga FM, Jung P, Iglesias M, Cespedes MV, Rossell D, Sevillano M, Hernando-Momblona X, da Silva-Diz V, Munoz P, et al. The intestinal stem cell signature identifies colorectal cancer stem cells and predicts disease relapse. Cell Stem Cell. 2011;8:511–524. doi: 10.1016/j.stem.2011.02.020. [DOI] [PubMed] [Google Scholar]
- Niu Y, Altuwaijri S, Yeh S, Lai KP, Yu S, Chuang KH, Huang SP, Lardy H, Chang C. Targeting the stromal androgen receptor in primary prostate tumors at earlier stages. Proc Natl Acad Sci U S A. 2008;105:12188–12193. doi: 10.1073/pnas.0804701105. [DOI] [PMC free article] [PubMed] [Google Scholar]
- Pfeiffer MJ, Schalken JA. Stem cell characteristics in prostate cancer cell lines. Eur Urol. 2010;57:246–254. doi: 10.1016/j.eururo.2009.01.015. [DOI] [PubMed] [Google Scholar]
- Prins GS, Putz O. Molecular signaling pathways that regulate prostate gland development. Differentiation. 2008;76:641–659. doi: 10.1111/j.1432-0436.2008.00277.x. [DOI] [PMC free article] [PubMed] [Google Scholar]
- Schroder K, Hertzog PJ, Ravasi T, Hume DA. Interferon-gamma: an overview of signals, mechanisms and functions. J Leukoc Biol. 2004;75:163–189. doi: 10.1189/jlb.0603252. [DOI] [PubMed] [Google Scholar]
- Serio B, Selleri C, Maciejewski JP. Impact of immunogenetic polymorphisms in bone marrow failure syndromes. Mini Rev Med Chem. 2011;11:544–552. doi: 10.2174/138955711795843356. [DOI] [PubMed] [Google Scholar]
- Smith BA, Sokolov A, Uzunangelov V, Baertsch R, Newton Y, Graim K, Mathis C, Cheng D, Stuart JM, Witte ON. A basal stem cell signature identifies aggressive prostate cancer phenotypes. Proc Natl Acad Sci U S A. 2015;112:E6544–6552. doi: 10.1073/pnas.1518007112. [DOI] [PMC free article] [PubMed] [Google Scholar]
- Stanley ER, Berg KL, Einstein DB, Lee PS, Pixley FJ, Wang Y, Yeung YG. Biology and action of colony–stimulating factor-1. Mol Reprod Dev. 1997;46:4–10. doi: 10.1002/(SICI)1098-2795(199701)46:1<4::AID-MRD2>3.0.CO;2-V. [DOI] [PubMed] [Google Scholar]
- Syed IS, Pedram A, Farhat WA. Role of Sonic Hedgehog (Shh) Signaling in Bladder Cancer Stemness and Tumorigenesis. Curr Urol Rep. 2016;17:11. doi: 10.1007/s11934-015-0568-9. [DOI] [PubMed] [Google Scholar]
- White AC, Lowry WE. Refining the role for adult stem cells as cancer cells of origin. Trends Cell Biol. 2015;25:11–20. doi: 10.1016/j.tcb.2014.08.008. [DOI] [PMC free article] [PubMed] [Google Scholar]
- Yamamoto Y, Loriot Y, Beraldi E, Zhang F, Wyatt AW, Nakouzi NA, Mo F, Zhou T, Kim Y, Monia BP, et al. Generation 2.5 antisense oligonucleotides targeting the androgen receptor and its splice variants suppress enzalutamide-resistant prostate cancer cell growth. Clin Cancer Res. 2015;21:1675–1687. doi: 10.1158/1078-0432.CCR-14-1108. [DOI] [PubMed] [Google Scholar]
- Yoshida H, Hayashi S, Kunisada T, Ogawa M, Nishikawa S, Okamura H, Sudo T, Shultz LD, Nishikawa S. The murine mutation osteopetrosis is in the coding region of the macrophage colony stimulating factor gene. Nature. 1990;345:442–444. doi: 10.1038/345442a0. [DOI] [PubMed] [Google Scholar]
- Yu S, Yeh CR, Niu Y, Chang HC, Tsai YC, Moses HL, Shyr CR, Chang C, Yeh S. Altered prostate epithelial development in mice lacking the androgen receptor in stromal fibroblasts. Prostate. 2012a;72:437–449. doi: 10.1002/pros.21445. [DOI] [PMC free article] [PubMed] [Google Scholar]
- Yu SQ, Yeh CR, Niu YJ, Chang HC, Tsai YC, Moses HL, Shyr CR, Chang CS, Yeh SY. Altered prostate epithelial development in mice lacking the androgen receptor in stromal fibroblasts. Prostate. 2012b;72:437–449. doi: 10.1002/pros.21445. [DOI] [PMC free article] [PubMed] [Google Scholar]
- Zaidi MR, Merlino G. The two faces of interferon-gamma in cancer. Clin Cancer Res. 2011;17:6118–6124. doi: 10.1158/1078-0432.CCR-11-0482. [DOI] [PMC free article] [PubMed] [Google Scholar]
Associated Data
This section collects any data citations, data availability statements, or supplementary materials included in this article.
Supplementary Materials
Supplemental Figure 1. IF staining on mouse NPF3234, CAF2270, CAF481, and CAF3234. A, SMA (red); B, Vimentin (green); C, N-Cad (red). Cell nuclei were colored by DAPI (blue). Bar: 10 μm.
Supplemental Figure 2. mRNA expression levels of mesenchymal and epithelial markers in mouse CAFs and NPFs. Relative expression of N-Cad (A), Vimentin (B), and CK18 (C) in NPF3395, CAF 2270, CAF3234, and CAF481by RT-PCR is presented (n=3). CE1 and E2 are mouse epithelial prostate cancer cells as previous described (Liao et al. 2010b) (*, p<0.05). Representative results are presented from ≥ 3 independent replicates.
Supplemental Figure 3. AR-depleted CAFs induced expressions of stemness genes in C4-2B. C4-2B cells were co-cultured with CAF3234 and ASOs (2.5 μM) after 7 days of treatment. mRNA expressions of OCT4, Sox2, and Nanog in C4-2B were examined by RT-qPCR (n=3). *, p<0.05. Representative results are presented from ≥ 3 independent replicates.
Supplemental Figure 4. M-CSF stimulates expression of “stemness” markers in PCa cells, which is attenuated by anti-M-CSF-R antibody. A, M-CSF expression in cytokine array incubated with media from CAFs treated with AR-ASO or Ctrl-ASO were quantified and compared (n=3). LNCaP (B), PC3 (C), and C4-2B (D) cells were treated with mM-CSF treatment for 24 hours at the doses indicated (n=3). E, LNCaP cells were treated with hM-CSF at the indicated doses for 24 hours (n=3). F, LNCaP cells incubated with mM-CSF and anti-MCSF-R antibody for 24 hours at the doses indicated (n=3). NT, non-treated (*, p<0.05). Representative results are presented from ≥ 3 independent replicates.
Supplemental Table 1. List of RT-PCR primer sets.


