

Abstract
Purpose
To evaluate the nature and extent of letter contrast sensitivity (CS) deficits in glaucoma patients using a commercially available computer-based system (MSSS-II) and to compare the letter CS measurements to standard clinical measures of visual function.
Methods
Ninety-four subjects with primary open-angle glaucoma participated. Each subject underwent visual acuity, letter CS, and standard automated perimetry (SAP) testing (Humphrey SITA 24-2). All subjects had a best-corrected visual acuity (BCVA) of 0.3 log MAR (20/40 Snellen equivalent) or better and reliable SAP (fixation losses, false positives, and false negatives < 33%). Contrast sensitivity functions (CSFs) were estimated from the letter CS and BCVA measurements. The area under the CSF (AUCSF), which is a combined index of CS and BCVA, was derived and analyzed.
Results
The mean (± SD) BCVA was 0.08 ± 0.10 log MAR (approximately 20/25 Snellen equivalent), the mean CS was 1.38 ± 0.17, and the mean HVF MD was −7.22 ± 8.10 dB. CS and HVF MD correlated significantly (r = 0.51, p < 0.001). BCVA correlated significantly with large letter CS (r = −0.22, p = 0.03), but not with HVF MD (r = −0.12, p = 0.26). A subset of the subject sample (approximately 20%) had moderate to no field loss (≤−6 dB MD) and minimal to no BCVA loss (≤0.3 log MAR), but had poor letter CS. AUCSF was correlated significantly with HVF MD (r = 0.46, p < 0.001).
Conclusions
The present study is the first to evaluate letter CS in glaucoma using the digital MSSS-II display. Letter CS correlated significantly with standard HVF MD measurements, suggesting that letter CS may provide a useful adjunct test of visual function for glaucoma patients. Additionally, the significant correlation between HVF MD and the combined index of CS and BCVA (AUCSF) suggests that this measure may also be useful for quantifying visual dysfunction in glaucoma patients.
Keywords: contrast sensitivity (CS), primary open angle glaucoma (POAG), area under contrast sensitivity function (AUCSF), M&S Smart System II (MSSS-II)
Introduction
Glaucoma is a leading cause of irreversible blindness. It is an insidious disease that damages retinal ganglion cells, which results in characteristic optic nerve and visual field changes. It is estimated that approximately 80 million individuals will be affected by glaucoma by 2020. Of those, approximately 11 million are expected to be bilaterally blind from glaucoma by 2020.1 Given the significant limitations that advanced disease places on individuals and their quality of life,2–6 early detection of glaucoma is critical so that timely interventions can be made. Although standard clinical techniques are routinely used to assess visual dysfunction in patients who have glaucoma, there is a need for more sensitive methods to quantify functional abnormalities. Currently, standard automated perimetry (SAP) is most commonly used in the clinic to assess visual function. There are, however, a number of limitations to SAP. For example, the test requires considerable cooperation from the subject, as constant attention and maintained fixation are needed throughout the relatively lengthy test. Lapses of attention and fixation instability contribute to high test-retest variability.
Contrast sensitivity (CS), which is the ability to detect small differences in luminance, is an essential component of visual function and it is correlated with overall quality of life,7–12 target identification in natural images, 13 driving, walking, and the ability to recognize faces.14 It has been suggested that functional complaints in some glaucoma patients who have relatively good visual acuity (VA) and minimal visual field deficits may be related to central visual field CS loss.15 Measurement of CS using letter targets is a promising, but underutilized, approach to assessing visual function in glaucoma. Previous reports have documented CS losses in glaucoma patients, even in individuals who have relatively good VA.16 Furthermore, our previous work has shown that letter CS and SAP visual field sensitivity are correlated,15 which may be expected since both tests assess CS. Thus, CS can be a useful measure for quantifying visual function in patients who have glaucoma.
Measurements of letter CS are most commonly performed with the Pelli-Robson letter CS chart.17 Although the Pelli-Robson chart has received considerable use by researchers, it has not been widely adopted for routine clinical use. There are a number of practical reasons for its limited use, such as the relatively large size of the chart, which makes it difficult to illuminate evenly by standard overhead lighting. Furthermore, the chart fades over time and it can be difficult to keep clean and free of defects. Recently, M&S Technologies, Inc. (Niles, IL) has introduced the M&S Smart System II (MSSS-II) that includes a computer-based letter CS test. This system has the potential to overcome some of the limitations of the Pelli-Robson chart, making it more attractive for regular clinical use. For example, the test is conducted in a dark room using a wall-mounted video display, which largely obviates room lighting limitations. Since the same display is used for VA and CS measurements, there is no need to change devices or relocate the subject during testing. Importantly, CS measurements with this system have shown good agreement with the Pelli-Robson chart.4
Thus, the purpose of the present study was to determine the relationships among letter CS, assessed by the MSSS-II, and routine measures of visual function including VA and SAP in patients who have glaucoma. If letter CS and SAP provide similar information regarding functional losses in glaucoma, then CS may be useful as a surrogate measure of visual function for glaucoma patients who cannot reliably perform SAP. Additionally, the contrast sensitivity function (CSF), which relates CS to letter size, was approximated from the letter CS and VA measurements and the area under the CSF (AUCSF) was derived and compared to SAP measurements. The AUCSF has been shown to be a useful one-number metric 18 that is jointly dependent on VA and large letter CS; however, to our knowledge, AUCSF has not been reported in patients who have glaucoma.
Methods
Participants
This prospective study included subjects with a diagnosis of primary open angle glaucoma (POAG) who presented to the Illinois Eye and Ear Infirmary Glaucoma Service. The eye with the highest Humphrey Visual Field mean deviation (MD) score was selected for testing (the ‘better-seeing’ eye). POAG was defined by the presence of optic nerve damage and/or visual field loss without secondary causes. All subjects were noted to have open angles on gonioscopy. Each subject voluntarily provided informed written consent and the study was approved by an Institutional Review Board at the University of Illinois at Chicago.
All subjects were ≥ 18 years of age and had the ability to understand the procedures and a willingness to comply with the study. Inclusion criteria included: 1) best corrected visual acuity of 0.3 log MAR or better (equivalent to 20/40 or better Snellen); 2) pupils larger than 4 mm; 3) a well-controlled IOP; 4) no recent ophthalmic surgery within 6 months; and 5) a reliable SAP test (Humphrey 24-2) within the past 6 months (fixation losses, false positives, and false negatives < 33%). The lens of each subject was graded by slit lamp examination using a subjective clinical scale that ranged from clear to 4+. Subjects with nuclear sclerotic, posterior subcapsular, or cortical lens opacities greater than 1+, which corresponds to minimal cataract, were excluded. Additionally, no subject had diabetic retinopathy, age-related macular degeneration, optic nerve disease other than glaucoma, evidence of infection, inflammation, or other ocular or systemic conditions known to affect visual function.
Testing procedures and analysis
Each patient underwent best-corrected visual acuity (BCVA) and CS testing on the same day using the MSSS-II in accordance with the instructions provided by the manufacturer. VA was measured by presenting a single letter from the Sloan set and decreasing the letter size according to the log MAR scale (0.1 log unit steps). For CS measurements, the letter size was set to 20/600, which is equivalent to the size of the letters on the Pelli-Robson chart. A single letter from the Sloan set was selected at random, presented, and the subject was asked to verbally identify the letter. The first letter presented was at the highest contrast produced by the display (100%) and the contrast was decreased following each correct response (approximately 0.1 log unit steps) until the subject could no longer correctly identify the letter presented. If a subject answered incorrectly, the contrast was increased by 0.3 log units to confirm a correct answer and then the subject was tested again by reducing the contrast in approximately 0.1 log unit steps until the subject answered incorrectly a second time. The contrast value for the last correct response was recorded as contrast threshold.
The luminance of the MSSS-II system was calibrated using a Minolta LS-110 luminance meter (Konica Minolta). The display luminance was set to 85 cd/m2 and the luminance of the letter targets was measured. Contrast was defined as Weber contrast:
| (1) |
where Lletter is the luminance of the letter and Lbackground is the luminance of the background. CS was defined as the log of 1/letter contrast threshold. For the particular display used in the present study, the gamma value was set to 1.4 through the software interface, which provided a good correspondence between the nominal contrast reported by the MSSS-II and the contrast derived from the luminance measurements.
Visual field perimetry was performed using the Humphrey visual field (HVF) analyzer SITA 24-2 standard algorithm (Humphrey Instruments Inc., CA, USA). The present analysis utilized the mean deviation (MD) value to group the subjects according to the severity of the field loss: mild (MD ≥ −6 dB) and advanced (MD < −6 dB).19 The eye with the better HVF MD score was selected for further CS testing. Subjects were also subdivided into smaller groups for analysis based on their HVF MD scores: 1 to −3, −3 to −6, −6 to −12 and −12 to −32 dB (nominally: no, mild, moderate, and severe field loss, respectively).
The CSF was approximated based on the large letter CS value and the BCVA value obtained with the MSSS-II. To accomplish this, a model of the CSF obtained from previous research was used.20 This model assumes that the CSF measured with letter stimuli has the same low-pass shape for all subjects. Specifically, the model predicts that CS is related to letter size by the following function:
| (2) |
where CS is the contrast sensitivity at letter size f (1/MAR), n governs the CS attenuation low spatial frequencies, and A and p are vertical and horizontal scaling parameters. In the present study, A and p were free parameters and n was set to 0.1, based on previous findings.20 This CSF model was shifted vertically and horizontally on log-log coordinates (adjusting parameters A and p) to minimize the mean-squared error between the model CSF and the measured data points (large letter CS and BCVA). The area under this curve (AUCSF) was then derived, as described elsewhere.18 The AUCSF is a useful single-number metric that is jointly dependent on the subject’s large letter CS and BCVA.
Results
The analysis included 94 eyes of 94 subjects with a diagnosis of primary open angle glaucoma (POAG). The mean age of the subjects was 65 years (range: 38–88 years). 51 subjects (54.3%) were African American, 18 (19.1%) were Caucasian, 12 (12.8%) were Hispanic and 13 (13.8%) were classified as “other” (the majority of whom were Asian). Fifty-nine subjects (63%) were classified as having mild glaucoma (HVF MD loss less than 6 dB) and 35 (37%) had advanced glaucoma (HVF MD loss greater than 6 dB).
Given the inclusion criteria, all subjects in our sample had BCVA of 0.3 log MAR (20/40 Snellen equivalent) or better. The mean (± SD) BCVA for the subject sample was 0.08 ± 0.10 log MAR (approximate Snellen equivalent of 20/25), the mean CS was 1.38 ± 0.17, and the mean HVF MD was −7.22 ± 8.10 dB. BCVA and large letter CS were correlated significantly (r = −0.22, p = 0.03), but BCVA was not correlated significantly with HVF MD (r = −0.12, p = 0.26).
Fig. 1A shows the HVF MD value as a function of log letter CS for each subject. The black triangles represent subjects with MD values better than −6 dB and the red squares represent subjects with MD values worse than −6 dB; solid lines are linear regression fits to the data. The gray region represents the expected range of normal, based on previous findings.4 Fig. 1A shows that the range of letter CS spanned a factor of approximately 10 (log CS values of 0.8 to 1.8), whereas the range of HVF MD was much larger, spanning a factor of more than 1,000 (1 to −32 dB). These two measures were correlated significantly when compared for all subjects (r = 0.51, p < 0.001) and also when sub-divided into subjects with HVF MD ≥ −6 dB (r = 0.32, p = 0.01) and HVF MD < −6 dB (r = 0.41, p = 0.01).
Figure 1.
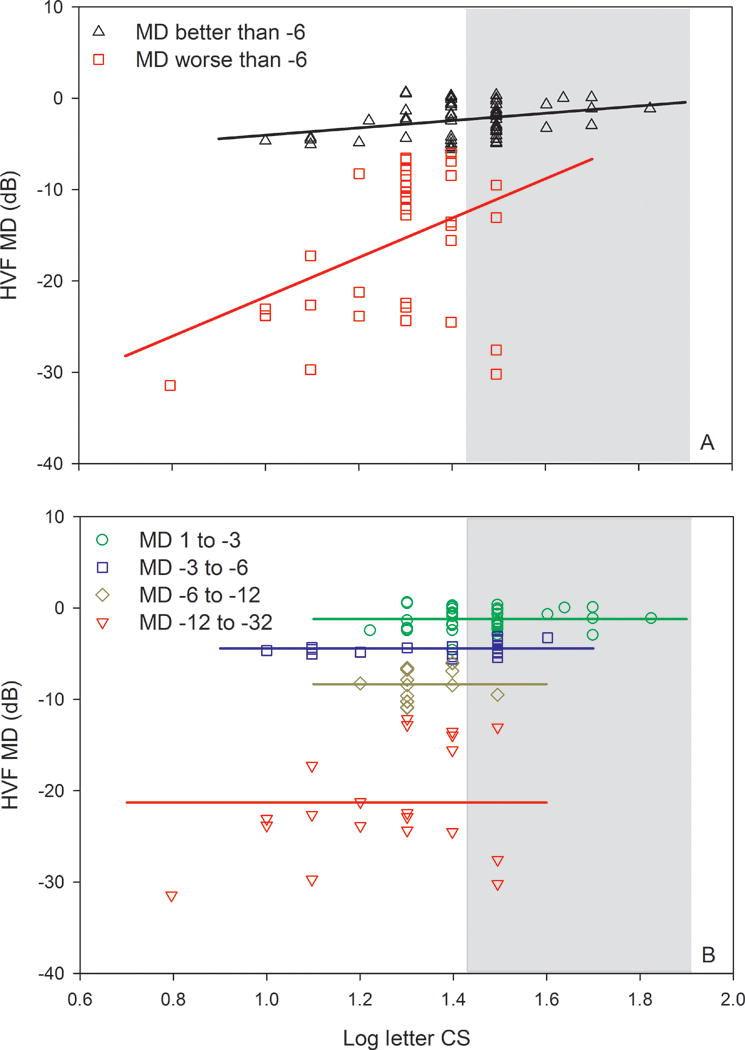
HVF MD as a function of log letter CS. Data are shown for subjects who have a HVF MD loss less than 6 dB (triangles) and for subjects who have a HVF MD loss greater than 6 dB (squares) in panel A. The lines represent linear regression fits to the data as described in the text. Panel B replots the data in A for subjects separated into four groups. The lines in B represent linear regression fits to the data with slopes constrained to zero, as described in the text. The gray region in both panels represents the normal range based on previous data.
As an additional approach to examine the relationship between HVF MD and large letter CS, the subjects were further subdivided based on MD values into four groups that had progressively greater field loss. Figure 1B shows the relationship between HVF MD and log letter CS for these four groups. Linear regression analysis was performed for each group, but the slopes were not significantly different from zero. Consequently, regression lines with a slope constrained to zero were fit to each data set (horizontal solid lines). The results indicate that there were no significant correlations between HVF MD and large letter CS within these subgroups. Green circles within the white area (to the left of the gray normal range) represent subjects who had relatively good VA (0.3 log MAR or better), minimal to no field loss (less than 3 dB), but had low letter CS.
CSFs estimated from the large letter CS and VA measurements are shown in Fig. 2. In this figure, log CS is plotted as a function of log letter size, with letter size decreasing from left to right. The black triangles (Fig. 2A) represent the mean CSF for subjects with MD loss less than 6 dB, whereas the red squares represent the mean CSF for subjects with MD loss greater than 6 dB. The functions fit to the data represent the model template for the letter CSF (equation 2).20 These mean CSFs show that the two groups had different large letter CS values (left data points), despite similar VA values (right data points). Fig. 2B shows the CSFs for the subjects subdivided into four groups, based on HVF MD, as discussed above. Consistent with the pattern shown in Fig. 2A, the large letter CS decreased systematically as the HVF MD value decreased (greater field loss), whereas the VA values showed greater similarity among the four groups.
Figure 2.
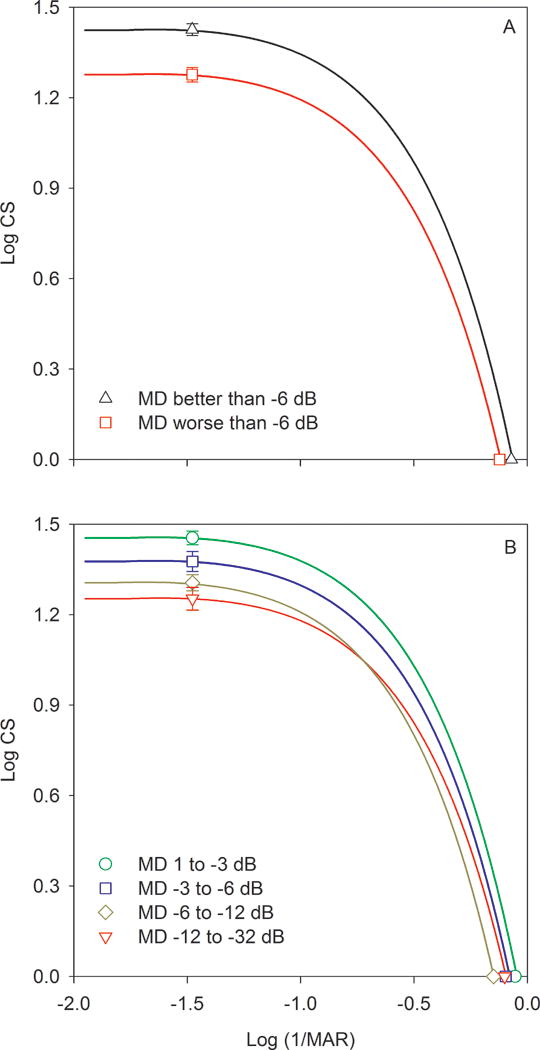
Estimated CSFs are shown for subjects who have a HVF MD loss less than 6 dB (triangles) and for subjects who have a HVF MD loss greater than 6 dB (squares) in panel A. The CSFs were derived from a previous model, as described in the text. Panel B shows the CSFs for subjects divided into four groups based on their HVF MD values.
Based on each subject’s CSF, the AUCSF was derived. Fig. 3A shows the HVF MD value as a function of the AUCSF. Overall, the AUCSF was correlated significantly with HVF MD (r = 0.46, p < 0.001). The subjects were grouped into those who had MD loss less than 6 dB (black triangles) and those who had MD loss greater than 6 dB (red squares). The AUCSF was found to be correlated significantly with HVF MD for subjects who had less than a 6 dB MD loss (r = 0.38, p < 0.01), but not for subjects who had more than a 6 dB HVF MD loss (r = 0.23, p = 0.18). As in the previous plots, the subjects were further subdivided into four groups based on their HVF MD values, which were plotted as a function of AUCSF in Fig. 3B. Linear regression analysis was performed for each group and the slopes were not significantly different from zero. Consequently, regression lines with a slope constrained to zero were fit to each data set (horizontal solid lines). The results indicate that there were no significant correlations between HVF MD and AUCSF within these subgroups.
Figure 3.
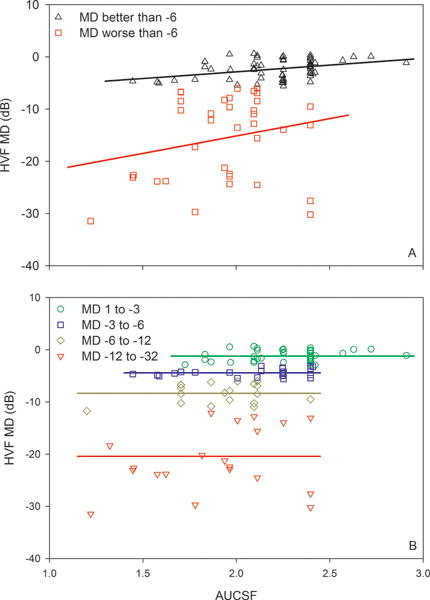
HVF MD as a function of AUCSF. Conventions are as in Fig. 1.
Discussion
This study quantified the relationships among letter CS, assessed by the MSSS-II, and routine measures of visual function including VA and SAP in subjects with glaucoma. Although previous work has examined CS in glaucoma patients using a variety of tests,15, 21–23 the present report is the first to evaluate CS using the digital MSSS-II display that has recently become commercially available. We show that the large letter CS measurements assessed with the MSSS-II are correlated significantly with standard HVF MD measurements, suggesting that large letter CS may be a useful adjunct test of visual function in glaucoma patients. Additionally, a combined index of the VA and letter CS measurements (AUCSF) was derived and shown to correlate with HVF MD.
The MSSS-II has advantages over standard chart-based CS tests. For example, the display is self-luminous, which obviates the dependence on room illumination. The MSSS-II also permits VA and CS to be assessed with the same device at a constant test distance, which reduces test time and increases the ease of use. We note, however, that calibration is an important consideration in the use of the MSSS-II. Although the display is calibrated by the manufacturer for test distance to ensure accurate VA measurements, luminance calibration to ensure accurate CS measurements is not as easily achieved. Specifically, adjustment of the display’s gamma function and measurement of letter and screen luminance with a photometer was required to ensure that the nominal contrast values reported by the display were accurate. Furthermore, informal testing with different MSSS-II displays indicated that the gamma adjustment required to best match the nominal and measured contrast values may vary among displays. Nevertheless, when properly calibrated, we found the MSSS-II to be a useful, easily implemented test of letter CS.
Routine CS measurement may be of value in assessing visual function in glaucoma patients, given the finding of low CS in patients who otherwise had minimal or no field loss (less than 3 dB) and relatively good VA (0.3 log MAR or better). Although glaucoma has traditionally been thought to affect peripheral visual function in its early stages, there is evidence of altered foveal/parafoveal function as well.15, 23, 24 Reduced central field CS may, at least in part, account for some of the subjective complaints of glaucoma patients who have minimal field loss and relatively good VA. This speculation is consistent with the finding that CS is better related to ‘real-world’ function than VA in patients with early stages of the glaucoma.25 Large letter CS measurements may also be of value in cases where reliable HVF measures cannot be obtained. HVF measurement is heavily dependent on patient alertness and cooperation. Large letter CS testing, like visual field perimetry, is a subjective test of visual function, but letter CS tests can be completed quickly and may be more patient-friendly than visual field perimetry.
Despite the relative ease of letter CS testing and its significant correlation with HVF MD, letter CS testing may not be an ideal approach for early detection of glaucoma. That is, patients who had good letter CS had HVF MD values that ranged from 0 to −30 dB. Conversely, patients who had low letter CS could have normal (or nearly normal) HVF MD values. This suggests that the sensitivity and specificity of letter CS for detecting early glaucoma would be relatively poor, consistent with the findings of Wood and Lovie-Kitchin.26 Nevertheless, letter CS measurements may be useful for: 1) patients who have subjective complaints of poor vision and minimal to no VA or HVF MD loss; 2) patients who cannot reliably perform SAP, as there is a significant correlation between HVF MD and letter CS, despite the variation.
One important limitation of standard letter CS testing is an inability to provide information about sensitivity losses localized to the peripheral visual field, as letter CS is typically a functional test of the central macula. Similarly, the use of HVF MD may not be an ideal metric for quantifying glaucomatous field loss, as this measure can also ignore localized defects. The good correspondence between CS and ‘real-world’ function,25 noted above, suggests that there is value in CS measurement in glaucoma patients. A second limitation to consider is that both letter CS and SAP can be affected by factors such as media opacity, pupil size, and age. To avoid possible effects of media opacity, subjects who had significant cataracts were excluded from the present study. Furthermore, a sub-analysis showed no significant differences in letter CS (F = 2.46, p = 0.07) or HVF MD (F = 1.47, p = 0.23) among patients who had different levels of lens opacity (pseudophakic, clear, trace, 1+). The effects of pupil size on letter CS are also likely to be negligible in our sample, as there was no significant correlation between log letter CS and pupil diameter (r = 0.09, p = 0.40) or HVF MD and pupil diameter (r = 0.20, p = 0.06). Similarly, age was not significantly correlated with letter CS (r = −0.18, p = 0.07) or HVF MD (r = −0.03, p = 0.75) in this sample of subjects.
The MSSS-II provides measures of VA in addition large letter CS, which permits the CSF, and the AUCSF, to be estimated. In the present study, the AUCSF was found to be correlated with HVF MD for subjects who had moderate to no field loss (less than 6 dB loss). VA and large letter CS were also significantly correlated with HVF MD for these subjects, so the finding that AUCSF is correlated with HVF MD is expected, as AUCSF is jointly dependent on VA and large letter CS. Conversely, for subjects with marked visual field loss (HVF MD reduction of more than 6 dB), AUCSF was not correlated with HVF MD. VA was also not correlated with HVF MD for these subjects, which likely attributed to the non-significant relationship between HVF MD and AUCSF. The glaucoma subjects in our sample all had VA better than 0.3 log MAR, which limited the possible amount of variation in VA among the subjects. It would be of interest to evaluate the relationship between AUCSF and HVF MD in glaucoma patients who have larger VA losses. It would also be of interest to derive the complete CSF using the MSSS-II in patients who have glaucoma and varying disease stages. The AUCSF derived in the present study is dependent on the assumption that the shape of the CSF is similar for all patients. Although this likely to be a reasonable assumption, the method to derive the AUCSF in the present study would not be sensitive to selective deficits (‘notches’) at specific letter sizes. Future work is needed to completely define the shape of the letter CSF in patients who have different stages of glaucoma.
Conclusion
CS testing using the MSSS-II can be performed quickly, is less demanding than visual field perimetry, and can be easily incorporated into a busy clinical practice. Furthermore, for glaucomatous eyes with visual acuity of 20/40 or better, large letter CS assessed with the MSSS-II correlated significantly with visual field loss. As such, letter CS testing may provide a useful supplementary measure of visual function, particularly for patients from whom reliable visual field measurements cannot be obtained. Future work is needed to determine the extent to which large letter CS and the AUCSF are useful for early detection of glaucoma and for quantifying the progression of functional losses.
Acknowledgments
This research was supported by:
NIH grants K23EY022949 (TSV) and EY001792 (UIC Department of Ophthalmology) Komarek-Hyde-McQueen Glaucoma Research Fund
A Dolly Green Special Scholar Award (JJM) and an unrestricted departmental award from Research to Prevent Blindness
Footnotes
ADDRESS FOR REPRINTS:
Illinois Eye and Ear Infirmary, 1855 W Taylor St, Chicago, IL 60612
References
- 1.Quigley HA, Broman AT. The number of people with glaucoma worldwide in 2010 and 2020. Br J Ophthalmol. 2006;90:262–7. doi: 10.1136/bjo.2005.081224. [DOI] [PMC free article] [PubMed] [Google Scholar]
- 2.Gutierrez P, Wilson MR, Johnson C, Gordon M, Cioffi GA, et al. Influence of glaucomatous visual field loss on health-related quality of life. Arch Ophthalmol. 1997;115:777–784. doi: 10.1001/archopht.1997.01100150779014. [DOI] [PubMed] [Google Scholar]
- 3.Parrish RK, 2nd, Gedde SJ, Scott IU, Feuer WJ, Schiffman JC, et al. Visual function and quality of life among patients with glaucoma. Arch Ophthalmol. 1997;115:1447–1455. doi: 10.1001/archopht.1997.01100160617016. [DOI] [PubMed] [Google Scholar]
- 4.Chandrakumar M, Colpa L, Reginald Y, Goltz H, Wong A. Measuring Contrast Sensitivity using the M&S Smart System II versus the Pelli-Robson Chart. Ophthalmology. 2013;10:2160–1. doi: 10.1016/j.ophtha.2013.07.022. [DOI] [PubMed] [Google Scholar]
- 5.Viswanathan AC, McNaught AI, Poinoosawmy D, et al. Severity and stability of glaucoma: patient perception compared with objective measurement. Arch Ophthalmol. 1999;117(4):450–4. doi: 10.1001/archopht.117.4.450. [DOI] [PubMed] [Google Scholar]
- 6.Odberg T, Jakobsen JE, Hultgren SJ, Halseide R. The impact of glaucoma on the quality of life of patients in Norway, II: patient response correlated to objective data. Acta Ophthalmol Scand. 2001;79(2):121–4. doi: 10.1034/j.1600-0420.2001.079002121.x. [DOI] [PubMed] [Google Scholar]
- 7.Owsley C. Contrast sensitivity. Ophthalmol Clin North Am. 2003;16:171–177. doi: 10.1016/s0896-1549(03)00003-8. [DOI] [PubMed] [Google Scholar]
- 8.Mills RP, Janz NK, Wren PA, Guire KE. Correlation of visual field with quality-of-life measures at diagnosis in the Collaborative Initial Glaucoma Treatment Study (CIGTS) J Glaucoma. 2001;10:192–8. doi: 10.1097/00061198-200106000-00008. [DOI] [PubMed] [Google Scholar]
- 9.Nelson P, Aspinall P, Papasouliotis O, Worton B, O’Brien C. Quality of life in glaucoma and its relationship with visual function. J Glaucoma. 2003;12(2):139–150. doi: 10.1097/00061198-200304000-00009. [DOI] [PubMed] [Google Scholar]
- 10.Ross JE, Bron AJ, Clarke DD. Contrast sensitivity and visual disability in chronic simple glaucoma. Br J Ophthalmol. 1984;68(11):821–7. doi: 10.1136/bjo.68.11.821. [DOI] [PMC free article] [PubMed] [Google Scholar]
- 11.Jampel HD, Schwartz A, Pollack I, Abrams D, Weiss H, Miller R. Glaucoma patients’ assessment of their visual function and quality of life. J Glaucoma. 2002;11(2):154–163. doi: 10.1097/00061198-200204000-00012. [DOI] [PubMed] [Google Scholar]
- 12.Richman J, Lorenzana LL, Lankaranian D, et al. Relationships in glaucoma patients between standard vision tests, quality of life, and ability to perform daily activities. Ophthalmic Epidemiol. 2010;17(3):144–151. doi: 10.3109/09286581003734878. [DOI] [PubMed] [Google Scholar]
- 13.Owsley C, Sloane ME. Contrast sensitivity, acuity, and the perception of “real-world” targets. Br J Ophthalmol. 1987;71:791–796. doi: 10.1136/bjo.71.10.791. [DOI] [PMC free article] [PubMed] [Google Scholar]
- 14.Rubin GS, Ng ESW, Bandeen-Roche K, Keyl PM, Freeman EE, West SK. A prospective, population-based study of the role of visual impairment in motor vehicle crashes among older drivers: the SEE study. Invest Ophthalmol Vis Sci. 2007;48:1483–1491. doi: 10.1167/iovs.06-0474. [DOI] [PubMed] [Google Scholar]
- 15.Hawkins Wilensky J. A Comparison of Contrast Sensitivity, Visual Acuity, and Humphrey Visual Field testing patients with glaucoma. J Glaucoma. 2003 Apr;12(2):134–8. [PubMed] [Google Scholar]
- 16.Richman J, Lorenzana LL, Lankaranian D, Dugar J, Mayer J, et al. Importance of visual acuity and contrast sensitivity in patients with glaucoma. Arch Ophthalmol. 2010;128:1576–1582. doi: 10.1001/archophthalmol.2010.275. [DOI] [PubMed] [Google Scholar]
- 17.Pelli DG, Robson JG, Wilkins AJ. The design of a new letter chart for measuring contrast sensitivity. 1988;2(3):187–199. [Google Scholar]
- 18.Applegate RA, Hilmantel G, Howland HC. (Technical Digest Series).Area under log contrast sensitivity function: A concise method of following changes in visual performance. Vision Science and Its Applications. 1997;1:98–101. [Google Scholar]
- 19.Hodapp E, Richard K, Parrish II, Anderson DR. Clinical Decisions in Glaucoma. St Louis, MO: Mosby; 1993. [Google Scholar]
- 20.McAnany JJ, Alexander KR. Contrast sensitivity for letter optotypes vs. gratings under conditions biased toward parvocellular and magnocellular pathways. Vision Res. 2006;46:1574–1584. doi: 10.1016/j.visres.2005.08.019. [DOI] [PubMed] [Google Scholar]
- 21.Arden GB, Jacobson JJ. A simple grating test for contrast sensitivity: preliminary results indicate value in screening for glaucoma. Invest Ophthalmol Visual Sci. 1978;17:23–32. [PubMed] [Google Scholar]
- 22.Pomerance GN, Evans DW. Test-retest reliability of the CSV-1000 contrast test and its relationship to glaucoma therapy. Invest Ophthalmol Vis Sci. 1994 Aug;35(9):3357–61. [PubMed] [Google Scholar]
- 23.Lahav K, Levkovitch-Verbin H, Belkin M, Glovinsky Y, Polat U. Reduced mesopic and photopic foveal contrast sensitivity in glaucoma. Arch Ophthalmol. 2011 Jan;129(1):16–22. doi: 10.1001/archophthalmol.2010.332. [DOI] [PubMed] [Google Scholar]
- 24.Marx MS, Bodis-Wollner I, Lustgarten JS, Podos SM. Electrophysiological evidence that early glaucoma affects foveal vision. Doc Ophthalmol. 1987 Nov;67(3):281–301. doi: 10.1007/BF00144282. [DOI] [PubMed] [Google Scholar]
- 25.Szlyk JP, Taglia DP, Paliga J, Edward DP, Wilensky JT. Driving performance in patients with mild to moderate glaucomatous clinical vision changes. J Rehabil Res Dev. 2002;39:467–482. [PubMed] [Google Scholar]
- 26.Wood Joanne M, Lovie-Kitchin Jan E. Contrast sensitivity measurement in the detection of primary open angle glaucoma; Perimetry Update 1990/1991 Proceedings of the IXth International Perimetric Society Meeting; June 1990; Malmo, Sweden. 1991. [Google Scholar]