Abstract
Goal
Quantitative assessment of hepatic insulin extraction (HE) after an oral glucose challenge, e.g. a meal, is important to understand the regulation of carbohydrate metabolism. The aim of the current study is to develop a model of system for estimating HE.
Methods
Seven different models, of increasing complexity, were tested on data of 204 normal subjects, who underwent a mixed meal tolerance test, with frequent measurement of plasma glucose, insulin and C-peptide concentrations. All these models included a two-compartment model of C-peptide kinetics, an insulin secretion model, a compartmental model of insulin kinetics (with model order ranging from one to three) and different HE descriptions, depending on plasma glucose and insulin. Model performances were compared on the basis of data fit, precision of parameter estimates and parsimony criteria.
Results
The three-compartment model of insulin kinetics, coupled with HE depending on glucose concentration, showed the best fit and a good ability to precisely estimate the parameters. In addition, the model calculates basal and total indices of HE (HEb and HEtot, respectively), and provides an index of HE sensitivity to glucose (SGHE).
Conclusion
A new physiologically-based HE model has been developed, which allows an improved quantitative description of glucose regulation. Significance: The use of the new model provides a in-depth description of insulin kinetics, thus enabling a better portrait of patient metabolic state.
Index Terms: insulin clearance, insulin kinetics, insulin secretion
I. Introduction
Peripheral insulin concentrations reflect the net effect of insulin secretion and hepatic extraction of portal insulin [1]. While C-peptide and insulin are secreted into the portal vein in equimolar concentrations, fasting insulin and C-peptide concentrations do not preserve equimolarity since the liver extracts insulin but not C-peptide. Estimating hepatic extraction of insulin (HE) becomes more complex in physiological situations, such as after meal ingestion, since in these circumstances insulin and C-peptide concentrations vary with a time course reflecting both the differences in their kinetics as well as HE [2, 3].
Prior studies have suggested that HE removes about 50% of insulin appearing in the portal circulation. This process appears to be dynamic and is affected by the amplitude of portal insulin pulses [4], circulating free fatty acids [5], and hyperglycemia [6]. Therefore, measuring HE in dynamic situations is important, but a direct measurement is invasive, requiring the insertion of catheters into the portal and hepatic veins, respectively. Estimation of HE using mathematical models is a reasonable alternative.
Models utilize the fact that C-peptide and insulin are secreted in equimolar concentrations from the beta-cells and that the liver extracts insulin, but not C-peptide. The first model formulated to assess HE was that proposed by Toffolo et al. [7] which uses plasma glucose, insulin and C-peptide measured during an insulin-modified intravenous glucose tolerance test (IM-IVGTT). The model estimates the insulin secretion rate (ISR) and the insulin delivery rate (IDR) from C-peptide and insulin concentrations, respectively. Using these two variables it is possible to obtain an estimate of the HE profile, as (ISR-IDR)/ISR. Of note, in this case, the functional description adopted for IDR is similar to that used for describing ISR, i.e. that IDR is made up of two components: the first phase proportional to the rapid rise in glucose concentration, and the second phase proportional to delayed rise in plasma glucose concentration. In addition, since the concurrent estimation of secretion and kinetics during a single experiment in a given individual is difficult [8], the C-peptide kinetic parameters are usually fixed to standard population values obtained from individual anthropometric characteristics [9]. Conversely, insulin kinetics parameters can be estimated from an IM-IVGTT, since the short insulin infusion administered 20–25 minutes after the glucose bolus allows the individual assessment of insulin kinetics.
Campioni et al. [3] directly described HE during a standard mixed meal as a piecewise linear function. In this model, insulin kinetics is fixed to a population model derived from data of 204 healthy subjects who underwent an IM-IVGTT [10]. The main limitation of this method arises from how HE is described: a piecewise linear function with a given number of breakpoints, i.e. a model of data, which does not explore the mechanistic relationship between involved variables and does not provide physiologically based parameters. Moreover, this expression makes the model vulnerable to noise, since the HE profile may rapidly vary to fit fluctuations in peripheral insulin concentrations.
The aim of this study was to propose a new physiological model of insulin kinetics, i.e. a model of system, which is selected among seven models with different number of compartments and different mechanistic descriptions on how HE depends on plasma glucose and insulin concentrations. These models are tested against data of a frequently sampled 21 plasma samples mixed meal, in 204 healthy subjects [10]. Using these models it is possible to obtain also an index of HE sensitivity, in addition to total and basal indices of HE. After selecting the most parsimonious model, we tested its ability to describe the data during a standard 11 samples meal tolerance test (MTT) [11].
II. Methods
A. Subjects and Experimental Protocol
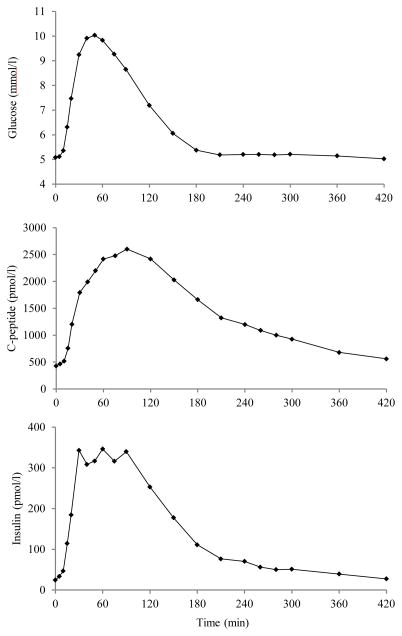
We used data from a previous study [10] in which 204 nondiabetic subjects [117 males and 87 females, age 55.5 ± 1.5 yr (means ± SE), body mass index (BMI) 26.6 ± 0.2 kg/m2, body surface area (BSA) 1.90 ± 0.01 m2] underwent a mixed meal (10 kcal/kg body wt, 45% carbohydrate, 15% protein, 40% fat) consumed over a 15 min period. Blood was frequently sampled (FS-MTT) at −120, −30, −20, −10, 0, 5, 10, 15, 20, 30, 40, 50, 60, 75, 90, 120, 150, 180, 210, 240, 260, 280, 300, 360, and 420 min for measuring glucose, C-peptide, and insulin concentrations; time 0 is the moment in which the meal started. Average glucose, insulin and C-peptide concentrations are shown in Fig. 1. With the aim of testing the model performance in case of standard sampling (SS-MTT) [11], we also identified the model only using samples of 0, 10, 20, 30, 60, 90, 120, 150, 180, 240, 300 min.
Fig. 1.
Average plasma glucose (top), C-peptide (middle), and insulin (bottom) concentrations.
B. C-peptide Kinetics Model
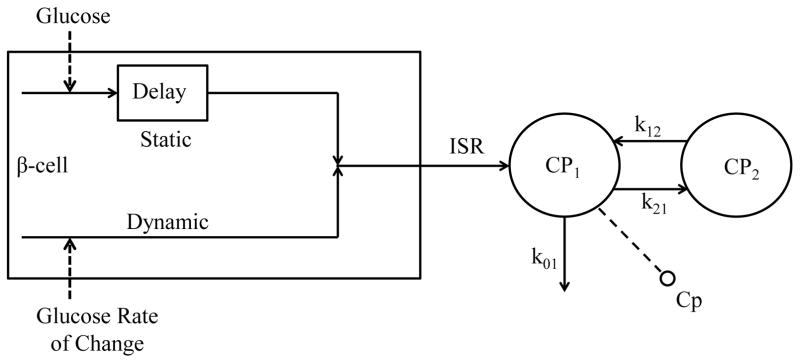
A two-compartment model is used to describe C-peptide kinetics, as initially proposed by Eaton et al. [12] (Fig. 2):
| (1) |
| (2) |
where CP1 and CP2 (pmol/l) are C-peptide concentrations in the accessible and in the peripheral compartment, CPb (pmol/l) is the basal plasma C-peptide concentration, ISR (pmol/min) is the beta-cell insulin (and C-peptide) secretion rate, Vc (l) is the C-peptide distribution volume, k21, k12, k01 (min−1) are transfer rate parameters, fixed to standard population values, by using Van Cauter et al. formulas [9].
Fig. 2.
C-peptide secretion and kinetics model. Cp1 and Cp2 (pmol/l), C-peptide concentrations in the accessible and in the peripheral compartment; Cp (pmol/l), C-peptide measurement in the accessible compartment; k01, k21, and k12 (min−1) transfer rate parameters; ISR (pmol/min), insulin secretion rate.
C. C-peptide Secretion Model
The model of C-peptide secretion [11] describes the three components of pancreatic secretion: basal (ISRb), static (ISRs), proportional to delayed glucose concentration, and dynamic (ISRd), proportional to glucose rate of increase (Fig. 2):
| (3) |
ISRb can be obtained from steady state constraint of Eq. 1:
| (4) |
ISRs represents the provision of releasable insulin controlled by glucose concentration G (mmol/l) in a linear dynamic fashion: in other words, if plasma glucose shows a step increase above a threshold level h (mmol/l), the provision tends toward a steady-state value that is linearly dependent to the glucose step through a parameter Φs (10−9 min−1):
| (5) |
ISRd is the secretion of insulin from the promptly releasable pool, and it is proportional to the rate of increase of glucose Ġ (mmol/l · min−1) through parameter Φd (10−9):
| (6) |
D. Insulin Kinetics and Hepatic Extraction Models
Hepatic extraction during a meal tolerance test has been described by Campioni et al. as a piecewise linear function [3]. This model allows the reconstruction of HE profile from plasma C-peptide, insulin and glucose concentrations and provides an index of total hepatic extraction, without assuming any mechanistic description of the phenomena controlling HE. Hepatic insulin extraction decreases when glucose and insulin concentrations rise (see Fig. 4 in [3]). Therefore, it is reasonable to assume an inverse relation between HE and plasma glucose and insulin concentration.
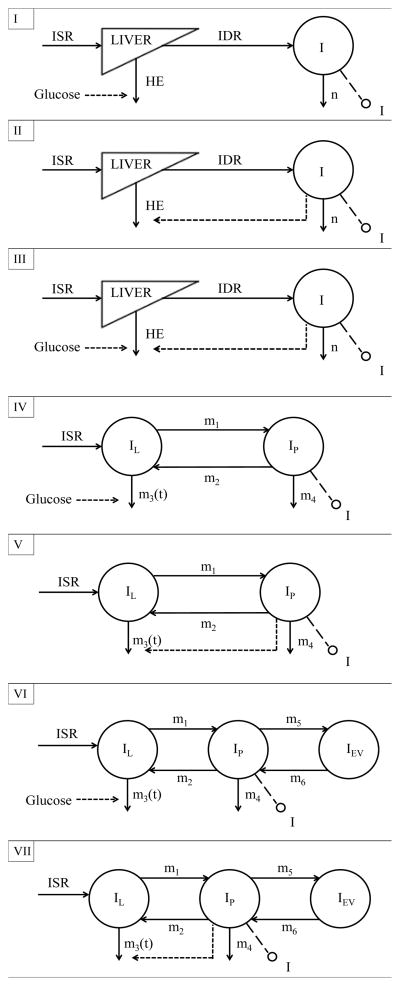
Here, we compare seven different models of system by examining a single, two- and three-compartment description of insulin kinetics (see Fig. 3), with different HE functional relationships.
Fig. 3.
Schematic diagrams of Models I to VII. I (pmol/l), plasma insulin concentration, accessible to measurement; n (min−1), fractional insulin clearance rate; ISR (pmol/min), insulin secretion rate; IDR (pmol/min), posthepatic insulin delivery rate; IL, IP and IEV (pmol/l), insulin concentrations in liver, plasma and extravascular space, respectively; m1, m2, m4, m5, m6 (min−1), rate parameters; m3 (min−1), time-varying parameter dependent from HE; HE (%), hepatic insulin extraction.
Model I
Insulin kinetics is modeled by a single compartment (see Fig. 3, panel I) [3]:
| (7) |
where n (min−1) is the rate constant of insulin clearance, VI (l) is the insulin volume of distribution, and Ib (pmol/l) is basal insulin concentration, I (pmol/l) insulin concentration. The parameters VI and n were here fixed to the values obtained from the linear regression models proposed by Campioni et al. [3].
HE is assumed to be linearly dependent on plasma glucose concentration G (mmol/l):
| (8) |
where aG (l/mmol) is a parameter representing the control of plasma glucose on HE, and a0G (dimensionless) is obtained from the steady state constraint:
| (9) |
HEb and HEtot indices can be calculated as in [3]:
| (10) |
| (11) |
An index of HE sensitivity to glucose, SGHE (l/mmol), can also be derived from these model parameters:
| (12) |
Model II
Also this model has a single compartment insulin kinetics (Fig. 3, panel II), (Eq. 7), but HE is assumed to be dependent on plasma insulin concentration I (pmol/l):
| (13) |
where aI (l/pmol) is a parameter representing the control of insulin on HE, and a0I (dimensionless) is obtained from the steady state constraint:
| (14) |
HEb and HEtot were calculated using Eq. 10–11. In this case, an index accounting for HE sensitivity to insulin, SIHE, can be derived:
| (15) |
Model III
This model again describes insulin kinetics with a single compartment (Eq. 7; see Fig. 3, panel III), but HE is dependent on both plasma insulin and glucose concentrations:
| (16) |
where a0GI (dimensionless) is easily obtained from:
| (17) |
and HEb, HEtot, SGHE, SIHE are derived as described above.
This particular HE description is tested only for the single-compartment insulin kinetics, since the model is already unable to reliably estimate insulin parameters, see Results.
Model IV
Here a two-compartment model (see Fig. 3, panel IV) is used to describe insulin kinetics, similarly to what reported in [13]:
| (18) |
| (19) |
| (20) |
where IL, IP are insulin concentrations in liver and plasma, respectively (pmol/l); I (pmol/l) plasma insulin concentration; ISR (pmol/min) insulin secretion rate; BW individual body weight (kg); VP distribution volume of insulin (l/kg), to be estimated; m1, m4, (min−1) rate parameters to be estimated; m2 (min−1) rate parameter that is fixed to 0.268 min−1 because of the hepatic plasma flow observed in normal subjects [14]; m3 (min−1) is a time-varying parameter which, according to [15], is:
| (21) |
In the basal state, one has:
| (22) |
| (23) |
where:
| (24) |
For HE, we used Eq. 8–9, i.e. the model assumes that HE is controlled by plasma glucose.
Similarly, it is possible to obtain a basal and a total index of HE:
| (25) |
| (26) |
For SGHE, the same expression of Eq. 12 holds.
Model V
This model (see Fig. 3, panel V) describes insulin kinetics using the same two-compartment structure shown above (Eq. 18÷26). The only difference consists in the HE functional description, which just accounts for insulin concentration (Eq. 13–14). For the calculation of HEb, HEtot, and SIHE, Eq. 25-26-15 are used.
Model VI
A three-compartment-model (see Fig. 3, panel VI) describes insulin kinetics across the liver, plasma and extra-vascular space [14]:
| (27) |
| (28) |
| (29) |
| (30) |
where, compared to Model V, IEV (pmol/l), i.e. insulin in the extra-vascular compartment, and the parameters m5 and m6 (min−1), have been added.
For IEV, in basal state, one has:
| (31) |
Eq. 21÷24 from Model IV are still valid, but for HE a dependence on glucose concentration is used, as shown in Eq. 8. For the calculation of HEb, HEtot, and SGHE, Eq. 25-26-12 are used.
Model VII
Here insulin kinetics is described using the same three-compartment description (see Fig. 3, panel VII) shown above (Eq. 27÷30), but HE accounts for insulin concentration only (Eq. 13–14). For the calculation of HEb, HEtot, SIHE, Eq. 25-26-15 are used.
E. Model Identification
C-peptide and insulin models were identified in all subjects by nonlinear weighted least squares implemented in Matlab®. Error on C-peptide and insulin measurements was assumed to be independent, Gaussian, with zero mean and variance dependent to the C-peptide and insulin measurements, respectively, as reported in [7]. Glucose is the model forcing function, thus it is assumed to be known without error.
Data are presented as mean ± SD. Two samples paired and unpaired comparisons were undertaken using nonparametric and T-test, according to the gaussianity.
F. Model Selection
The best model is selected by comparing model performances on the basis of different criteria: residual independence (Anderson Run Test), precision of parameters estimates (expressed as percent coefficient of variation, CV%), ability to describe the data (weighted residual square sum, WRSS), and model parsimony (Akaike Information Criterion, AIC), here calculated as follows:
| (32) |
where P is the number of model parameters.
III. Results
A. Model Selection
Results are summarized in Table I, for both the C-peptide and insulin models. Briefly, Model IV and V have been rejected, because randomness of insulin residuals is poor, and the estimated parameters, especially those of the C-peptide model, exhibit a poor precision.
TABLE I.
Model identification, Selection and results.
| Run test | Precision (mean CV) | WRSS (mean ± SD) | Estimated parameters | AIC (mean ± SD) | |
|---|---|---|---|---|---|
| C-peptide | |||||
| Model I | 81% | 7% | 267±430 | α, Φd, Φs, h | 275±430 |
| Model II | 87% | 7% | 255±350 | α, Φd, Φs, h | 263±350 |
| Model III | 84% | 7% | 256±343 | α, Φd, Φs, h | 264±343 |
| Model IV | 90% | >104 % | 245±319 | α, Φd, Φs, h | 253±319 |
| Model V | 89% | >104% | 253±325 | α, Φd, Φs, h | 261±325 |
| Model VI | 93% | 6% | 148±100 | α, Φd, Φs, h | 156±100 |
| Model VII | 88% | 247% | 237±323 | α, Φd, Φs, h | 245±323 |
|
| |||||
| Insulin | |||||
| Model I | 89% | 12% | 272±158 | aG | 274±158 |
| Model II | 91% | 10% | 268±121 | aI | 270±121 |
| Model III | 94% | 203% | 248±117 | aI, aG | 252±117 |
| Model IV | 59% | 96% | 329±152 | aG, VP, m1, m4 | 337±152 |
| Model V | 67% | 5% | 427±251 | aI, VP, m1, m4 | 435±251 |
| Model VI | 98% | 22% | 124±57 | aG, VP, m1, m4, m5, m6 | 136±57 |
| Model VII | 94% | 10% | 227±164 | aI, VP, m1, m4, m5, m6 | 239±164 |
Models of System III, VII were also rejected, because parameters were estimated with poor precision.
For what concerns the remaining models (Models I, II and VI), they all provide a good precision of parameter estimates, but AIC shows that Model VI is the most parsimonious (AICC-peptide=156±100 and AICInsulin=136±57).
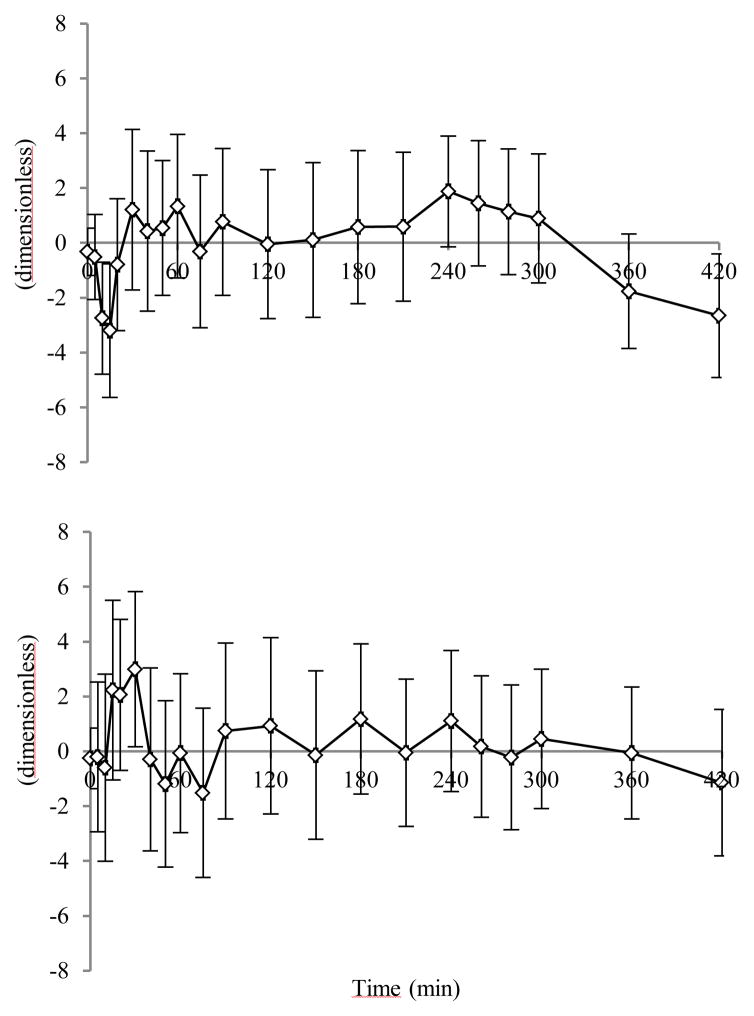
Time courses of weighted residuals, obtained with Model VI, are reported in Fig. 4 (C-peptide and insulin, top and bottom panel, respectively). Parameter estimates are shown in Table II, left column.
Fig. 4.
Average C-peptide (top panel) and insulin (bottom panel) weighted residuals for Model VI. Vertical bars represent ± SD.
TABLE II.
Parameter Estimates of Model VI (MEAN±SD): FS-MTT vs. SS-MTT.
| FS-MTT | SS-MTT | ||
|---|---|---|---|
| VP | (l/kg) | 0.057±0.021 | 0.062±0.027 |
| aG | (l/mmol) | 0.144±0.064 | 0.180±0.085 |
| m4 | (min−1) | 0.335±0.178 | 0.292±0.173 |
| m5 | (min−1) | 0.283±0.116 | 0.255±0.096 |
| m6 | (min−1) | 0.018±0.008 | 0.017±0.009 |
| m1 | (min−1) | 0.946±0.424 | 1.379±0.525 |
| α | (min−1) | 0.091±0.085 | 0.147±0.146 |
| Φd | (10−9) | 558.3±236.0 | 470.2±234.8 |
| Φs | (10−9 min−1) | 34.24±12.50 | 32.98±11.59 |
| h | (mmol/l) | 4.690±0.523 | 4.417±0.699 |
B. FS-MTT vs. SS-MTT
The model performed well also with a reduced sampling scheme, i.e. the SS-MTT [11]. The parameter estimates using the SS-MTT are shown in Table II, right column.
The comparison between the model performance during FS- and SS-MTT is shown in Table III. In the SS-MTT, weighted residuals are substantially random in all the subjects, and WRSS, normalized with the number of samples, are comparable with those obtained with the FS-MTT. Moreover, the precision of parameter estimates is still good, despite loss of 10 samples.
TABLE III.
Model VI: Comparison of FS- and SS-MTT.
| N° of samples | Run Test | Precision (mean CV) | nWRSS (mean±SD) | |
|---|---|---|---|---|
| C-peptide | ||||
| FS MTT | 21 | 93% | 6% | 7±5 |
| SS MTT | 11 | 97% | 13% | 8±14 |
|
| ||||
| Insulin | ||||
| FS MTT | 21 | 98% | 22% | 6±3 |
| SS MTT | 11 | 97% | 27% | 5±6 |
IV. Discussion
The amount of insulin reaching the systemic circulation is not only dependent on the amount secreted by pancreatic beta-cells, but also on the insulin percentage that is extracted by the liver from the portal circulation, during the first-pass transit. HE is usually approximately 50%, even if it varies depending on different conditions; since it contributes to cellular control on insulin, it is related to insulin action, and so it needs to be properly quantified, in basal, as well as in dynamic situations (e.g. after an oral glucose load). Being a direct measure of HE very invasive, the current method used to assess HE employs mathematical models, that just need the measurements of plasma glucose, insulin and C-peptide concentrations to be applied. At the base of these models, there is the known concept that C-peptide and insulin are equimolarly secreted, but only insulin is extracted by the liver; this fact allows conception of models which describe insulin, and thus C-peptide, secretion, and kinetics, including HE.
The current state of the art for estimating HE, during a meal test, is represented by the model previously described by Campioni et al. [3]. ISR was obtained from the two-compartment oral C-peptide model [11, 12], while HE was described as a piecewise linear function with seven breakpoints, in which the values of HE were parameters to be estimated by fitting the model to insulin data. This fact enabled the model to describe meal data. On the other hand, the limitation of this approach arises from the description of HE, which lacks a physiological or mechanistic meaning, and makes the model vulnerable to noise.
In order to improve HE assessment, we thought to introduce a new physiological description of HE, based on the evidence that, during an oral test, while glucose and insulin concentrations rise, the HE profile decreases. This relationship is derived from reconstructed profiles of HE [3], and accounts for the observation that nutrient intake modifies HE [16, 17], and that glucose ingestion both stimulates insulin secretion and reduces HE [6]. Moreover, Pivovarova et al. [18] have demonstrated that insulin degrading enzyme (IDE) activity, which is the main enzyme responsible for cellular insulin degradation, is inhibited by hyperglycemia and hyperinsulinemia. For all these reasons, we described HE as a linear function of plasma glucose and insulin alone, and then in combination; these expressions were introduced first in the single- [3], then in the two- [13, 15] and three-compartment [14] insulin models, generating seven new models, that were compared.
It is notable that, although in the single-compartment version the dependence of HE on insulin or glucose alone had similar performances (see Table I), the increase in model order makes the relationship between HE and insulin unable to provide reliable results (see Table I). Moreover, a dependence of HE on both insulin and glucose concentrations is only possible in a single-compartment description (Model III). In fact, since glucose and insulin profiles have a similar pattern during the meal, this expression was unable to precisely estimate the parameters.
Based on our results, Model VI, which describes insulin kinetics using three compartments [14], and contains an expression of HE dependence on glucose concentration, was chosen.
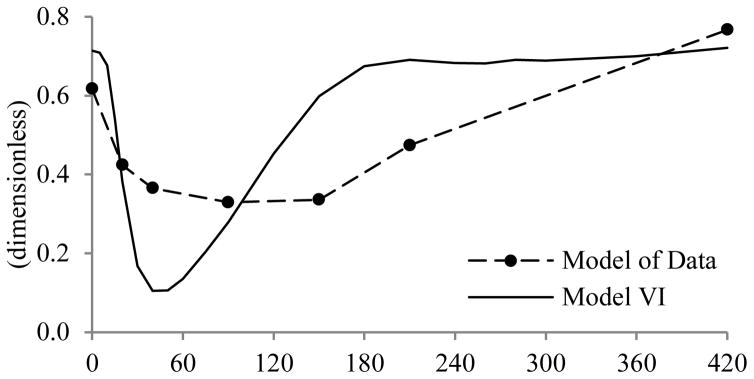
The new model shows good performance in terms of its ability to describe data, and in the precision of parameter estimates. If compared to the Model of Data, developed by Campioni et al., the resulting HE patterns are different. The average HE obtained from Model VI is shown in Fig. 5, together with that provided by the Model of Data. Evidently, HE decreases more rapidly and to a greater extent with Model VI, than with the Model of Data; in addition, the new profile returns to its basal state at the end of the experiment, as would be expected 420 minutes after meal ingestion.
Fig. 5.
Average HE profile of Model of Data and Model VI.
Although both HEb and HEtot indices provided by Campioni et al. differ significantly from those reported by the new model (p≪0.05) and they are negatively correlated (R=−0.034 and p≫0.05, R=−0.0117 and p>0.05, for basal and total indices, respectively), it is of note that, like previous reports, both demonstrate a high percentage of insulin extraction by the liver [HEbModel of Data (%)= 62% vs. HEbModel VI (%)= 71%, and HEtotModel of Data (%)= 44% vs. HEtotModel VI (%)= 66%]; this is due to the fact that, in Model VI, HEb also depends on m4, that is one of the estimated parameters, while in the Model of Data, the same index is calculated from population values and basal measurements. However, the differences in absolute values likely reflect the differences in model structure adopted to calculate HE.
A further interesting result is found by dividing the entire database into two groups according to age. Indeed, differences in hepatic extraction between old (E) and young (Y) people are evident considering the new index derived from Model VI, SGHE, which shows a higher sensitivity of HE to glucose in Y vs. E subjects, both in the FS- (SGHE=0.164 vs. 0.136, respectively, p<0.05) and SS-MTT (SGHE=0.196 vs. 0.172, respectively, p<0.05); on the other hand, differences in the HEb and HEtot indices were not apparent neither in FS-(HEb=0.728 vs. 0.703, respectively, p>0.05; HEtot=0.677 vs. 0.646, respectively, p>0.05) nor in SS-MTT (HEb=0.743 vs. 0.722, respectively, p>0.05; HEtot=0.685 vs. 0.641, respectively, p>0.05). Obviously, additional studies are needed in order to confirm these results.
The new model offers many advantages. The use of a three-compartment description for insulin kinetics is more physiological than the single- and two-compartment models, since it considers plasma, liver and extravascular spaces. Furthermore, differently from the piecewise linear function, being HE linearly dependent on glucose concentration, a new index of HE sensitivity to glucose is available.
Another advantage of the new model, is that, besides showing good performances in the FS-MTT condition [10], it can also describe the data using the SS-MTT time grid [11], providing precise parameter estimates (Table III), and well correlated HE indexes, among the two tests.
V. Conclusion
The present study demonstrates that the HE model proposed by Campioni et al., can be improved by adopting a three-compartment model for the description of insulin kinetics, and by substituting the piecewise linear function with a simple linear expression which links HE to plasma glucose concentration. Future developments could concern the introduction of this new model in the meal simulation model of the glucose and insulin system [15], replacing the pre-existent two-compartment insulin kinetics, and the linear relationship that links HE to insulin secretion, which suffers from some limitations in the prediction of HE in a given individual. Further studies will be required to assess the validity of this model during different oral stimuli, e.g. OGTT, and to evaluate its ability to discriminate between subjects with differing glucose tolerance status and β-cell function.
Acknowledgments
The authors acknowledge the support of the Italian Ministero dell’Università e della Ricerca Scientifica (FIRB 2008). Dr. Vella has received research grants from Merck and Daiichi-Sankyo. He is an investigator in multicenter studies sponsored by Novartis and GI dynamics, respectively. He has consulted for Genentech, Sanofi-Aventis and Novartis.
Contributor Information
Francesca Piccinini, Department of Information Engineering, University of Padova, Italy.
Chiara Dalla Man, Department of Information Engineering, University of Padova, Italy.
Adrian Vella, Division of Endocrinology, Diabetes & Metabolism, Mayo Clinic College of Medicine, Rochester, MN, USA.
Claudio Cobelli, Department of Information Engineering, University of Padova, Via Gradenigo 6B, I-35131 Padova, Italy.
References
- 1.Polonsky KS, et al. C-peptide as a measure of the secretion and hepatic extraction of insulin. Pitfalls and limitations. Diabetes [Online] 1984 May;33(5):486–94. doi: 10.2337/diab.33.5.486. Available: http://diabetes.diabetesjournals.org/content/33/5/486.long. [DOI] [PubMed] [Google Scholar]
- 2.Cobelli C, et al. Diabetes: Models, Signals, and Control. IEEE Reviews in Biomedical Engineering [Online] 2009 Jan;2:54–96. doi: 10.1109/RBME.2009.2036073. Available: http://www.ncbi.nlm.nih.gov/pmc/articles/PMC2951686/ [DOI] [PMC free article] [PubMed] [Google Scholar]
- 3.Campioni M, et al. Minimal model assessment of hepatic insulin extraction during an oral test from standard insulin kinetic parameters. Am J Physiol Endocrinol Metab [Online] 2009 Oct;297:E941–E948. doi: 10.1152/ajpendo.90842.2008. Available: http://ajpendo.physiology.org/content/297/4/E941.long. [DOI] [PMC free article] [PubMed] [Google Scholar]
- 4.Meier JJ, et al. Pulsatile insulin secretion dictates systemic insulin delivery by regulating hepatic insulin extraction in humans. Diabetes [Online] 2005 Jun;54(6):1649–1656. doi: 10.2337/diabetes.54.6.1649. Available: http://diabetes.diabetesjournals.org/content/54/6/1649.long. [DOI] [PubMed] [Google Scholar]
- 5.Wiesenthal SR, et al. Free fatty acids impair hepatic insulin extraction in vivo. [Erratum appears in Diabetes Jun;48(6):1348, 1999] Diabetes [Online] 1999 Apr;48(4):766–774. doi: 10.2337/diabetes.48.4.766. Available: http://diabetes.diabetesjournals.org/content/48/4/766.long. [DOI] [PubMed] [Google Scholar]
- 6.Duckworth CW, et al. Insulin Degradation: Progress and Potential. Endocrine Reviews [Online] 1998 Oct;19(5):608–624. doi: 10.1210/edrv.19.5.0349. Available: http://press.endocrine.org/doi/abs/10.1210/edrv.19.5.0349?url_ver=Z39.88-2003&rfr_id=ori:rid:crossref.org&rfr_dat=cr_pub%3dpubmed. [DOI] [PubMed] [Google Scholar]
- 7.Toffolo G, et al. A minimal model of insulin secretion and kinetics to assess hepatic insulin extraction. Am J Physiol Endocronol Metab [Online] 2006 Jan;290:E169–E176. doi: 10.1152/ajpendo.00473.2004. Available: http://ajpendo.physiology.org/content/290/1/E169.long. [DOI] [PubMed] [Google Scholar]
- 8.Toffolo G, et al. Estimation of beta cell sensitivity from IVGTT C-peptide data. Knowledge of the kinetics avoids errors in modeling the secretion. Diabetes [Online] 1995 Jul;44:845–854. doi: 10.2337/diab.44.7.845. Available: http://diabetes.diabetesjournals.org/content/44/7/845.long. [DOI] [PubMed] [Google Scholar]
- 9.Van Cauter E, et al. Estimation of insulin secretion rates from C-peptide levels. Comparison of individual and standard kinetic parameters for C-peptide clearance. Diabetes [Online] 1992 Mar;41:368–377. doi: 10.2337/diab.41.3.368. Available: http://diabetes.diabetesjournals.org/content/41/3/368.long. [DOI] [PubMed] [Google Scholar]
- 10.Basu R, et al. Effects of age and sex on postprandial glucose metabolism: differences on glucose turnover, insulin secretion, insulin action, and hepatic insulin extraction. Diabetes [Online] 2006 Jul;55:2001–2014. doi: 10.2337/db05-1692. Available: http://diabetes.diabetesjournals.org/content/55/7/2001.long. [DOI] [PubMed] [Google Scholar]
- 11.Breda E, et al. Oral glucose tolerance test minimal model indexes of beta-cell function and insulin sensitivity. Diabetes [Online] 2001 Jan;50:150–158. doi: 10.2337/diabetes.50.1.150. Available: http://diabetes.diabetesjournals.org/content/50/1/150.long. [DOI] [PubMed] [Google Scholar]
- 12.Eaton RP, et al. Prehepatic insulin production in man: kinetic analysis using peripheral connecting peptide behavior. J Clin Endocrinol Metab [Online] 1980 Sep;51:520–528. doi: 10.1210/jcem-51-3-520. Available: http://press.endocrine.org/doi/abs/10.1210/jcem-51-3-520?url_ver=Z39.88-2003&rfr_id=ori:rid:crossref.org&rfr_dat=cr_pub%3dpubmed. [DOI] [PubMed] [Google Scholar]
- 13.Ferrannini E, Cobelli C. The role of insulin kinetics in man. II. Role of the liver. Diabetes Metab Review. 1987 Apr;3(2):365–97. doi: 10.1002/dmr.5610030202. [DOI] [PubMed] [Google Scholar]
- 14.Sherwin RS, et al. A Model of the Kinetics of Insulin in Man. The Journal of Clinical Investigation [Online] 1974 May;52:1481–1492. doi: 10.1172/JCI107697. Available: http://www.jci.org/articles/view/107697. [DOI] [PMC free article] [PubMed] [Google Scholar]
- 15.Dalla Man C, et al. Meal Simulation Model of the Glucose-Insulin System. IEEE Transaction on Biomedical Engineering [Online] 2007 Oct;54(10):1740–1749. doi: 10.1109/TBME.2007.893506. Available: http://ieeexplore.ieee.org/xpl/articleDetails.jsp?arnumber=4303268. [DOI] [PubMed] [Google Scholar]
- 16.Hennes MM, et al. Effects of free fatty acids and glucose on spalachnic insulin dynamics. Diabetes [Online] 1997 Jan;46:57–62. doi: 10.2337/diab.46.1.57. Available: http://diabetes.diabetesjournals.org/content/46/1/57.long. [DOI] [PubMed] [Google Scholar]
- 17.Pagano C, et al. Effect of lactate on hepatic insulin clearance in perfused rat liver. Am J Physiol [Online] 1996 Mar;270:R682–R687. doi: 10.1152/ajpregu.1996.270.3.R682. Available: http://ajpregu.physiology.org/content/270/3/R682. [DOI] [PubMed] [Google Scholar]
- 18.Pivovarova O, et al. Glucose inhibits the insulin-induced activation of the insulin-degrading enzyme in HepG2 cells. Diabetologia [Online] 2009 Aug;52:1656–1664. doi: 10.1007/s00125-009-1350-7. Available: http://link.springer.com/article/10.1007%2Fs00125-009-1350-7. [DOI] [PubMed] [Google Scholar]


