Abstract
Osteosarcoma is suggested to be caused by genetic and molecular alterations that disrupt osteoblast differentiation. Recent studies have reported that transmembrane protein 119 (TMEM119) contributes to osteoblast differentiation and bone development. However, the level of TMEM119 expression and its roles in osteosarcoma have not yet been elucidated. In the present study, TMEM119 mRNA and protein expression was found to be up-regulated in osteosarcoma compared with normal bone cyst tissues. The level of TMEM119 protein expression was strongly associated with tumor size, clinical stage, distant metastasis and overall survival time. Moreover, gene set enrichment analysis (GSEA) of the Gene Expression Omnibus (GEO) GSE42352 dataset revealed TMEM119 expression in osteosarcoma tissues to be positively correlated with cell cycle, apoptosis, metastasis and TGF-β signaling. We then knocked down TMEM119 expression in U2OS and MG63 cells using small interfering RNA, which revealed that downregulation of TMEM119 could inhibit the proliferation of osteosarcoma cells by inducing cell cycle arrest in G0/G1 phase and apoptosis. We also found that TMEM119 knockdown significantly inhibited cell migration and invasion, and decreased the expression of TGF-β pathway-related factors (BMP2, BMP7 and TGF-β). TGF-β application rescued the inhibitory effects of TMEM119 knockdown on osteosarcoma cell migration and invasion. Further in vitro experiments with a TGF-β inhibitor (SB431542) or BMP inhibitor (dorsomorphin) suggested that TMEM119 significantly promotes cell migration and invasion, partly through TGF-β/BMP signaling. In conclusion, our data support the notion that TMEM119 contributes to the proliferation, migration and invasion of osteosarcoma cells, and functions as an oncogene in osteosarcoma.
Introduction
Osteosarcoma, a highly aggressive tumor arising in long bones, represents the most common primary malignancy in teenagers and young adults.1 It derives from primitive bone-forming mesenchymal cells and predominantly occurs around regions with active bone growth and repair, such as the knee joint, lower femur and upper tibia,2 and data suggest that osteosarcoma may be caused by genetic and molecular alterations that disrupt osteoblast differentiation.3, 4 With the recent advances in treatment combining surgery with chemotherapy and radiotherapy, the 5-year overall survival rate of osteosarcoma patients has increased to ~50–60%.5, 6 However, the survival rate is <30% in patients who present with metastasis.7 Therefore, preventing metastasis during the early stage of tumor development is key to improving the prognosis of osteosarcoma patients.
Recently, numerous studies have demonstrated altered expression of some transmembrane proteins (TMEMs) in various human cancers, including kidney, lung, liver, colon, glioma, breast and ovarian cancers, indicating that these TMEMs function as important regulators of carcinogenesis.8, 9, 10, 11, 12, 13, 14, 15, 16, 17, 18 However, little is known regarding the association between TMEMs and osteosarcoma. TMEM119, a member of the transmembrane protein family and also known as osteoblast induction factor (Obif), is O-glycosylated at its N-terminal region.19 Studies to date have reported that TMEM119 contributes to bone and testis development20 as well as to osteoblast differentiation.21, 22, 23, 24 As it has been suggested that osteosarcoma is caused by disruption of osteoblast differentiation, we hypothesized that TMEM119 may be involved in osteosarcoma tumorigenesis. In the current study, we determined the expression patterns of TMEM119 at both the mRNA and protein levels in osteosarcoma tissues and revealed the clinical value of its aberrant expression in this disease. Furthermore, the biological functions of TMEM119 in osteosarcoma were elucidated in vitro and in vivo.
Materials and methods
Patients and tissue samples
Between January 2005 and June 2009, 20 patients with bone cysts and 100 patients with osteosarcoma admitted to Affiliated Yixing Hospital of Jiangsu University and the First Affiliated Hospital of Soochow University were enrolled in this study. The clinical stage of osteosarcoma was classified according to the 6th edition of the tumor-node-metastasis (TNM) classification of the International Union against Cancer. For real-time PCR assays, 45 osteosarcoma and 20 bone cyst samples were immediately frozen in liquid nitrogen and stored at −80 °C until use. Immunohistochemical (IHC) analysis was performed on archived paraffin-embedded specimens from 100 patients with osteosarcoma, all of whom received follow-up lasting from 3 to 60 months (average 34.3 months). This study was approved by the Research Ethics Committee of Affiliated Yixing Hospital of Jiangsu University and the First Affiliated Hospital of Soochow University. Written informed consent was obtained from all patients.
Real-time quantitative RT-PCR assay
The expression levels of TMEM119 mRNA in tissue samples or cell lines were detected by real-time quantitative RT-PCR assay, as previously described.25 Briefly, total RNA was extracted using TRIzol reagent (Invitrogen, Carlsbad, CA, USA) according to the manufacturer's protocol and treated with DNase to remove residual genomic DNA. Reverse transcription was carried out using the RevertAid First Strand cDNA Synthesis Kit (Fermantas, Hanover, MD, USA) with random primers. The resulting cDNAs were used as templates for PCR amplification on ABI 7500 instrument (Applied Biosystems, Foster City, CA, USA) using the following primers: human TMEM119 forward primer, 5′-CTGGCCTTTCTGCTGATGTTC-3′, and reverse primer, 5′-TCACTCTGGTCCACGTACTTC-3′ human glyceraldehyde 3-phosphate dehydrogenase (GAPDH) forward primer, 5′-CACCCACTCCTCCACCTTTG-3′ and reverse primer, 5′-CCACCACCCTGTTGCTGTAG-3′. Each sample was examined in triplicate, and GAPDH served as the internal control.
Western blot analysis
Tissue samples and cultured cells were lysed on ice with radioimmunoprecipitation assay buffer (150 mM NaCl, 1% nonyl phenoxypolyethoxylethanol-40, 0.5% deoxycholate, 0.1% sodium dodecyl sulfate (SDS) and 50 mM Tris pH 8) supplemented with a protease inhibitor cocktail (Roche, Indianapolis, IN, USA). The protein concentration was determined using bicinchoninic acid (Pierce, Rockford, IL, USA). Equal amounts of protein from each sample were separated using SDS-polyacrylamide gels and transferred onto polyvinylidene difluoride membranes. After blocking with 5% skim milk, the membranes were probed overnight with primary antibodies at 4 °C. Horseradish peroxidase-conjugated secondary antibodies (Beyotime; Shanghai, China) followed by enhanced chemiluminescence reagent (Pierce; Minneapolis, MN, USA) were used for detection. Each sample was examined in triplicate, with GAPDH as the loading control. The results were analyzed using ImageJ software (http://rsb.info.nih.gov/ij/, Bethesda, MD, USA). The sources of primary antibodies were as follows: antibodies against CDK1, caspase-8, caspase-9, MMP2, Twist1, N-cadherin, vimentin, α-SMA, BMP2, BMP7, TGF-β and Smad1 were obtained from Abcam (Cambridge, MA, USA); antibodies against TMEM119, Bcl2 and p-Smad1/5/8 were obtained from Santa Cruz Biotechnology (Santa Cruz, CA, USA); antibodies against CDC25A, PCNA, ZEB1, E-cadherin, Smad2/3 and p-Smad2/3 were obtained from Cell Signaling Technology (Danvers, MA, USA).
IHC analysis
IHC was performed to detect the levels of TMEM119 protein expression in osteosarcoma tissues. For antigen retrieval, slides were immersed in 10 mM sodium citrate buffer solution (pH 6) and heated in a pressure cooker for 10 min. The slides were then incubated overnight with anti-TMEM119 (1:100 dilution; goat IgG; Santa Cruz Biotechnology) in a moist chamber at 4 °C followed by incubation for 1 h with a horseradish peroxidase (HRP)-conjugated secondary antibody at room temperature. As a negative control, the primary antibody was replaced with normal goat IgG. The sections were developed with diaminobenzidine tetrahydrochloride and counterstained with hematoxylin. IHC staining was evaluated by two independent pathologists according to the extent of positivity, as follows: low or negative TMEM119 expression when positive staining was present in no more than 25% of the tumor region; high TMEM119 expression when staining was present in >25% of the tumor region.
Cell culture
Human osteosarcoma cells, including Saos2, MG63, HOS, SW1353 and U2OS, and human embryonic kidney HEK293T cells were purchased from the cell bank of the Shanghai Biology Institute, Chinese Academy of Sciences (Shanghai, China) and maintained at 37 °C in a 5% CO2 atmosphere. MG63, HOS, Saos2, SW1353 and HEK293 cells were grown in DMEM (Life Technologies; Carlsbad, CA, USA) and U2OS cells in RPMI 1640 medium (Life Technologies). All media were supplemented with 10% fetal bovine serum (FBS; Hyclone, Logan, UT, USA) and 1% penicillin/streptomycin.
Small interfering RNA transfection
TMEM119 siRNA and control small interfering RNA (siRNA) were designed and synthesized by Genepharma (Shanghai, China). To knock down TMEM119 expression, U2OS and MG63 cells at 70–80% confluence were transfected with 2 μg ml−1 siRNA using Lipofectamine 2000 transfection reagent (Life Technologies) following the manufacturer's instructions. After 48 h, the knockdown efficiency was analyzed by real-time PCR and western blotting.
Construction of a TMEM119 overexpression construct and infection into cells
The human TMEM119 gene was cloned into the CD513B-1 lentiviral vector (SBI, Mountain View, CA, USA) by Genewiz (Suzhou, China). CD513B-1 or CD513B-1-TMEM119 were cotransfected with psPAX2 and pMD2G (Addgene; Cambridge, MA, USA) into HEK293T cells using Lipofectamine 2000 (Life Technologies). The viral supernatant was collected and used to infect Saos2 cells. Approximately 48 h later, TMEM119 expression was analyzed by real-time PCR and western blotting.
Counting Kit-8 assay
Counting Kit-8 (CCK-8) assay was performed to measure cell proliferation by standard methods. Briefly, cells were plated in 96-well plates at a density of 3 × 10³ cells per well. After overnight incubation, cells were treated as indicated. At 0, 24, 48 and 72 h after treatment, cells were incubated for 1 h in CCK-8 solution (Dojindo Lab, Kumamoto, Japan) in culture medium at 37 °C. Absorbance at 450 nm (A450nm) was detected using a microplate reader (Bio-Rad; Richmond, CA, USA).
Cell cycle distribution analysis
Cell cycle distribution was determined by propidium iodide (PI) staining and flow cytometry analysis. Briefly, cells plated in 6-well plates were transfected with TMEM119 siRNA or control siRNA. At 48 h after transfection, the cells were collected, resuspended in PBS, and fixed overnight in 70% ethanol at −20 °C. The cells were then washed in PBS and resuspended in PI staining buffer containing 20 μg ml−1 PI and 100 μg ml−1 ribonuclease (Sigma; St Louis, MO, USA). After a 30-min incubation in the dark, the cells were analyzed by FACScan flow cytometry (BD Biosciences; San Jose, CA, USA).
Cell apoptosis assay
The percentage of cells undergoing apoptosis was evaluated by double staining with Annexin V-fluorescein isothiocyanate (FITC) and PI. At 24 h after siRNA transfection, the cells were harvested, incubated for 20 min with Annexin V-FITC Apoptosis Detection solution (BD Biosciences) in the dark, and analyzed by flow cytometry. Annexin V-positive and PI-negative-stained cells are early apoptotic cells, whereas cells showing positive staining with Annexin V and PI are in the late stages of apoptosis.
Tumor xenografts in nude mice
Animal experiments were approved by the Animal Experimentation Ethics Committee at Affiliated Yixing Hospital of Jiangsu University. Twelve female BALB/c nude mice at 4–5 weeks old (SLAC Animal, Shanghai, China) were maintained under normal specific pathogen-free conditions throughout the experiments. To establish a xenograft tumor model, 2 × 10⁶ U2OS cells in 0.1 ml PBS were subcutaneously injected into the right flank of the mice. Ten days after cell inoculation, the mice were randomly divided into two groups and administered TMEM119 siRNA or control siRNA containing formulations via intravenous injection twice a week for 3 weeks (n=6 per group). Tumor growth was monitored were measured every three days as previously described.8 At 45 days after inoculation, the mice were euthanized by cervical dislocation, and tumor weight was recorded. For IHC analyses, tumors were formalin-fixed, paraffin-embedded, sectioned and analyzed using Ki67 immunostaining (Abcam) or the TUNEL assay (Roche).
Cell migration and invasion assays
To measure the migration and invasive potential of cells, transwell assays were carried out using non-Matrigel-coated and Matrigel-coated Boyden chambers (BD Biosciences), respectively. U2OS and MG63 cells were transfected with TMEM119 siRNA or control siRNA. Saos2 cells were infected with TMEM119 or the vector. The cells were serum-starved overnight, harvested, resuspended in serum-free medium, and added to the upper chamber (1 × 10⁵ per well). Medium containing 10% FBS was added to the lower chamber. After incubation for 24 h, the upper side of the membrane was gently wiped with cotton swabs. The membrane was then fixed in 4% formaldehyde and stained with 0.5% crystal violet. The number of migrated and invaded cells was counted in five random microscope fields (× 200).
Bioinformatic analysis
Osteosarcoma gene expression data were obtained from Gene Expression Omnibus (GEO) using accession numbers GSE42352 and GSE39055. To determine differentially expressed genes associated with TMEM119 expression, gene set enrichment analysis (GSEA) was performed based on the GSE42352 dataset using GSEA version 2.0 from the Broad Institute at MIT, as previously described.26
Statistical analysis
GraphPad PRISM software version 6.0 (San Diego, CA, USA) was used for the statistical analysis. The association between TMEM119 expression and various clinicopathological features of osteosarcoma patients was analyzed using Fisher's exact test. Overall survival for patient groups with low or high TMEM119 protein expression was determined by the Kaplan–Meier method and log-rank test. For in vitro experiments, data from three independent experiments are presented as the mean±s.d. (s.d.); statistical analysis was performed using Student's t-test or ANOVA followed by post hoc analysis. Statistical significance was set at P<0.05.
Results
TMEM119 expression in human osteosarcoma tissues
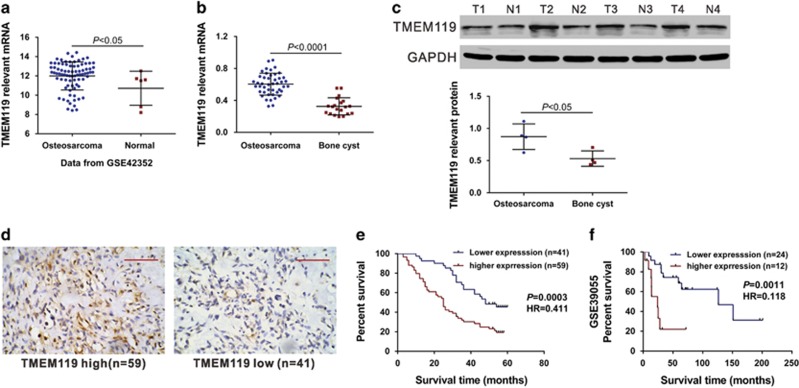
First, we analyzed microarray data of the Gene Expression Omnibus (GEO) dataset (Access id: GSE42352) and found that TMEM119 expression was significantly increased in osteosarcoma tissues compared with normal osteoblast samples (Figure 1a, P<0.05). We then used real-time PCR to assess TMEM119 mRNA expression in 45 snap-frozen osteosarcoma tissues and 20 bone cyst tissues collected from Affiliated Yixing Hospital of Jiangsu University and the First Affiliated Hospital of Soochow University. Compared with bone cyst tissues, TMEM119 mRNA expression was significantly increased in osteosarcoma tissues (Figure 1b, P<0.0001). Similar changes were observed at the protein level by western blot analysis (Figure 1c, P<0.05).
Figure 1.
TMEM119 overexpression is associated with poor survival of osteosarcoma patients. (a) TMEM119 mRNA expression was significantly higher in osteosarcoma tissues (n=81) than in normal osteoblasts (n=6) from GSE42352 (P<0.05). (b) The level of TMEM119 mRNA was significantly elevated in osteosarcoma tissues (n=45) compared to that in bone cyst tissues (n=20) from patients admitted to Affiliated Yixing Hospital of Jiangsu University and the First Affiliated Hospital of Soochow University (P<0.0001). (c) TMEM119 protein expression was determined by western blotting analysis in osteosarcoma (T1–T4) and bone cyst tissues (N1–N4). The experiments were repeated at least three times with similar results. (d) TMEM119 protein expression in osteosarcoma tissues was determined by IHC staining. Magnification: × 200, scale bars: 100 μm. (e) The overall survival time of 100 patients with osteosarcoma based on IHC staining (P=0.0003, HR=0.411, 95% CI: 0.254–0.668). (f) Survival analysis of patients from GSE39055 (P=0.0011, HR=0.118, 95% CI: 0.0.28–0.428).
Increased TMEM119 expression is associated with the prognosis of osteosarcoma patients
Next, we attempted to explore the association of TMEM119 expression and patient prognosis. IHC staining was performed on 100 human osteosarcoma specimens using a primary antibody against TMEM119, with 59 osteosarcoma tissues showing high levels of TMEM119 expression and 41 tissues low expression (Figure 1d). The 100 osteosarcoma patients were divided into two groups according to IHC results: high TMEM119 expression group (n=59) and low TMEM119 expression group (n=41). The association between TMEM119 expression and various clinicopathological features of osteosarcoma patients was then analyzed, and the results are shown in Table 1. The results of Fisher's exact test indicated TMEM119 expression to be strongly associated with tumor size (P=0.0265), clinical stage (P=0.0019) and distant metastasis (P=0.0135). Simple regression analysis showed a significant correlation between tumor size and the level of TMEM119 expression (R=0.7919, P<0.0001).
Table 1. Correlation of TMEM119 expression with clinicopathological features of osteosarcoma.
| Variable | All cases |
TMEM119
protein expression |
P-value | |
|---|---|---|---|---|
| Low (n=41) | High (n=59) | |||
| Age at surgery | ||||
| <14 | 32 | 14 | 18 | 0.8278 |
| ⩾14 | 68 | 27 | 41 | |
| Gender | ||||
| Male | 57 | 22 | 35 | 0.6819 |
| Female | 43 | 19 | 24 | |
| Anatomic location | ||||
| Femur | 50 | 23 | 27 | 0.2313 |
| Tibia | 28 | 13 | 15 | |
| Humerus | 10 | 3 | 7 | |
| Others | 12 | 2 | 10 | |
| Tumor size | ||||
| ⩾5 cm | 55 | 17 | 38 | 0.0265* |
| <5 cm | 45 | 24 | 21 | |
| Clinical stage | ||||
| IIA | 42 | 25 | 17 | 0.0019** |
| IIB/III | 58 | 16 | 42 | |
| Distant metastasis | ||||
| Absent | 58 | 30 | 28 | 0.0135* |
| Present | 42 | 11 | 31 | |
*P<0.05, **P<0.01.
The correlation between TMEM119 protein expression and prognosis of osteosarcoma patients was also analyzed using the Kaplan–Meier method and the log-rank test. As shown in Figure 1e, the overall survival time of the low TMEM119 expression group (median overall survival, 48 months) was significantly longer than that of the high TMEM119 expression group (median overall survival, 25 months; P<0.01). Similar results were observed when analyzing the GSE39055 dataset (Figure 1f, P<0.01). These results suggest that upregulation of TMEM119 expression in osteosarcoma patients contributes to poor survival.
TMEM119-related pathways
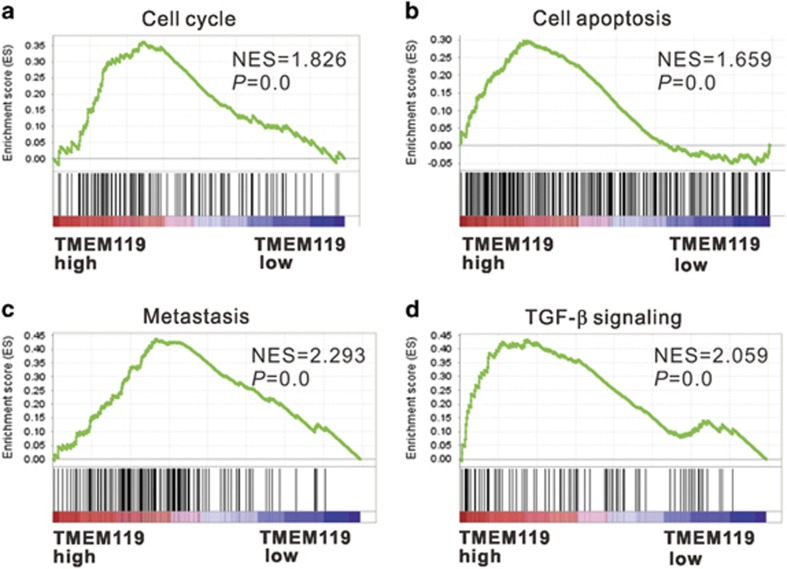
To identify pathways, biological processes and molecular functions correlated with TMEM119 expression in osteosarcoma, we performed GSEA on the GSE42352 dataset. As shown in Figure 2, high TMEM119 expression was strongly associated with cancer-related pathways, including the cell cycle, apoptosis, metastasis and TGF-β signaling, which suggests that TMEM119 may participate in osteosarcoma pathogenesis and progression.
Figure 2.
GESA on the GSE42352 dataset. Enrichment plots of gene expression signatures for cell cycle (a), cell apoptosis (b), metastasis (c) and TGF-β (d) pathways according to TMEM119 expression level. NES, normalized enrichment score.
Knockdown of TMEM119 expression inhibits growth of osteosarcoma cells in vitro
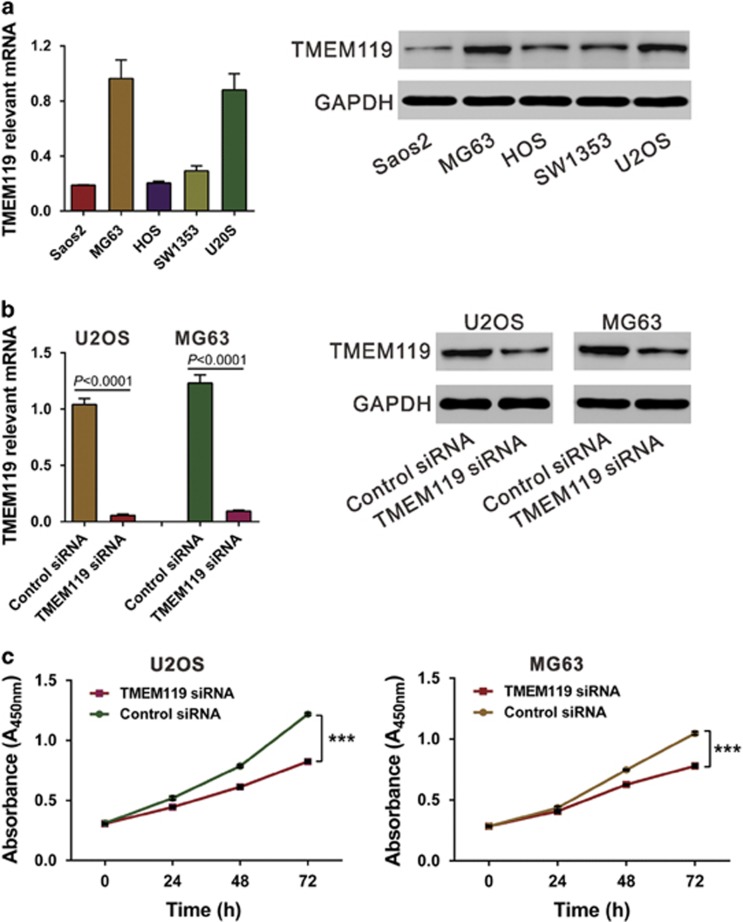
To examine the biological roles of TMEME119, we knocked down its expression in U2OS and MG63 cells, which express relatively high levels of TMEM119 (Figure 3a), using siRNA. TMEM119 siRNA efficiently suppressed TMEM119 expression in both osteosarcoma cell lines (Figure 3b). Cell proliferation was detected in vitro using the CCK-8 assay (Figure 3c), and TMEM119 siRNA transfection significantly decreased proliferation at 24, 48 and 72 h compared with control siRNA. A bromodeoxyuridine (BrdU) incorporation assay also demonstrated the inhibitory effects of TMEM119 siRNA on cell proliferation at 48 h after siRNA transfection (Supplementary Figure S1). In contrast, the proliferation of Saos2 cells, which express a low level of TMEM119, was increased by TMEM119 overexpression (Supplementary Figure S2). These results suggest that TMEM119 may promote osteosarcoma cell proliferation.
Figure 3.
Suppressing TMEM119 expression represses the proliferation of osteosarcoma cells. (a) TMEM119 expression in five osteosarcoma cell lines was analyzed by real-time PCR (left panel) and western blotting (right panel) using GAPDH as the internal control. The experiments were repeated at least three times with similar results. (b) TMEM119 expression in U2OS and MG63 cells was analyzed by real-time PCR (left panel) and western blotting (right panel). The experiments were repeated at least three times with similar results. (c) Cell proliferation was detected in siRNA-transfected U2OS and MG63 cells by the CCK-8 assay. ***P<0.001.
TMEM119 knockdown induces G0/G1-phase arrest and apoptosis in osteosarcoma cells
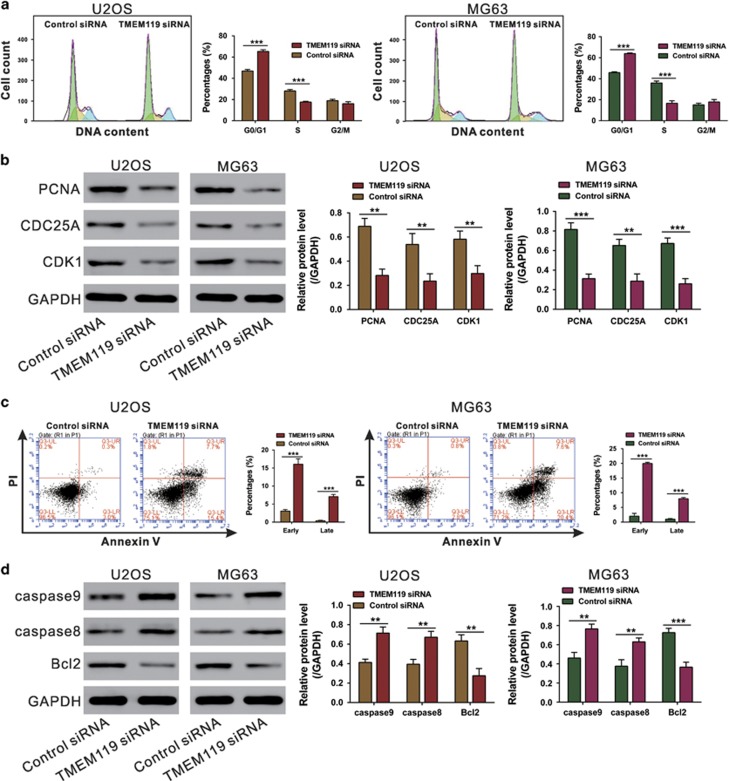
As GSEA revealed cell cycle and apoptosis pathways to be strongly associated with high TMEM119 expression, flow cytometry analysis was applied to examine the cell cycle and apoptosis in TMEM119-knockdown cells. Compared with control siRNA-transfected cells, the U2OS cell population transfected with TMEM119 siRNA at G0/G1 phase was significantly increased by 39.4%, with those in S phase being decreased by 37.4%. Similar results were obtained in MG63 cells (Figure 4a). Consistent with our functional assays, both cell lines knocked down for TMEM119 showed a significant decrease in the levels of G1/S transition-related proteins PCNA, CDC25A and CDK127 (Figure 4b). Moreover, TMEM119 siRNA transfection markedly increased the rates of both early and late apoptotic cells compared with the cells transfected with siNC (Figure 4c). It is not surprising that TMEM119 knockdown led to a significant decrease in the levels of anti-apoptotic (Bcl2)28 and an increase in pro-apoptotic (caspase-8 and caspase-9)29 proteins (Figure 4d). These data suggest that the anti-proliferation effect of TMEM119 siRNA on osteosarcoma cells may occur through inhibition of the G1/S cell cycle transition and induction of apoptosis.
Figure 4.
Suppressing TMEM119 expression induces G0/G1-phase arrest and apoptosis in osteosarcoma cells. (a) U2OS and MG63 cells cultured in 6-well plated were transfected with the indicated siRNA, and the cells were collected 48 h later. Cell cycle distribution was analyzed by PI staining and flow cytometry. (b) Protein levels of cell cycle-related proteins (PCNA, CDC25A and CDK1) in osteosarcoma cell lines were detected by western blotting. (c) Apoptosis was analyzed by Annexin V/PI staining. (d) Levels of apoptosis-related proteins (caspase-9, caspase-8 and Bcl2) were detected by western blotting. The experiments were repeated at least three times with similar results. ***P<0.001.
Silencing of TMEM119 suppresses the tumorigenesis of osteosarcoma cells in vivo
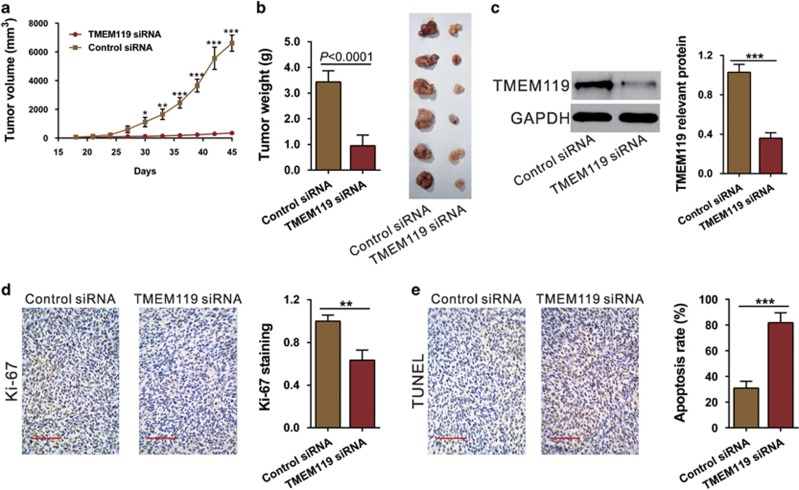
To determine the growth inhibitory effects of TEMEM119 siRNA in vivo, a xenograft tumor model was established via subcutaneous injection of U2OS cells into nude mice followed by treatment with TMEM119 siRNA or control siRNA. Compared with the control siRNA-treated group, TMEM119 siRNA treatment significantly slowed the tumor growth rate (Figure 5a) and reduced tumor weight by 72.4% at 45 days after inoculation (Figure 5b). Western blot analysis showed that TMEM119 siRNA treatment led to a significant decreased in TMEM119 expression in xenografts (Figure 5c). Furthermore, IHC staining and the TUNEL assay demonstrated that TMEM119 siRNA treatment caused a significant decrease in Ki67-positive cells (Figure 5d) and a notable increase in apoptotic cells (Figure 5e), respectively. These results confirm the above in vitro data that TMEM119 siRNA exerts a significant proliferation-inhibiting effect on osteosarcoma cells.
Figure 5.
Knockdown of TMEM119 in osteosarcoma cells suppresses tumor growth in vivo. (a) U2OS cells were subcutaneously injected in athymic nude mice. Tumor volume was measured for 45 days after TMEM119 siRNA or control siRNA injection (n=6). *P<0.05, **P<0.01, ***P<0.001. (b) At day 45, the mice were euthanized, and xenografts were weighed (n=6, P<0.0001). (c) TMEM119 expression in xenografts from nude mice was determined by western blotting. The experiments were repeated at least three times with similar results. (d) Ki67 immunostaining and (e) the TUNEL assay were performed on the xenografts. Magnification: × 200, scale bars: 100 μm.
TMEM119 knockdown inhibits the migratory and invasive abilities of osteosarcoma cells
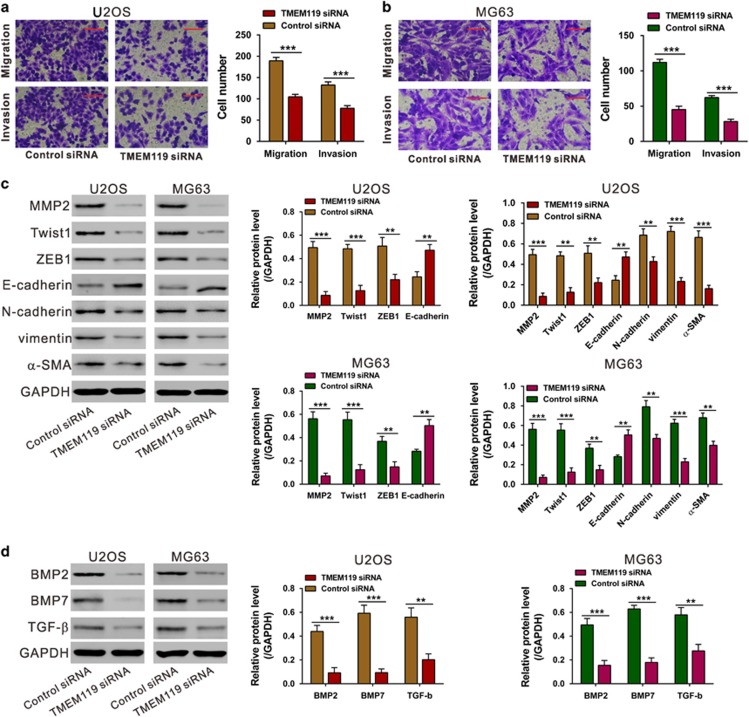
Metastasis is another essential hallmark of tumors. Considering that cell metastasis process was strongly associated with TMEM119-higher expression, we speculated that TMEM119 may have critical roles in the migratory and invasive abilities of osteosarcoma cells. U2OS and MG63 cells transfected with TMEM119 siRNA or control siRNA were cultured in non-Matrigel-coated and Matrigel-coated Boyden chambers, respectively. As shown in Figures 6a and b, after 24 h of incubation, cells transfected with TMEM119 siRNA showed a significant decrease in the number of migrated and invaded cells compared with the control siRNA-transfected cells. These results illustrate anti-metastatic effects of TMEM119 on osteosarcoma. In addition, a significant decrease in metastatic factors (MMP2, Twist1, ZEB1, vimentin, N-cadherin and α-SMA) but an increase in an anti-metastatic factor (E-cadherin) were observed in TMEM119-knockdown cells (Figure 6c).
Figure 6.
Silencing of TMEM119 inhibits the migration and invasion of osteosarcoma cells. (a, b) Migration and invasion assays were performed on siRNA-transfected U2OS (a) and MG63 cells (b). Magnification: × 200, scale bars: 100 μm. (c) Protein levels of metastasis-related proteins (MMP2, Twist1, ZEB1, E-cadherin, N-cadherin, vimentin and α-SMA) in osteosarcoma cell lines were detected by western blotting. (d) Protein levels of TGF-β pathway-related factors (BMP2, BMP7 and TGF-β) in U2OS and MG63 cells were detected by western blotting. The experiments were repeated at least three times with similar results. **P<0.01, ***P<0.001.
As indicated by GSEA analysis, TMEM119 expression was strongly associated with the TGF-β pathway (Figure 2d), which is well known to be involved in cell migration and invasion. The results presented in Figure 6d show that the protein levels of TGF-β pathway-related factors (BMP2, BMP7 and TGF-β) were also decreased in TMEM119 siRNA-transfected U2OS and MG63 cells.
The effects of TMEM119 on the migration and invasion of osteosarcoma cells are dependent on the TGF-β/BMP pathway
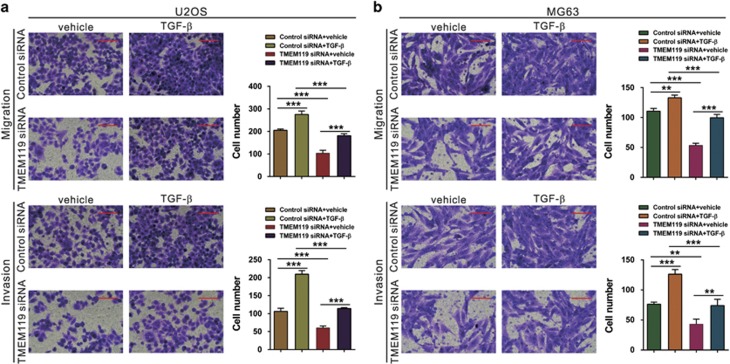
To investigate the functions of TGF-β in TMEM119 siRNA-inhibited cell migration and invasion, U2OS and MG63 cells silenced for TMEM119 were treated with TGF-β or vehicle (DMSO). As shown in Figures 7a and b, TGF-β exposure significantly promoted osteosarcoma cell migration and invasion and rescued the effects of TMEM119 siRNA.
Figure 7.
Exogenous TGF-β rescues the inhibitory effects of TMEM119 siRNA on cell migration and invasion. Cell migration and invasion assays were performed on siRNA-transfected U2OS (a) and MG63 (b) cells in a Boyden chamber containing either DMSO (vehicle) or 10 ng ml−1 TGF-β (Sigma). Magnification: × 200, scale bars: 100 μm. **P<0.01, ***P<0.001.
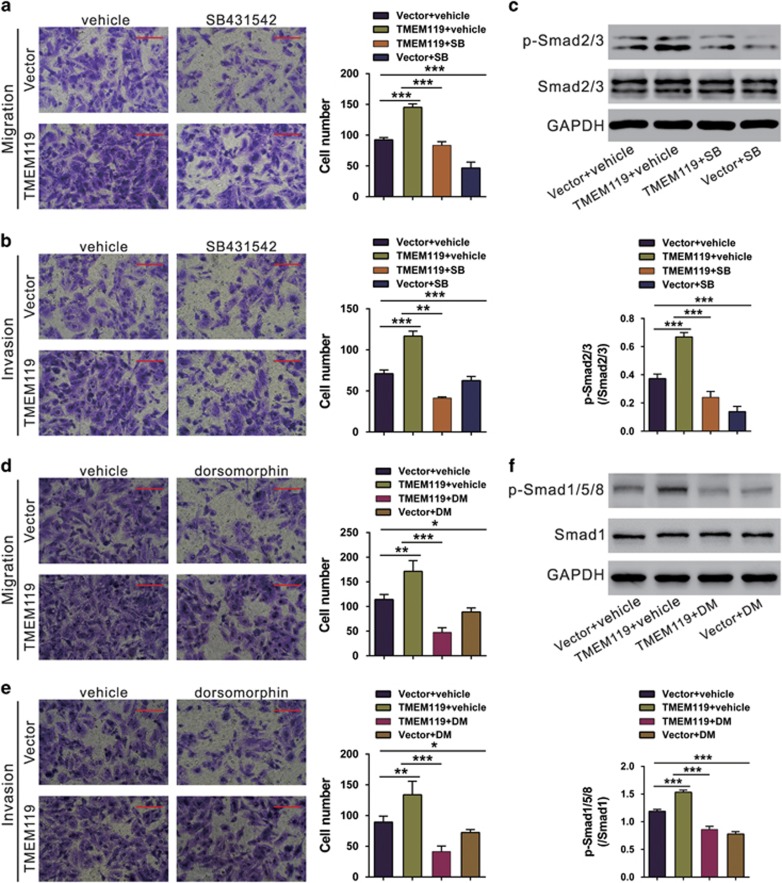
To further explore the involvement of TGF-β/BMP, Saos2 cells, which normally have low TMEM119 expression, overexpressing TMEM119 were treated with TGF-β inhibitor (SB431542) or BMP type I receptor inhibitor (dorsomorphin). TMEM119 overexpression significantly promoted migration and invasion, whereas SB431542 or dorsomorphin treatment had the reverse effects. Moreover, we detected the phosphorylation of Smad2/3 and Smad1/5/8 by western blotting. TMEM119 overexpression significantly increased the levels of p-Smad2/3 and p-Smad1/5/8, and such effects were impaired by SB431542 and dorsomorphin, respectively (Figure 8). These data indicate that TMEM119 may promote cell migration and invasion, at least partially by activating the TGF-β/BMP pathway.
Figure 8.
TGF-β inhibitor or BMP inhibitor impairs the effects of TMEM119 overexpression on migration and invasion. (a, b) Saos2 cells were infected with vector of the TRMEM119 lentivirus, and migration and invasion assays were performed in a Boyden chamber containing either DMSO (vehicle) or 10 μM SB431542 (SB; Sigma). Magnification: × 200, scale bars: 100 μm. (c) Phosphorylation of Smad2/3 was determined by western blotting. (d, e) Saos2 cells infected with vector of the TRMEM119 lentivirus, and migration and invasion assays were performed in a Boyden chamber containing either DMSO (vehicle) or 5 μM dorsomorphin (DM; Sigma). Magnification: × 200, scale bars: 100 μm. (f) Phosphorylation of Smad1/5/8 was determined by western blotting. The experiments were repeated at least three times with similar results. *P<0.05, **P<0.01, ***P<0.001 (n=3).
Discussion
TMEM119 belongs to the TMEM family, the members of which function as important regulators of carcinogenesis.8, 9, 10, 11, 12, 13, 14, 15, 16, 17, 18 TMEM119 has an important role in osteoblast differentiation by regulating the BMP2 pathway.21, 22, 23, 24 However, the expression and roles of TMEM119 in bone cancer remain unclear. In this study, we identified TMEM119 as a potential oncogene in osteosarcoma based on analysis of publicly available datasets and clinical subjects as well as in in vitro and in vivo functional experiments.
First, we analyzed the microarray data of a public available dataset (GSE42352) and found that TMEM119 was frequently up-regulated in osteosarcoma tissues compared with the normal osteoblasts, as confirmed by real-time PCR analyses on our own samples. Furthermore, we showed that the level of TMEM119 protein was strongly associated with tumor size, clinical stage, distant metastasis and overall survival time. These results reveal the potential prognostic value of TMEM119 in osteosarcoma. Next, GSEA analysis of TMEM119 indicated its association with cancer-related processes and pathways, including the cell cycle, apoptosis, metastasis and TGF-β signaling, which was further validated in osteosarcoma cells by functional assays and western blotting analysis. These results indicate that TMEM119 functions as an oncogene and may be a potential target in osteosarcoma gene therapy.
The epithelial–mesenchymal transition (EMT) is involved in the complex pathogenesis of tumors. In our study, TMEM119 knockdown caused increased expression of the main EMT factor (E-cadherin)30 and decreased the expression of EMT inducers (ZEB1,Twist, vimentin, N-cadherin and α-SMA).30 Our data suggest that TMEM119 siRNA may inhibit osteosarcoma cell invasion by suppressing EMT. TGF-β signaling has been implicated as a major induction signals of EMT,30 and several studies have liked TGF-β signaling to the progression of osteosarcoma. TGF-β1 is overexpressed in osteosarcoma tissues, and high-grade osteosarcomas have significantly higher expression of TGF-β1 than low-grade osteosarcomas.31 Evidence shows that TGF-β can stimulate the growth of cultured osteosarcoma cell lines.32, 33, 34 TMEM119 promotes osteoblast differentiation by regulating the BMP2 pathway.21, 22, 23, 24 We found that silencing TMEM119 expression significantly decreased the levels of TGF-β1, BMP2 and BMP7 proteins, and TGF-β exposure significantly rescued the inhibitory effects of TMEM119 siRNA on osteosarcoma cell migration and invasion. Furthermore, the promoting effects of TMEM119 overexpression on osteosarcoma cell migration and invasion were impaired by a TGF-β inhibitor (SB431542) or a BMP inhibitor (dorsomorphin). These findings suggest the involvement of the TGF-β/BMP pathway in the functions of TMEM119 in osteosarcoma.
In conclusion, the results presented here demonstrate that TMEM119 might be a useful prognostic factor for osteosarcoma. TMEM119 has strong effects on the growth, migration and invasion of osteosarcoma cells via regulation of cancer-related pathways, including TGF-β signaling.
Acknowledgments
This study was supported by grants from National Nature Science Foundation of China (No. 81402220).
Footnotes
Supplementary Information accompanies the paper on Experimental & Molecular Medicine website (http://www.nature.com/emm)
The authors declare no conflict of interest.
Supplementary Material
References
- Gill J, Ahluwalia MK, Geller D, Gorlick R. New targets and approaches in osteosarcoma. Pharmacol Ther 2013; 137: 89–99. [DOI] [PubMed] [Google Scholar]
- Ottaviani G, Jaffe N. The epidemiology of osteosarcoma. Cancer Treat Res 2009; 152: 3–13. [DOI] [PubMed] [Google Scholar]
- Haydon RC, Luu HH, He TC. Osteosarcoma and osteoblastic differentiation: a new perspective on oncogenesis. Clin Orthop Relat Res 2007; 454: 237–246. [DOI] [PubMed] [Google Scholar]
- Thomas D, Kansara M. Epigenetic modifications in osteogenic differentiation and transformation. J Cell Biochem 2006; 98: 757–769. [DOI] [PubMed] [Google Scholar]
- Tan ML, Choong PF, Dass CR. Osteosarcoma: conventional treatment vs. gene therapy. Cancer Biol Ther 2009; 8: 106–117. [DOI] [PubMed] [Google Scholar]
- Bakhshi S, Radhakrishnan V. Prognostic markers in osteosarcoma. Expert Rev Anticancer Ther 2010; 10: 271–287. [DOI] [PubMed] [Google Scholar]
- Guise TA, O'Keefe R, Randall RL, Terek RM. Molecular biology and therapeutics in musculoskeletal oncology. J Bone Joint Surg Am 2009; 91: 724–732. [DOI] [PMC free article] [PubMed] [Google Scholar]
- Cheng Z, Guo J, Chen L, Luo N, Yang W, Qu X. Overexpression of TMEM158 contributes to ovarian carcinogenesis. J Exp Clin Cancer Res 2015; 34: 75. [DOI] [PMC free article] [PubMed] [Google Scholar]
- Cuajungco MP, Podevin W, Valluri VK, Bui Q, Nguyen VH, Taylor K. Abnormal accumulation of human transmembrane (TMEM)-176A and 176B proteins is associated with cancer pathology. Acta Histochem 2012; 114: 705–712. [DOI] [PMC free article] [PubMed] [Google Scholar]
- Doolan P, Clynes M, Kennedy S, Mehta JP, Germano S, Ehrhardt C et al. TMEM25, REPS2 and Meis 1: favourable prognostic and predictive biomarkers for breast cancer. Tumour Biol 2009; 30: 200–209. [DOI] [PubMed] [Google Scholar]
- Guo J, Chen L, Luo N, Yang W, Qu X, Cheng Z. Inhibition of TMEM45A suppresses proliferation, induces cell cycle arrest and reduces cell invasion in human ovarian cancer cells. Oncol Rep 2015; 33: 3124–3130. [DOI] [PubMed] [Google Scholar]
- Hrasovec S, Hauptman N, Glavac D, Jelenc F, Ravnik-Glavac M. TMEM25 is a candidate biomarker methylated and down-regulated in colorectal cancer. Dis Markers 2013; 34: 93–104. [DOI] [PMC free article] [PubMed] [Google Scholar]
- Li B, Huang MZ, Wang XQ, Tao BB, Zhong J, Wang XH et al. TMEM140 is associated with the prognosis of glioma by promoting cell viability and invasion. J Hematol Oncol 2015; 8: 89. [DOI] [PMC free article] [PubMed] [Google Scholar]
- Ou D, Yang H, Hua D, Xiao S, Yang L. Novel roles of TMEM100: inhibition metastasis and proliferation of hepatocellular carcinoma. Oncotarget 2015; 6: 17379. [DOI] [PMC free article] [PubMed] [Google Scholar]
- Qiao W, Han Y, Jin W, Tian M, Chen P, Min J et al. Overexpression and biological function of TMEM48 in non-small cell lung carcinoma. Tumour Biol 2016; 37: 2575–2586. [DOI] [PubMed] [Google Scholar]
- Qiu G, Sun W, Zou Y, Cai Z, Wang P, Lin X et al. RNA interference against TMEM97 inhibits cell proliferation, migration, and invasion in glioma cells. Tumour Biol 2015; 36: 8231–8238. [DOI] [PubMed] [Google Scholar]
- Wrzesiński T, Szelag M, Cieślikowski WA, Ida A, Giles R, Zodro E et al. Expression of pre-selected TMEMs with predicted ER localization as potential classifiers of ccRCC tumors. BMC Cancer 2015; 15: 1. [DOI] [PMC free article] [PubMed] [Google Scholar]
- Zhou X, Popescu NC, Klein G, Imreh S. The interferon-alpha responsive gene TMEM7 suppresses cell proliferation and is downregulated in human hepatocellular carcinoma. Cancer Genet Cytogenet 2007; 177: 6–15. [DOI] [PMC free article] [PubMed] [Google Scholar]
- Kanamoto T, Mizuhashi K, Terada K, Minami T, Yoshikawa H, Furukawa T. Isolation and characterization of a novel plasma membrane protein, osteoblast induction factor (obif), associated with osteoblast differentiation. BMC Dev Biol 2009; 9: 70. [DOI] [PMC free article] [PubMed] [Google Scholar]
- Mizuhashi K, Chaya T, Kanamoto T, Omori Y, Furukawa T. Obif, a Transmembrane protein, is required for bone mineralization and spermatogenesis in mice. PLoS ONE 2015; 10: e0133704. [DOI] [PMC free article] [PubMed] [Google Scholar]
- Mizuhashi K, Kanamoto T, Ito M, Moriishi T, Muranishi Y, Omori Y et al. OBIF, an osteoblast induction factor, plays an essential role in bone formation in association with osteoblastogenesis. Dev Growth Differ 2012; 54: 474–480. [DOI] [PubMed] [Google Scholar]
- Hisa I, Inoue Y, Hendy GN, Canaff L, Kitazawa R, Kitazawa S et al. Parathyroid hormone-responsive Smad3-related factor, Tmem119, promotes osteoblast differentiation and interacts with the bone morphogenetic protein-Runx2 pathway. J Biol Chem 2011; 286: 9787–9796. [DOI] [PMC free article] [PubMed] [Google Scholar]
- Tanaka K, Inoue Y, Hendy GN, Canaff L, Katagiri T, Kitazawa R et al. Interaction of Tmem119 and the bone morphogenetic protein pathway in the commitment of myoblastic into osteoblastic cells. Bone 2012; 51: 158–167. [DOI] [PubMed] [Google Scholar]
- Tanaka K, Kaji H, Yamaguchi T, Kanazawa I, Canaff L, Hendy GN et al. Involvement of the osteoinductive factors, Tmem119 and BMP-2, and the ER stress response PERK-eIF2alpha-ATF4 pathway in the commitment of myoblastic into osteoblastic cells. Calcif Tissue Int 2014; 94: 454–464. [DOI] [PubMed] [Google Scholar]
- Zhang Q, Xiao XH, Li M, Li WH, Yu M, Zhang HB et al. Chromium-containing traditional Chinese medicine, Tianmai Xiaoke Tablet improves blood glucose through activating insulin-signaling pathway and inhibiting PTP1B and PCK2 in diabetic rats. J Integr Med 2014; 12: 162–170. [DOI] [PubMed] [Google Scholar]
- Subramanian A, Tamayo P, Mootha VK, Mukherjee S, Ebert BL, Gillette MA et al. Gene set enrichment analysis: a knowledge-based approach for interpreting genome-wide expression profiles. Proc Natl Acad Sci USA 2005; 102: 15545–15550. [DOI] [PMC free article] [PubMed] [Google Scholar]
- Reed SI. Control of the G1/S transition. Cancer Surv 1997; 357: 6–6. [PubMed] [Google Scholar]
- Yang J, Liu X, Bhalla K, Kim CN, Ibrado AM, Cai J et al. Prevention of apoptosis by Bcl-2: release of cytochrome c from mitochondria blocked. Science 1997; 275: 1129–1132. [DOI] [PubMed] [Google Scholar]
- Cohen GM. Caspases: the executioners of apoptosis. Biochem J 1997; 326: 1–16. [DOI] [PMC free article] [PubMed] [Google Scholar]
- Yang J, Weinberg RA. Epithelial–mesenchymal transition: at the crossroads of development and tumor metastasis. Dev Cell 2008; 14: 818–829. [DOI] [PubMed] [Google Scholar]
- Franchi A, Arganini L, Baroni G, Calzolari A, Capanna R, Campanacci D et al. Expression of transforming growth factor beta isoforms in osteosarcoma variants: association of TGF beta 1 with high-grade osteosarcomas. J Pathol 1998; 185: 284–289. [DOI] [PubMed] [Google Scholar]
- Pfeilschifter J, D'Souza SM, Mundy GR. Effects of transforming growth factor-beta on osteoblastic osteosarcoma cells. Endocrinology 1987; 121: 212–218. [DOI] [PubMed] [Google Scholar]
- Kloen P, Jennings CL, Gebhardt MC, Springfield DS, Mankin HJ. Expression of transforming growth factor-beta (TGF-beta) receptors, TGF-beta 1 and TGF-beta 2 production and autocrine growth control in osteosarcoma cells. Int J Cancer 1994; 58: 440–445. [DOI] [PubMed] [Google Scholar]
- Matsuyama S, Iwadate M, Kondo M, Saitoh M, Hanyu A, Shimizu K et al. SB-431542 and Gleevec inhibit transforming growth factor-beta-induced proliferation of human osteosarcoma cells. Cancer Res 2003; 63: 7791–7798. [PubMed] [Google Scholar]
Associated Data
This section collects any data citations, data availability statements, or supplementary materials included in this article.


