

Our results integrate a new method for human subthalamic recordings with a development of an advanced mathematical model. We found that while monopolar microelectrode and macroelectrode recordings detect field potentials that are considerably affected by common (probably cortical) activity, bipolar macroelectrode recordings inside the subthalamic nucleus (STN) detect locally generated potentials that are significantly different than those recorded outside the STN. Differential bipolar subthalamic field potentials can be used in navigation and closed-loop deep brain stimulation paradigms.
Keywords: deep brain stimulation, neurophysiological navigation, bipolar recordings, microelectrode recordings, macroelectrode recordings
Abstract
Subthalamic nucleus field potentials have attracted growing research and clinical interest over the last few decades. However, it is unclear whether subthalamic field potentials represent locally generated neuronal subthreshold activity or volume conductance of the organized neuronal activity generated in the cortex. This study aimed at understanding of the physiological origin of subthalamic field potentials and determining the most accurate method for recording them. We compared different methods of recordings in the human subthalamic nucleus: spikes (300–9,000 Hz) and field potentials (3–100 Hz) recorded by monopolar micro- and macroelectrodes, as well as by differential-bipolar macroelectrodes. The recordings were done outside and inside the subthalamic nucleus during electrophysiological navigation for deep brain stimulation procedures (150 electrode trajectories) in 41 Parkinson’s disease patients. We modeled the signal and estimated the contribution of nearby/independent vs. remote/common activity in each recording configuration and area. Monopolar micro- and macroelectrode recordings detect field potentials that are considerably affected by common (probably cortical) activity. However, bipolar macroelectrode recordings inside the subthalamic nucleus can detect locally generated potentials. These results are confirmed by high correspondence between the model predictions and actual correlation of neuronal activity recorded by electrode pairs. Differential bipolar macroelectrode subthalamic field potentials can overcome volume conductance effects and reflect locally generated neuronal activity. Bipolar macroelectrode local field potential recordings might be used as a biological marker of normal and pathological brain functions for future electrophysiological studies and navigation systems as well as for closed-loop deep brain stimulation paradigms.
NEW & NOTEWORTHY Our results integrate a new method for human subthalamic recordings with a development of an advanced mathematical model. We found that while monopolar microelectrode and macroelectrode recordings detect field potentials that are considerably affected by common (probably cortical) activity, bipolar macroelectrode recordings inside the subthalamic nucleus (STN) detect locally generated potentials that are significantly different than those recorded outside the STN. Differential bipolar subthalamic field potentials can be used in navigation and closed-loop deep brain stimulation paradigms.
subthalamic nucleus (STN) deep brain stimulation (DBS) is a common treatment for advanced Parkinson’s disease, other movement disorders (Benabid et al. 1998; Deuschl et al. 2006; Follett et al. 2010) and mental disorders (Mallet et al. 2008; Ostrem et al. 2011; Schjerling et al. 2013). Electrophysiological recordings during DBS procedures that are usually based on spiking activity enable target validation (Benazzouz et al. 2002; Moran et al. 2006; Sterio et al. 2002). Many studies have correlated STN local field potentials (LFPs) to a variety of brain functions and pathological states (Little and Brown 2014). Recently it has been suggested that the LFP could serve as a biological marker to direct closed-loop STN stimulations (Little and Brown 2012; Neumann et al. 2016; Priori et al. 2013).
LFPs summarize numerous potential neural sources and therefore are more difficult to interpret than spikes (Einevoll et al. 2013). Whereas single-unit recordings can detect spikes within 0.1 mm of the electrode, cortical LFP recordings appear to represent activity over longer ranges (0.1–5 mm in the horizontal plane and up to 10 mm in the vertical plane) (Kajikawa and Schroeder 2011). The radius of the detected LFPs is influenced by the electrode geometry and the recording configuration such as reference location, impedance of the electrode, and amplifier (Nelson et al. 2008). Computational models of cortical LFPs suggest that the area that generates LFP depends on neuron morphology, the synapse distribution, the correlation in synaptic activity, and the strength of the source of the neuronal signal (Lindén et al. 2011). Localization of LFP generators in the deep structures of the brain is challenging since these regions are less organized than the cortex.
The location of the generator of the LFPs and the spatial reach of STN LFPs are not clear. LFP recordings are largely influenced by the distance between the active electrode and the reference electrode. The origin of STN LFPs might be one of two phenomena or a combination of these options. First, STN LFPs may represent locally (nearby) generated neuronal activity within the STN (Kühn et al. 2004, 2005). Alternatively, STN LFPs might be volume conducted from the spherical shell dipole generated by the organized and synchronized activity of the cortex (Wennberg and Lozano 2003).
We tested different methods of human STN recordings during DBS procedures. In addition to monopolar microelectrode and macroelectrode recordings (Winestone et al. 2012) we used a new probe with two macroelectrode contacts that enables differential LFP recordings. We analyzed the spatial-spectral characterization of spikes and LFPs recorded both outside the STN (white matter) and inside the STN (gray matter). Finally, we verified and used a mathematical model of the different components (nearby vs. common) of the recorded neuronal signal.
METHODS
Patients.
Electrophysiological activity in Parkinson’s disease patients (n = 41; 17 women, 24 men) undergoing STN DBS was recorded and analyzed. All patients met the accepted inclusion criteria for DBS surgery. This study was authorized and supervised by the IRB of Hadassah Medical Center (reference code: 0168-10-HMO). All participants gave written, informed consent. All recordings were performed while the patients were awake, at rest, and off medications (overnight washout).
Electrophysiological recordings.
Two types of electrodes were used in this study. The first electrode is illustrated in Fig. 1A (Neuroprobe, AlphaOmega Engineering, Nazareth, Israel). Both the microelectrode tip and macroelectrode contact record spikes and LFP activity. The second electrode is illustrated in Fig. 1B (Tripolar Neuroprobe, AlphaOmega Engineering). This electrode has two macro contacts above the microelectrode tip. This electrode enables bipolar differential LFP recordings, obtained by subtraction of the signal recorded from the lower electrode from the signal recorded from the upper electrode. The surface areas of the electrodes are 80–550 µm2 (80–550×10−6 mm2) for the microelectrode tip; 0.9500–1.3019 mm2 for the Neuroprobe macroelectrode contact; 0.7841–1.0857 mm2 for the Tripolar Neuroprobe distal macroelectrode contact; 0.8935–1.3402 mm2 for the Tripolar Neuroprobe proximal macroelectrode contact. The reference (ground) is the guide, ending 25 mm above the estimated DBS target for the microelectrode recordings.
Fig. 1.

Monopolar and bipolar macroelectrodes. A: a microelectrode and one macroelectrode contact (Neuroprobe, AlphaOmega Engineering, Nazareth, Israel). The electrode consists of a concentric external polyamide-coated stainless steel cannula. The bottom of the stainless steel cannula is the noninsulated macroelectrode contact (1 mm (+0.5/−0.2 mm) length and 0.56 mm diameter). The internal tungsten microelectrode with a 25- to 50-µm tip protrudes centrally a further 3 ± 0.5 mm past the noninsulated macroelectrode. B: a microelectrode and two macroelectrode contacts (Tripolar Neuroprobe, AlphaOmega Engineering, Nazareth, Israel). In this electrode, each macroelectrode contact is 0.5 ± 0.1 mm in length. The first macroelectrode is located 3 ± 0.5 mm above the microelectrode tip with a 0.48-mm diameter and the second electrode is located 4 ± 0.5 mm above the microelectrode tip with a 0.71-mm diameter.
For both types of electrodes, a setup with two parallel electrodes separated by 2 mm in each STN trajectory was employed. The two electrodes were inserted into a five-hole Bengun and advanced simultaneously in the vertical dimension. The typical distance between the vertical recording sites before entry to the STN was 200–400 µm. The typical distance between recording sites within the STN was 100 µm. Areas with smaller numbers of recording sites were postoperatively interpolated to the maximal number of recording sites. This enabled a unified number of recording sites along the trajectory for further population analysis.
Surgery planning and electrophysiological navigation.
The surgical technique is described elsewhere (Zaidel et al. 2009). During the surgery, the boundaries and the subdomains of the target nucleus were verified by electrophysiological recordings of the spiking activity.
Data acquisition.
The microelectrodes typically had an impedance of 0.3–0.7 MΩ measured at 1 kHz at the beginning of each trajectory. The macroelectrodes had an impedance of 3–8 kΩ at 1 kHz. We assess the impedance of both microelectrodes and macroelectrodes at 1 kHz since we use the macroelectrodes both for recording of LFPs and spikes (300–6,000 Hz). Although there are small differences between the impedances of the two macroelectrode contacts in the Tripolar electrode, they have only a minimal effect on the common mode rejection ratio of the recording system. The input impedance values of the NeuroOmega amplifier equal 100 GΩ || 2 pF and the input impedance are 80 MΩ and 2.66 GΩ at 1,000 and 30 Hz, respectively. Both the raw and spiking signal were amplified by 20, sampled at 44 kHz by a 16-bit A/D converter (using ± 1.25 V input range; i.e., ∼0.38 µV amplitude resolution). The spiking signal was band-passed from 300 to 9,000 Hz using a hardware four-pole Butterworth filter. The raw signal was band-passed from 0.7 to 9,000 Hz using a hardware four-pole Butterworth filter and sampled as above. The LFP signal was offline band-passed filtered from the raw band in the range of 3–100 Hz by a four-pole Butterworth filter.
Analysis.
The multiunit (spiking) activity and LFP activity were first downsampled to 22 kHz to lower the computational labor. After downsampling, microelectrode spiking recordings were used to automatically detect the STN boundaries and motor area based on a hidden Markov model algorithm (Moran et al. 2006; Zaidel et al. 2009). The root mean square (RMS) of the multiunit activity was normalized by the RMS of the activity in the white matter before entry into the STN. The power spectral density (PSD) was calculated after rectification of the high-passed signal by the absolute operator followed by subtraction of the mean. The rectified signal allowed detection of tremor and beta frequencies (below the lower boundary of the spike band-passed filter). The PSD was calculated by the pwelch method (Welch 1967), with a Hamming window of 1 s and an nfft of 44,000 (2 s for a sampling rate of 22 KHz, at a frequency resolution of 0.5 Hz) and 50% overlap. The PSD was normalized by the average power of frequencies in the 4- to 200-Hz range (the 4-Hz cutoff was introduced because lower frequencies sense more noise). The LFP PSD was calculated with the same parameters used in the spiking signal [pwelch method with a Hamming window of 1 s with a 50% overlap and an nfft of 44,000 (2 s), yielding a frequency resolution of 0.5 Hz].
Artifacts and surrounding samples were removed from analysis. Artifacts for microelectrode and macroelectrode recordings were defined as sharp increases greater than the standard deviation of the signal of 7- and 12-fold, respectively. These thresholds were determined by visual inspection of the best fit to each of the signal types.
Population statistics are given as the median and standard error of median (median absolute deviation divided by the root of the number of samples) unless otherwise noted. After the median power as a function of frequency for all the trajectories was calculated in the LFP signals, the median power of the LFP signal was 1/F corrected by multiplying each power by its frequency for clearer insights into the higher frequencies. The power phenomena behave as 1/Falpha. However, our estimates of alpha were inconsistent for the different recording types and areas; therefore all signals were corrected with alpha equals 1.
Coherence analysis (between pairs of electrodes separated by 2-mm distance) was performed using a magnitude squared coherence function (Kay 1988) with a Hamming window of 1 s, an nfft of 44,000, and a 50% overlap. For the spiking activity, coherence was performed after rectification with the absolute operator.
Trajectory selection and definition of the entry into the STN.
The spiking activity (300–9,000 Hz) detected by microelectrodes was used to define the entry into the STN along the dorsolateral-ventromedial axis of the STN (“depth”). The entrance to the STN was automatically defined by a hidden Markov model (Zaidel et al. 2009). The entry point to the STN was adjusted for each of the recording types according to the contact location, i.e., the macroelectrode distal contacts enter the STN 3 mm beyond the microelectrode tips.
Of the 41 Parkinson’s disease patients recruited for this study, 36 patients (67 STNs, 134 trajectories) were recorded with the regular Neuroprobe (one macroelectrode contact above the microelectrode tip) and 5 patients (8 STNs, 16 trajectories) were recorded with the Tripolar Neuroprobe (two macroelectrode contacts above the microelectrode tip). Thus we analyzed 150 trajectories with microelectrode recordings, 134 trajectories with monopolar macroelectrode recordings from the regular electrode, 32 trajectories with monopolar macroelectrode recording from the Tripolar electrode, and 16 trajectories with bipolar macroelectrode recordings.
Criteria for trajectory selection were as follows: 1) microelectrode spiking activity recorded by the regular Neuroprobe: only trajectories that had a beta-oscillatory span of at least 3 mm on the dorsolateral-ventromedial axis of the STN as detected by microelectrode spiking activity were included (56 of 150 for the microelectrode tip); 2) macroelectrode activity recorded by the regular Neuroprobe: only trajectories that had a beta-oscillatory spiking activity span of at least 3 mm on the dorsolateral-ventromedial axis of the STN and at least 5.5 mm after the microelectrode entry into the STN were included in the macroelectrode analysis (48 of 134 for the macroelectrode contacts); 3) recordings by the Tripolar electrode: only trajectories that had at least 5.5 mm after the microelectrode entry into the STN were included in the bipolar analysis (11 of 16).
The 32 trajectories with monopolar macroelectrodes from the Tripolar electrodes (8 patients, 16 STNs, 32 trajectories) were analyzed separately and yielded similar results to the regular monopolar macroelectrode (data not shown). For the coherence and correlation analysis of parallel electrodes we used all 134 regular electrode trajectories for the macroelectrode and the overall 150 electrode trajectories for the microelectrode (we included only parallel electrodes that had recordings in all three conditions: both electrodes outside STN; one electrode outside and one electrode inside the STN; both electrodes inside the STN).
Theoretical estimation of the nearby independent vs. nonnearby common activity.
The outside-inside correlation was defined as the correlation between the signal recorded from a pair of electrodes when one electrode is in the white matter before entry into the STN (“outside”) and the other electrode is in the STN (“inside”). The outside-inside correlation can be predicted from two correlation measures: 1) when both electrodes are in the white matter before the STN (outside); 2) when both electrodes are inside the STN (inside).
The correlation signal of two electrodes that share a common input signal and have independent activity is defined as follows:
| (1) |
where C represents the common input of the electrodes. This common input includes many sources, such as the volume-conducted cortical dipole, the STN dipole, and the shared intersected field of the electrodes. Ind1 and Ind2 represent the nearby independent input of electrodes number 1 and number 2, respectively. Ind1 and Ind2 are not correlated (independent) by definition; therefore the covariance of Ind1, Ind2, is zero. We assume that C and Ind are not correlated and therefore Var(C+Ind) = Var(C)+Var(Ind).
Different regions and different pathway in the STN might have different effects, even within the motor domain of the STN. Nevertheless we found that the population normalized RMS (nRMS) of microelectrode spiking is similar for the central electrodes (n = 61) and the anterior electrodes (n = 50) when both are outside or inside the STN. Therefore, we assume that when both electrodes are outside the STN or both electrodes are inside the STN, the variance of Ind1 is the same as the variance of Ind2 because the recordings are in the same brain tissue: Var(Ind1) = Var(Ind2) = Var(Ind). Therefore, the correlation equation can be expressed as follows:
| (2) |
We use Eq. 2 twice: when both electrodes are outside the STN and when both electrodes are inside the STN, using Indoutside and Indinside to denote the nearby activity inside and outside the STN. We further simplify the model by neglecting the contribution of the STN dipole when one electrode is outside the STN and the second electrode is inside the STN by the assumption Var(Coutside) = Var(Cinside) = Var(C). This is probably correct because most of the common activity is volume conducted from the cortex (EEG), and over the small distance used here (6 mm movements, ~80–90 mm distance from the cortex in the common STN trajectory path) the small differences in the intensity of this common signal can be neglected. We then write the inside-outside correlation equation as follows:
| (3) |
From Eq. 2 we can substitute the cases of both electrodes outside the STN and both electrodes inside the STN into Eq. 3 to predict the correlation in the case of one electrode outside the STN and the other electrode inside the STN.
| (4) |
Equation 4 can be further simplified to
The predictions (Eq. 4) were used both for the coherence (correlation as a function of frequency) and for the time-domain cross correlation function at lag zero (c.l.z). We quantified the correspondence between the observed data and the single predicted c.l.z values using linear regression analysis. The goodness of fit between the observed “outside-inside” and predicted “outside-inside” c.l.z was evaluated by calculating their Pearson’s product-moment correlation coefficient, denoted c.c.
The coherence values and the c.l.z values are in the range of zero to one. To overcome the distortion of this truncated range, we transformed the correlation values by Fisher's Z-transform (Eq. 5), calculated the population statistics, and retransformed the population Z-transformed values back to values in the range of zero to one by the inverse Fisher Z-transform (Eq. 6) (Sokal and Rohlf 1995).
| (5) |
| (6) |
ln(˚) is the natural logarithm.
Estimation of the ratio of the common signal and the nearby signal recorded by each recording configuration can be derived from Eq. 2:
| (7) |
We used Eq. 7 twice: when both electrodes are outside the STN and when both electrodes are inside the STN. Dividing the ratio of the above cases (both electrodes outside the STN, both electrodes inside the STN) yields the ratio of Var(Indinside)/Var(Indoutside).
All analyses were carried out on custom-made code using MATLAB version 2007b (MathWorks, Natick, MA).
RESULTS
We recorded 150 electrode trajectories from 41 patients undergoing STN DBS surgery for Parkinson’s disease. The STN and the preceding white matter were investigated by two recording electrodes in parallel trajectories separated by a horizontal distance of 2 mm. We analyzed the spatial and spectral features of the recordings from each electrode and the correlation, in both the time and frequency domains, of the activity between pairs of electrodes.
Different recording configurations in the white matter and inside the STN.
An example of one trajectory with parallel sets of the Tripolar Neuroprobe (two macro contacts above the microelectrode tip) is presented in Fig. 2. RMS and PSD analysis of the spiking activity (300–9,000 Hz) detected by microelectrodes and the entry into the STN are presented in Fig. 2, A and B. While the RMS clearly increased when the electrodes entered the STN (two to four times higher in the STN than in the preceding white matter in both electrodes), the relative beta oscillatory activity was less consistent. The first electrode showed increased beta activity (Fig. 2B, left) but the second (more anterior) electrode hardly evidenced any increase in beta activity (Fig. 2B, right).
Fig. 2.

An example of two Tripolar Neuroprobe recordings. A typical example of one trajectory with two Tripolar Neuroprobe electrodes moving simultaneously along the dorsolateral-ventromedial axis. The electrodes are separated horizontally by 2 mm: the left column is data recorded by the first electrode; the right column is data recorded by the second electrode (2 mm anterior to the first electrode). The depth indicates the location on the dorsolateral-ventromedial axis. The red line marks the entry to the STN. A: normalized root mean square (nRMS) of the spiking activity from the microelectrode recordings. The x-axis is the location along the dorsolateral-ventromedial axis starting 10 mm before the STN center (per imaging) and given as the estimated distance to target. The red line marks the automatic detection of entry into the STN based on the spiking activity of the microelectrode recordings. B: spectrograms of spiking activity from the microelectrode recordings after full wave rectification. C: spectrograms of LFP microelectrode recordings after 1/F (α = 1) correction. D: spectrograms of spiking activity recorded by the macroelectrode after full wave rectification. The red line marks the STN entry of the distal macroelectrode contact that was defined 3 mm after entry in the microelectrode. E: spectrograms of LFP macroelectrode recordings from the distal contact after 1/F (α = 1) correction. F: spectrograms of LFPs differential (Diff) bipolar macroelectrode recordings after 1/F (α = 1) correction. The red line marks the STN entry of the distal macroelectrode contact that was defined as 3 mm after entry in the microelectrode. The power is presented in 10log10 scale in all subplots. Freq, frequency.
The PSD of microelectrode LFP recordings (Fig. 2C) indicated increased low frequency (less than 15 Hz) activity in the white matter before entry into the STN and increased beta oscillatory activity in the dorsal STN in the first electrode (Fig. 2C, left). In the second electrode only slight changes in activity after entry into the STN could be detected (Fig. 2C, right).
The PSD of the spiking activity of the distal macroelectrode contact (located 3 mm above the tip) demonstrated a small change in beta activity in the dorsal STN in the first electrode and no change in activity in the dorsal STN in the second electrode (Fig. 2D).
The PSD of LFPs monopolar macroelectrode recordings showed a change in beta oscillatory activity in the dorsal STN ~1–2 mm after entry into the STN. These recordings demonstrated a strong power of the low-frequency activity in the white matter before entry into the STN that was not well differentiated from the activity inside the STN (Fig. 2E). Similar results were observed in the proximal macroelectrode (data not shown). However, the PSD of the LFPs of the bipolar macroelectrode recordings presented weak beta oscillatory activity that begins before entering STN, a pronounced change of activity ~1–2 mm after entry into the STN, and increased beta oscillatory activity in the dorsal STN (Fig. 2F).
Monopolar LFP recordings do not exclusively represent STN generated activity.
The population analysis of all 56 trajectories (115 contacts) is shown in Fig. 3. The population results were consistent with the example in Fig. 2. The upper image in each subplot shows the median PSD as a function of location along the trajectory (“depth”) and the lower image shows the average spectrum with its standard error of median from all the recording sites in the white matter before entry into to the STN (blue) and after entry into the STN (red). As mentioned above, the spiking activity detected by microelectrodes was used to define the entry point into the STN along the dorsolateral-ventromedial axis of the STN.
Fig. 3.

Power spectral density (PSD) along the trajectory and its average spectrum outside and inside the STN. Top row: median population spectrogram as a function of depth (the location on the dorsolateral-ventromedial axis). The depth “0” represents the entry to the STN on the dorsolateral-ventromedial axis of the STN. Bottom row: the median power spectrum in the white matter (WM) outside the STN (blue line with shadow, median ± standard error of median) and inside the STN (red line with shadow, median ± standard error of median). The depths taken for the median spectrum are marked in red (STN) and blue (WM) lines under the PSD. A: microelectrode spiking activity (n = 56) after full wave rectification as a function of location on the dorsolateral-ventromedial axis (3 mm before and after entering the STN. B: macroelectrode spiking activity (n = 48), conventions as in A: C: monopolar microelectrode LFP (n = 56). The power is 1/F corrected (α = 1). D: monopolar macroelectrode LFP (n = 48). The power is 1/F corrected (α = 1). E: bipolar-macroelectrode LFP recordings (n = 11). The power is 1/F corrected (α = 1). The average spectrum (lower row) was taken from depths of 1–2.5 mm after entry to the STN in B, D, and E.
The microelectrode spiking (Fig. 3A) demonstrated beta oscillatory activity after entry to the STN that did not exist before the STN. The spiking activity of the macroelectrode (Fig. 3B) also demonstrated increased beta power but to a lesser extent. In contrast to the spiking activity, significant LFP oscillatory activity (especially low-frequency activity) was recorded in the white matter before entry into the STN both by microelectrode and monopolar macroelectrode (Fig. 3, C and D). The maximal beta power in the STN was only higher by 48% than the maximal beta power in the white matter before the STN in both the microelectrode and monopolar macroelectrode LFP recordings. Thus the monopolar LFP activity in the STN was not very different from the activity recorded in the white matter before the STN and therefore did not necessarily represent STN-generated activity.
Differential macroelectrode LFP recordings are sensitive to beta oscillatory activity within the STN.
The differential LFP bipolar macroelectrode recordings (Fig. 3E) revealed a pronounced difference between recordings in the white matter outside the STN (before the STN) and recordings inside the STN (i.e., after entry into the STN). The maximal beta power in the STN was higher by 95% than the maximal beta power in the white matter before the STN. Thus the differential bipolar macroelectrode LFP activity revealed sensitive detection of nearby beta power inside the STN, similar to the detection of nearby beta activity in microelectrode spiking recordings.
We further compared the absolute and relative beta power (12–35 Hz) of bipolar macroelectrode LFPs recordings and the microelectrode spiking recordings (Fig. 4). We compared the z-score of the 12–35 Hz power of the bipolar macroelectrode LFPs in each of the 11 Tripolar electrodes and microelectrode spiking activity in 56 electrodes selected from the standard Neuroprobe. The mean and standard deviations for the z-scores were based on the recording sites 1 mm-3 mm before entry into the STN. This analysis revealed that while the relative beta power (12–35 Hz) of microelectrode spiking increased slightly (~3.5 fold), the relative beta power of bipolar macroelectrode LFPs increased significantly (~13 fold, Fig. 4B). The beta power of the monomacroelectrode LFP increases from 0 to 2.5 mm along the STN (Fig. 4B). Since the monomacroelectrode LFP increases along the STN, the closely spaced bipolar configuration is expected to show an elevated beta power. In fact, the beta power of the bipolar-macroelectrode LFP increases from 0 to 1.5 mm and decreases from 1.5 to 2.5 mm along the STN. Note that we recorded macroelectrode LFP only in the first 2.5 mm of the STN due to the geometrical limits of our recording system. The macrocontacts are 3 mm beyond the microelectrode tip and we have tried to avoid sharp electrode recording too deep after STN lower border (and possible entry to the Substantia Nigra pars Reticulata territory).
Fig. 4.
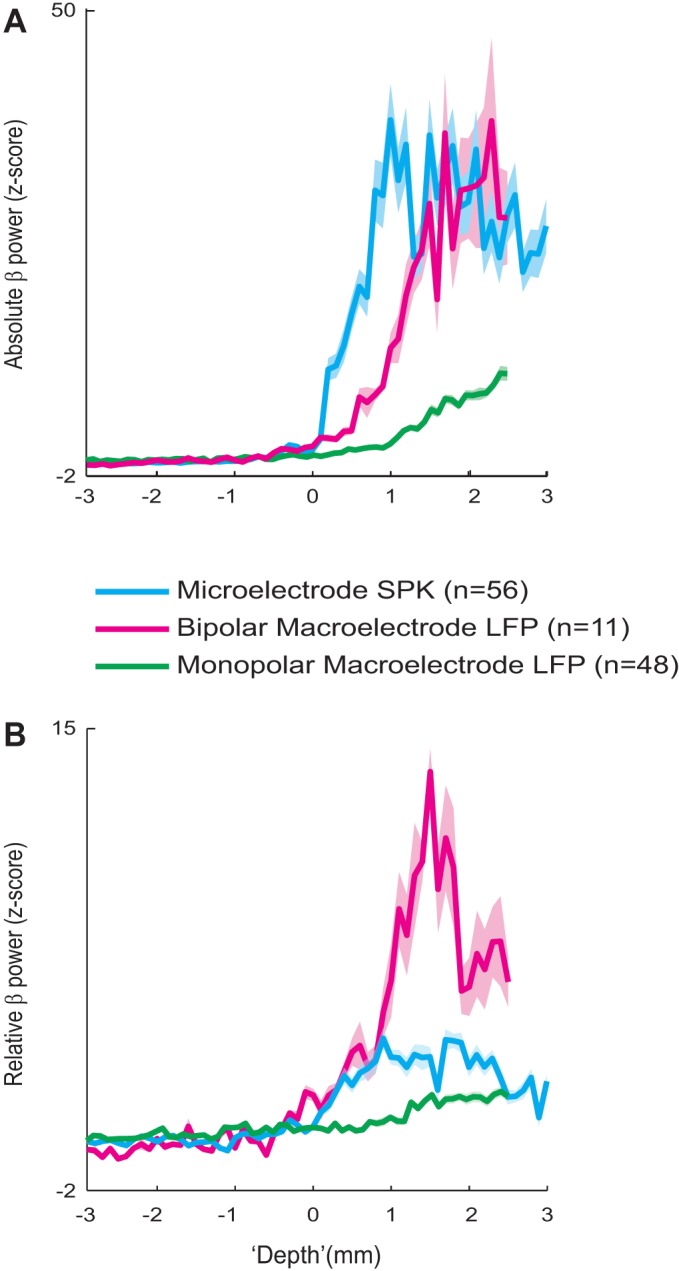
Average beta power (12–35 Hz) microelectrode spiking activity, monopolar macroelectrode LFPs, and bipolar macroelectrode LFPs along the STN trajectory. A: solid lines with shadow are the median ± standard error of median beta power along the STN trajectory 3 mm before and after entrance to the STN, of microelectrode spiking activity (n = 56), monopolar macroelectrode LFP (n = 48), and bipolar macroelectrode LFP (n = 11); 0 represents entry into the STN, automatically detected from the spiking activity of the microelectrode. The beta power was Z-scored by the activity of the recording locations before entering the STN (3 mm to 1 mm prior). The LFP signal is 1/F corrected with α = 1. B: relative (to the total power at each recording site) beta power along the STN trajectory. Same conventions as in A except normalization of the power by the averaged power of 1–200 Hz. The macroelectrode LFP signal was filtered in the range of 3–200 Hz.
We analyzed the change of power of distinct frequency bands as a function of location along the STN axis. The power of different frequency domains (theta, 4–7 Hz; alpha, 8–12 Hz; low-beta, 13–20 Hz; high-beta, 21–35 Hz; gamma 35–70 Hz) were not constant along the STN axis for both microelectrode SPKs and differential macroelectrode LFPs recordings (data not shown). Therefore, we decided to broad-band all beta (both high and low beta domains) into a combined power measure.
We further compared the detection of the entry point to the STN by the Tripolar macroelectrode LFPs to our existing method of microelectrode spiking recording. The calculated shift in the entry point to the STN was 3.23 ± 0.94 mm (mean ± standard deviation), which matched the distance between the microelectrode tip and the first macroelectrode contact (3.0 ± 0.5 mm).
LFP coherence is higher than spike coherence.
To better understand the factors contributing to the activity recorded in the white matter and inside the STN we further calculated the mean coherence between the two parallel recording electrodes (separated by a 2-mm horizontal distance). This coherence reflects the common input to the electrode that incorporates the far and shared field activity (including identical nearby activity).
Coherence was calculated between the two (micro or macro) electrodes in three conditions: 1) both electrodes were in the white matter outside the STN; 2) one electrode was outside the STN and the second electrode was inside the STN; 3) both electrodes were inside the STN. This analysis included only pairs of electrodes that had at least four recording sites in each of the three conditions.
As shown in Fig. 5, the mean coherence was higher in the macroelectrode recordings than in the microelectrode recordings. In all recording methods, the coherence when both electrodes were in the white matter before entering the STN (blue lines) was higher than the coherence when one or both electrodes were inside the STN (purple and red lines, respectively). In most recording configurations, the coherence when one electrode was outside the STN and the other was inside the STN was higher than the coherence when both electrodes were inside the STN. LFPs (Fig. 5, C and D) showed higher coherence than spikes (Fig. 5, A and B) both with macroelectrode and microelectrode recordings. The LFP coherence but not the spike coherence was inversely related to the frequency (Fig. 5, C and D); i.e., low frequencies, including the beta frequencies, showed higher coherence than high frequencies. Calculation of the mean coherence between the two adjacent macroelectrodes on the same electrode (in the Tripolar Neuroprobe, electrodes are separated by a 0.5-mm vertical distance) yielded similar results (data not shown).
Fig. 5.

Population coherence between two parallel recording electrodes. Mean coherence calculated between pairs of electrodes (separated by 2-mm horizontal distance) when both electrodes are in the white matter (WM) outside the STN (blue); one electrode is in the WM outside the STN and the second electrode is inside the STN (purple); both electrodes are inside the STN (red). The dashed black line is the prediction of the in-out configuration (derived from Eq. 4 in methods). Solid lines and shading represent the mean coherence ± standard error of mean, respectively. Outlier pairs of electrodes with artifacts were excluded. The number of trajectories with paired electrodes is given in each subplot. A: spike coherence recorded by microelectrodes. B: LFP coherence recorded by microelectrodes. C: spike coherence recorded by macroelectrodes. D: LFP coherence recorded by macroelectrodes.
The outside-inside correlation can estimate the proportion of nearby and nonnearby activity.
The coherence when one electrode was in the white matter before entering the STN (outside) and the other electrode was inside the STN (inside) can be predicted from the outside coherence and the inside coherence (See methods, Eq. 4). The predicted outside-inside coherences were plotted as the dashed black line in Fig. 5. The prediction matched the actual values in the macroelectrode spiking activity and the microelectrode LFP activity (Fig. 5, B and C) and closely approximated the macroelectrode LFP and the microelectrode spiking activity (Fig. 5, A and D).
In addition to the coherence that was calculated as a function of frequency, we calculated the cross-correlation function at lag zero (c.l.z.). We took only one value (at lag zero) out of the cross-correlation function to obtain one number for the predicted value and one number for the actual value for each pair of recordings. We plotted the predicted “outside-inside” correlation values against the actual correlation values (Fig. 6). Then we calculated the correlation coefficient (c.c.) between the predicted and actual values for all the pairs in each type of recording configuration to measure the goodness of fit of the prediction to the actual value. The prediction of the inside-outside correlation by the macroelectrode spiking activity, microelectrode LFPs, macroelectrode LFPs and microelectrode spiking were highly correlated with the actual values (R = 0.96, 0.919, 0.852, and 0.838, respectively, P < 0.001). In all recording configurations the prediction underestimated the actual values as represented by the slope of the regression line which was less than 1 (see solid black line for slope and dashed red line for slope = 1, Fig. 6). Whereas the prediction of the inside-outside correlation by the macroelectrode spiking activity and microelectrode LFPs provided a good estimate of the actual values (slope values 0.9 and 0.87, respectively; Fig. 6, B and C), the prediction by the macroelectrode LFPs and microelectrode spiking only approximately matched the actual values (slope values 0.8 and 0.83, respectively; Fig. 6, D and A). The divergent correlation prediction by different recording configurations is probably related to inaccurate theoretical assumptions concerning the inside-outside correlation (e.g., neglecting the common STN activity in the dorsolateral oscillatory region) (Moshel et al. 2013) and should be examined in future theoretical and experimental studies.
Fig. 6.

Predicted vs. actual outside-inside correlation values Each correlation (Cor) value is the average cross-correlation at lag zero (c.l.z.) values of all “WM-STN” recording locations from one trajectory. The WM-STN means the recording locations along the trajectory when one of the parallel electrodes is in the white matter outside the STN (WM) and the other is inside the STN (STN). The correlation coefficient (c.c.) values and the slopes were calculated after a Fisher Z-transform. The dashed red line is plotted to enable comparison of the regression line slope to slope = 1 line. A: microelectrode spiking activity. B: macroelectrode spiking activity. C: microelectrode LFPs. D: macroelectrode LFPs. In the inset the values are represented in Fisher Z-transform to enable a better stretch of the values (since the values are distorted by the truncated range). The number of trajectories with paired electrodes is given in each subplot. Outlier pairs of electrodes were excluded.
When we analyzed the coherence or correlation between two electrodes, the input of the recording electrodes in the STN consisted of nearby activity (independent activity, STN dipole, and part of the shared field activity) and nonnearby activity (cortical dipole and the other part of the shared field activity). The proportion of nearby and nonnearby activity was estimated by the change in variance of the neuronal activity outside and inside the STN. When the electrodes enter the STN the total (nearby and nonnearby) activity increases and the variance of the total activity increases (the root of the variance is represented in RMS; see Fig. 7A). Most of the increased variance inside the STN is attributed to the change in nearby activity. We further used the outside-inside correlation to estimate the ratio of the variances between independent and common activity inside and outside the STN (see Eq. 7 in methods). We first calculated the ratio of the variance of common activity to the variance of independent activity. Then we calculated the ratio of the variance of the independent activity outside and inside the STN that excluded the influence of the common activity and reflected purely nearby activity.
Fig. 7.
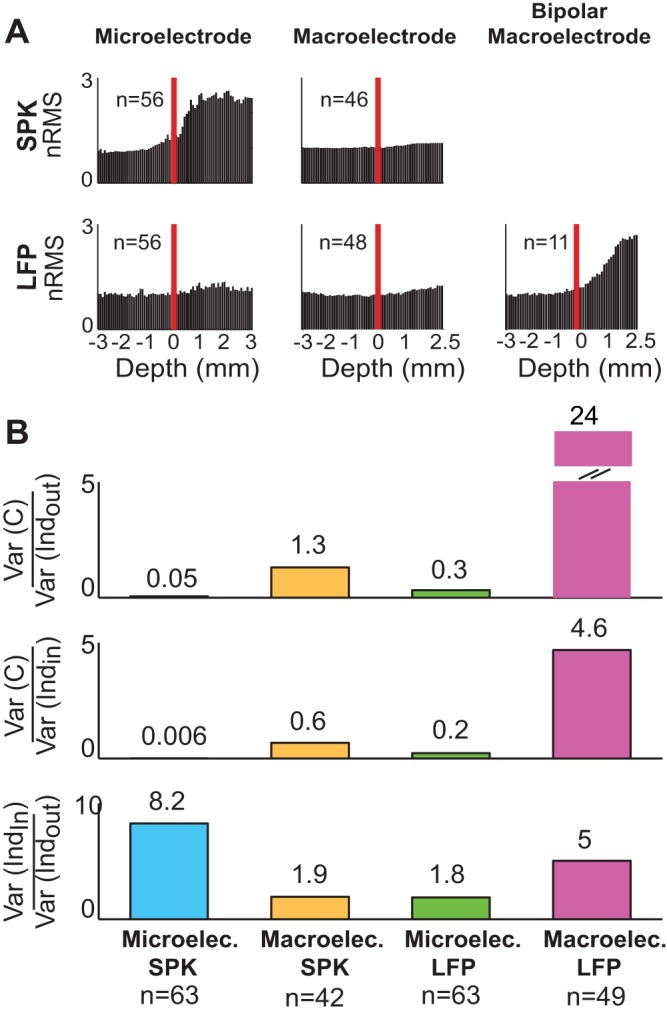
Population normalized root mean square (nRMS) and ratio of variance of common and nearby independent activity inside and outside the STN. A: mean nRMS of different recording configurations. The normalization is based on the average root mean square of 3 mm to 1 mm before entry into the STN. Red lines mark the entry into the STN. B: mean ratios of variance of common input [Var(C)], the nearby independent activity outside the STN [Var(Indout)] and the nearby independent activity inside the STN [Var(Indin)] in different recording configurations.
In the microelectrode spike recordings, the common activity was extremely low and the ratio of the variance of the common activity to the variance of independent activity was very low both inside and outside the STN (Fig. 7B, blue). As expected, the ratio of the variance of microelectrode spiking independent activity inside and outside the STN was high (Fig. 7B, third row, blue). Most of the change in the variance of microelectrode spiking activity inside the STN seen in the RMS plot (Fig. 7A) can therefore be attributed to the change in nearby activity.
In the macroelectrode LFP recordings, the variance (power) of the common activity was much higher than the independent activity. The ratio of the variance of common activity to variance of the independent activity was extremely high both outside and inside the STN (24 and 4.6, respectively; Fig. 7B, purple). The RMS plot of the monopolar macroelectrode LFP did not show a significant change of variance outside and inside the STN (Fig. 7A), probably because most of the LFP variance can be attributed to nonnearby activity. In contrast, the bipolar macroelectrode differential LFP recordings excluded the nonnearby activity and therefore the RMS plot showed a robust change in variance outside and inside the STN (Fig. 7A) that should probably be attributed to the change of nearby activity. Similarly, the ratio of the variance of macroelectrode differential LFP independent activity inside and outside the STN was high (Fig. 7B, two top rows, purple). Finally, in line with our previous analysis (Fig. 4) the ratio of the independent activity outside and inside the STN in the macroelectrode differential LFP recordings was higher than in the microelectrode spiking recordings (5 and 1.8, respectively; Fig. 7B, third row).
DISCUSSION
In this study we investigated the spatiospectral characterization of STN LFPs. Our results suggest that different modes of recording affect the features of the LFP signals. Monopolar LFPs exhibit a wide sampling area; i.e., they are strongly affected by remote (probably cortical) activity rather than nearby activity within the STN. Bipolar differential LFP recordings can overcome volume conductance effects and detect locally generated STN activity. Detection of nearby STN beta activity by bipolar macroelectrode LFP recordings was similar and even more robust to the detection by microelectrode spiking recordings. These findings highlight the interrelated physiological, technical, and clinical aspects of the human STN electrophysiological activity.
Nearby generated LFP activity inside the STN.
We assessed nearby LFP activity of the STN in two ways. We analyzed bipolar macroelectrode LFP recordings that were 0.5 mm apart along the dorsolateral-ventromedial axis of the STN. We assumed that subtraction of the recordings of adjacent electrodes would eliminate the joint and identical far field signals and would mainly reflect the nearby LFP activity. These bipolar macroelectrode LFP recordings clearly showed unique nearby LFP activity within the dorsolateral area of the STN (Fig. 3E) and a substantial power (variance) of this nearby LFP activity (Fig. 7A).
We also analyzed the coherence between the two parallel recording electrodes in the same STN trajectory. The coherence of macroelectrode LFP activity inside the STN was lower than the coherence outside the STN (Fig. 5D). This decreased coherence of macroelectrode LFP activity inside the STN probably represents a higher degree of specific neuronal activity that corresponds to unique nearby activity within the STN.
What does the nearby STN LFPs activity represent?
Several studies have reported that the LFP and spiking activity in the STN are coherent (Kühn et al. 2005; Weinberger et al. 2006). However, in some cases, as shown in the example in Fig. 2, the microelectrode spiking activity cannot detect beta activity (Fig. 2B, right) but the bipolar macroelectrode LFPs can (Fig. 2F, right). In the 2-mm-apart simultaneously recording electrodes (Fig. 2, left), beta activity can be detected both in the microelectrode spiking activity and the bipolar macroelectrode LFPs recordings. A similar finding was reported by Weinberger et al. (2006). They found that only some of the cells in the STN fired in synchrony with LFP beta oscillations and in some cases with clear beta LFPs there were very few oscillatory firing cells. Similarly, analysis of all our recordings (Fig. 4) shows that after entry into the STN the beta power of microelectrode spiking activity increases less than the beta power of the bipolar macroelectrode LFPs (~3.5- and 13-fold, respectively).
The existence of beta activity in the LFP recordings in the same trajectory with absence of beta activity in the spiking activity, as well as the larger power of LFPs vs. spikes beta activity in the STN, suggest that the beta oscillatory spiking firing in the STN is not the exclusive source of beta LFPs. Rather, we suggest that the nearby STN LFPs represent a summation of the subthreshold activity and afferent inputs originating from oscillatory firing cells outside the STN; i.e., the external segment of the globus pallidus, the thalamus, and the cortex. Another possible explanation might be that beta activity is present at the single cell level but at different phases in different cells, thus attenuating the spiking activity multiunit signal.
What does the LFPs nonnearby activity represent?
The STN’s mean dipole activity is probably less organized and smaller compared with cortical dipole (van Dijk et al. 2016). Although the recording electrodes were ~80–90 mm from the cortical dipole source, most of the nonnearby LFP activity may have been volume conducted from the cortex (EEG) (Schroeder et al. 1992; Wennberg and Lozano 2003). The cortex is a spherical shell and its activity converges inside the subcortical core. In addition, the spread of cortical LFP in the vertical plane is larger than the horizontal plane (Ingber and Nunez 2011; Kajikawa and Schroeder 2011; Kocsis et al. 1999; Srinivasan et al. 2006; Winter et al. 2007). The subcortical myelin and fibers direction probably make the vertically oriented white matter a better conductive tissue (Logothetis et al. 2007).
The cortical dipole is large and its activity is inversely related to the signal frequency (1 over F phenomenon). The greater STN low-frequency activity, further to the expected 1 over F phenomenon, might be due to the capacitor characteristics of brain tissue that enables low frequencies to extend over larger cortical areas (Bédard et al. 2004; Destexhe et al. 1999; Kajikawa and Schroeder 2011; but see Logothetis et al. 2007). Low frequencies are probably more coherent in the vertical plane because they carry cortical-subcortical interaction signals (Steriade 2006). Therefore, it is not surprising that the coherence between two adjacent macroelectrode LFPs was inversely related to frequency (Fig. 5D).
While the cortical dipole input and the STN dipole input are similar with different recording configurations, the shared intersected field has unique properties for each recording electrode. The shared intersected field activity depends on the electrode geometry, recording configuration, and lateral spread of the neural signals. The distance between the microelectrodes (2 mm) is much larger than their sampling area (~100 µm); hence, the shared intersected field of the microelectrode spiking activity is extremely low. In contrast, the distance between macroelectrodes is within their sampling area (Lempka and McIntyre 2013) and therefore the shared intersected field of macroelectrode LFP activity is large. The sampling area is larger for low frequencies (Buzáski et al. 2012; Lindén et al. 2011) and therefore the coherence of the shared intersected field between two adjacent macroelectrode LFPs is also inversely related to frequency.
Bipolar macroelectrode LFPs vs. microelectrode spikes for DBS navigation.
Today many medical centers that use electrophysiology-assisted navigation during DBS procedure rely on microelectrode spiking beta oscillatory activity (Benazzouz et al. 2002; Hutchison et al. 1998; Moran et al. 2006; Sterio et al. 2002; Zaidel et al. 2009). In some cases in our center, as mentioned above, the microelectrode spiking activity cannot detect beta activity (Fig. 2B, right) but the bipolar macroelectrode LFPs can (Fig. 2F, right). Our findings suggest that bipolar macroelectrode LFPs might better differentiate beta power outside the STN and inside the STN than microelectrode spiking activity.
Although not proved, it is often claimed that sharp microelectrodes can increase the surgical risks such as intracranial hemorrhages (Xiaowu et al. 2010). It was therefore suggested to validate the electrode location by direct recordings from the macroelectrode contacts of the implanted electrodes (Hariz 2014). Chen et al. (2006) correlated bipolar macroelectrode LFPs from the two lower contacts of the DBS electrode during surgery to the intra-operative clinical stun effect (9 Parkinson’s disease patients, 16 trajectories). Telkes et al. (2014) showed that the localization error of the superior STN border between the bipolar macroelectrode recordings and microelectrode spiking recordings was 1.00 ± 0.84 mm (mean ± standard deviation) when the electrodes were separately inserted into the STN (6 Parkinson’s disease patients, 6 trajectories). Here, we used simultaneous recordings and direct comparisons of microelectrode and macroelectrode recordings. The localization error of the superior STN border between the bipolar macroelectrode recordings and the microelectrode spiking recordings was 0.23 ± 0.94 mm (mean ± standard deviation). Thus the bipolar macroelectrode LFP recordings appear to be a safe and reliable method for detection of the STN upper border.
Few studies have explored bipolar microelectrode LFP recordings in the STN. Although bipolar microelectrode recording is different from bipolar macroelectrode recording (for example, differences in electrode impedance are larger in microelectrodes than in macroelectrodes), our results are similar to these reports. Kühn et al. (2005) reported microelectrode LFP recordings in 8 trajectories (6 Parkinson’s disease patients) that were referenced to the top of the electrode. They found a pronounced increase in beta frequency band LFP activity in the STN. Telkes et al. (2015) reported individual examples (5 Parkinson’s disease patients) of three track monopolar microelectrode LFP recordings separated by 2 mm in a horizontal plane. They reported that the bipolar derivations (mean of three tracks subtracted from each track itself) could eliminate the masking effect of the STN nonnearby activity. We found that the ratio of the variance of LFP nearby activity inside to the variance of nearby activity outside the STN was higher in macroelectrode LFP recordings than in microelectrode LFP recordings (Fig. 7B). Therefore we suggest that bipolar macroelectrode LFP recordings can better overcome the confounding effects of nonnearby (common) activity in the STN compared with bipolar microelectrode LFP recordings.
Summary.
Our findings indicate that vertical and horizontal bipolar macroelectrode differential LFPs can detect STN generated nearby activity. In this study we mapped the superior dorsolateral border of the STN. Future studies should aim at a broader mapping of the STN subdomains and other borders. Bipolar macroelectrode LFPs might be a preferable candidate for future electrophysiology research protocols, DBS navigation aids, and closed-loop DBS algorithms.
GRANTS
The study was partially support by grant from the Magnet program of the Office of the Chief Scientist (OCS) of the Ministry of Economy of Israel (to H. Bergman), the NARSAD Young Investigator Grant (to R. Eitan), the Adelis Foundation grant (to Z. Israel and H. Bergman), the Israel Science Foundation (ISF), the Israel-US Binational Science Foundation (BSF) (to R. Eitan, Z. Israel, and H. Bergman), and the Gutmann chair for brain research and the Rostrees and Vorst foundations grants (to H. Bergman).
DISCLOSURES
No conflicts of interest, financial or otherwise, are declared by the authors.
AUTHOR CONTRIBUTIONS
O.M., D.V., A.S.B., I.T., H.B., Z.I., and R.E. performed experiments; O.M., D.V., A.S.B., H.B., and R.E. analyzed data; O.M., D.V., M.J., A.S.B., D.A., H.B., Z.I., and R.E. interpreted results of experiments; O.M., A.S.B., H.B., and R.E. prepared figures; O.M., M.J., A.S.B., D.A., H.B., and R.E. drafted manuscript; O.M., A.S.B., D.A., H.B., Z.I., and R.E. edited and revised manuscript; O.M., D.V., M.J., A.S.B., D.A., I.T., H.B., Z.I., and R.E. approved final version of manuscript; R.E. conceived and designed research.
ACKNOWLEDGMENTS
The Tripolar electrodes were generously provided by Alpha-Omega Inc.
REFERENCES
- Bédard C, Kröger H, Destexhe A. Modeling extracellular field potentials and the frequency-filtering properties of extracellular space. Biophys J 86: 1829–1842, 2004. doi: 10.1016/S0006-3495(04)74250-2. [DOI] [PMC free article] [PubMed] [Google Scholar]
- Benabid AL, Benazzouz A, Hoffmann D, Limousin P, Krack P, Pollak P. Long-term electrical inhibition of deep brain targets in movement disorders. Mov Disord 13, Suppl 3: 119–125, 1998. doi: 10.1002/mds.870131321. [DOI] [PubMed] [Google Scholar]
- Benazzouz A, Breit S, Koudsie A, Pollak P, Krack P, Benabid AL. Intraoperative microrecordings of the subthalamic nucleus in Parkinson’s disease. Mov Disord 17, Suppl 3: S145–S149, 2002. doi: 10.1002/mds.10156. [DOI] [PubMed] [Google Scholar]
- Buzsáki G, Anastassiou CA, Koch C. The origin of extracellular fields and currents–EEG, ECoG, LFP and spikes. Nat Rev Neurosci 13: 407–420, 2012. doi: 10.1038/nrn3241. [DOI] [PMC free article] [PubMed] [Google Scholar]
- Chen CC, Pogosyan A, Zrinzo LU, Tisch S, Limousin P, Ashkan K, Yousry T, Hariz MI, Brown P. Intra-operative recordings of local field potentials can help localize the subthalamic nucleus in Parkinson’s disease surgery. Exp Neurol 198: 214–221, 2006. doi: 10.1016/j.expneurol.2005.11.019. [DOI] [PubMed] [Google Scholar]
- Destexhe A, Contreras D, Steriade M. Spatiotemporal analysis of local field potentials and unit discharges in cat cerebral cortex during natural wake and sleep states. J Neurosci 19: 4595–4608, 1999. [DOI] [PMC free article] [PubMed] [Google Scholar]
- Deuschl G, Herzog J, Kleiner-Fisman G, Kubu C, Lozano AM, Lyons KE, Rodriguez-Oroz MC, Tamma F, Tröster AI, Vitek JL, Volkmann J, Voon V. Deep brain stimulation: postoperative issues. Mov Disord 21, Suppl 14: S219–S237, 2006. doi: 10.1002/mds.20957. [DOI] [PubMed] [Google Scholar]
- Einevoll GT, Kayser C, Logothetis NK, Panzeri S. Modelling and analysis of local field potentials for studying the function of cortical circuits. Nat Rev Neurosci 14: 770–785, 2013. doi: 10.1038/nrn3599. [DOI] [PubMed] [Google Scholar]
- Follett KA, Weaver FM, Stern M, Hur K, Harris CL, Luo P, Marks WJ Jr, Rothlind J, Sagher O, Moy C, Pahwa R, Burchiel K, Hogarth P, Lai EC, Duda JE, Holloway K, Samii A, Horn S, Bronstein JM, Stoner G, Starr PA, Simpson R, Baltuch G, De Salles A, Huang GD, Reda DJ; CSP 468 Study Group . Pallidal versus subthalamic deep-brain stimulation for Parkinson’s disease. N Engl J Med 362: 2077–2091, 2010. doi: 10.1056/NEJMoa0907083. [DOI] [PubMed] [Google Scholar]
- Hariz M. Deep brain stimulation: new techniques. Parkinsonism Relat Disord 20, Suppl 1: S192–S196, 2014. doi: 10.1016/S1353-8020(13)70045-2. [DOI] [PubMed] [Google Scholar]
- Hutchison WD, Allan RJ, Opitz H, Levy R, Dostrovsky JO, Lang AE, Lozano AM. Neurophysiological identification of the subthalamic nucleus in surgery for Parkinson’s disease. Ann Neurol 44: 622–628, 1998. doi: 10.1002/ana.410440407. [DOI] [PubMed] [Google Scholar]
- Ingber L, Nunez PL. Neocortical dynamics at multiple scales: EEG standing waves, statistical mechanics, and physical analogs. Math Biosci 229: 160–173, 2011. doi: 10.1016/j.mbs.2010.12.003. [DOI] [PubMed] [Google Scholar]
- Kajikawa Y, Schroeder CE. How local is the local field potential? Neuron 72: 847–858, 2011. doi: 10.1016/j.neuron.2011.09.029. [DOI] [PMC free article] [PubMed] [Google Scholar]
- Kay SM. Spectral estimation. In: Advanced Topics in Signal Processing, edited by Lim JS, Oppenheim AV. Englewood Cliffs, NJ: Prentice-Hall, 1988, p. 58–122. [Google Scholar]
- Kocsis B, Bragin A, Buzsáki G. Interdependence of multiple theta generators in the hippocampus: a partial coherence analysis. J Neurosci 19: 6200–6212, 1999. [DOI] [PMC free article] [PubMed] [Google Scholar]
- Kühn AA, Trottenberg T, Kivi A, Kupsch A, Schneider GH, Brown P. The relationship between local field potential and neuronal discharge in the subthalamic nucleus of patients with Parkinson’s disease. Exp Neurol 194: 212–220, 2005. doi: 10.1016/j.expneurol.2005.02.010. [DOI] [PubMed] [Google Scholar]
- Kühn AA, Williams D, Kupsch A, Limousin P, Hariz M, Schneider GH, Yarrow K, Brown P. Event-related beta desynchronization in human subthalamic nucleus correlates with motor performance. Brain 127: 735–746, 2004. doi: 10.1093/brain/awh106. [DOI] [PubMed] [Google Scholar]
- Lempka SF, McIntyre CC. Theoretical analysis of the local field potential in deep brain stimulation applications. PLoS One 8: e59839, 2013. doi: 10.1371/journal.pone.0059839. [DOI] [PMC free article] [PubMed] [Google Scholar]
- Lindén H, Tetzlaff T, Potjans TC, Pettersen KH, Grün S, Diesmann M, Einevoll GT. Modeling the spatial reach of the LFP. Neuron 72: 859–872, 2011. doi: 10.1016/j.neuron.2011.11.006. [DOI] [PubMed] [Google Scholar]
- Little S, Brown P. What brain signals are suitable for feedback control of deep brain stimulation in Parkinson’s disease? Ann NY Acad Sci 1265: 9–24, 2012. doi: 10.1111/j.1749-6632.2012.06650.x. [DOI] [PMC free article] [PubMed] [Google Scholar]
- Little S, Brown P. The functional role of beta oscillations in Parkinson’s disease. Parkinsonism Relat Disord 20, Suppl 1: S44–S48, 2014. doi: 10.1016/S1353-8020(13)70013-0. [DOI] [PubMed] [Google Scholar]
- Logothetis NK, Kayser C, Oeltermann A. In vivo measurement of cortical impedance spectrum in monkeys: implications for signal propagation. Neuron 55: 809–823, 2007. doi: 10.1016/j.neuron.2007.07.027. [DOI] [PubMed] [Google Scholar]
- Mallet L, Polosan M, Jaafari N, Baup N, Welter ML, Fontaine D, du Montcel ST, Yelnik J, Chéreau I, Arbus C, Raoul S, Aouizerate B, Damier P, Chabardès S, Czernecki V, Ardouin C, Krebs MO, Bardinet E, Chaynes P, Burbaud P, Cornu P, Derost P, Bougerol T, Bataille B, Mattei V, Dormont D, Devaux B, Vérin M, Houeto JL, Pollak P, Benabid AL, Agid Y, Krack P, Millet B, Pelissolo A; STOC Study Group . Subthalamic nucleus stimulation in severe obsessive-compulsive disorder. N Engl J Med 359: 2121–2134, 2008. doi: 10.1056/NEJMoa0708514. [DOI] [PubMed] [Google Scholar]
- Moran A, Bar-Gad I, Bergman H, Israel Z. Real-time refinement of subthalamic nucleus targeting using Bayesian decision-making on the root mean square measure. Mov Disord 21: 1425–1431, 2006. doi: 10.1002/mds.20995. [DOI] [PubMed] [Google Scholar]
- Moshel S, Shamir RR, Raz A, de Noriega FR, Eitan R, Bergman H, Israel Z. Subthalamic nucleus long-range synchronization—an independent hallmark of human Parkinson’s disease. Front Syst Neurosci 7: 79, 2013. doi: 10.3389/fnsys.2013.00079. [DOI] [PMC free article] [PubMed] [Google Scholar]
- Nelson MJ, Pouget P, Nilsen EA, Patten CD, Schall JD. Review of signal distortion through metal microelectrode recording circuits and filters. J Neurosci Methods 169: 141–157, 2008. doi: 10.1016/j.jneumeth.2007.12.010. [DOI] [PMC free article] [PubMed] [Google Scholar]
- Neumann WJ, Staub F, Horn A, Schanda J, Mueller J, Schneider GH, Brown P, Kühn AA. Deep brain recordings using an implanted pulse generator in Parkinson’s disease. Neuromodulation 19: 20–24, 2016. doi: 10.1111/ner.12348. [DOI] [PMC free article] [PubMed] [Google Scholar]
- Ostrem JL, Racine CA, Glass GA, Grace JK, Volz MM, Heath SL, Starr PA. Subthalamic nucleus deep brain stimulation in primary cervical dystonia. Neurology 76: 870–878, 2011. doi: 10.1212/WNL.0b013e31820f2e4f. [DOI] [PubMed] [Google Scholar]
- Priori A, Foffani G, Rossi L, Marceglia S. Adaptive deep brain stimulation (aDBS) controlled by local field potential oscillations. Exp Neurol 245: 77–86, 2013. doi: 10.1016/j.expneurol.2012.09.013. [DOI] [PubMed] [Google Scholar]
- Schjerling L, Hjermind LE, Jespersen B, Madsen FF, Brennum J, Jensen SR, Løkkegaard A, Karlsborg M. A randomized double-blind crossover trial comparing subthalamic and pallidal deep brain stimulation for dystonia. J Neurosurg 119: 1537–1545, 2013. doi: 10.3171/2013.8.JNS13844. [DOI] [PubMed] [Google Scholar]
- Schroeder CE, Tenke CE, Givre SJ. Subcortical contributions to the surface-recorded flash-VEP in the awake macaque. Electroencephalogr Clin Neurophysiol 84: 219–231, 1992. doi: 10.1016/0168-5597(92)90003-T. [DOI] [PubMed] [Google Scholar]
- Sokal RR, Rohlf FJ. Biometry: The Principles and Practice of Statistics in Biological Research. New York: Freeman, 1995. [Google Scholar]
- Srinivasan R, Winter WR, Nunez PL. Source analysis of EEG oscillations using high-resolution EEG and MEG. Prog Brain Res 159: 29–42, 2006. doi: 10.1016/S0079-6123(06)59003-X. [DOI] [PMC free article] [PubMed] [Google Scholar]
- Steriade M. Grouping of brain rhythms in corticothalamic systems. Neuroscience 137: 1087–1106, 2006. doi: 10.1016/j.neuroscience.2005.10.029. [DOI] [PubMed] [Google Scholar]
- Sterio D, Zonenshayn M, Mogilner AY, Rezai AR, Kiprovski K, Kelly PJ, Beric A. Neurophysiological refinement of subthalamic nucleus targeting. Neurosurgery 50: 58–67, 2002. [DOI] [PubMed] [Google Scholar]
- Telkes I, Ince NF, Onaran I, Abosch A. Localization of subthalamic nucleus borders using macroelectrode local field potential recordings. Conf Proc IEEE Eng Med Biol Soc 2014: 2621–2624, 2014. [DOI] [PubMed] [Google Scholar]
- Telkes I, Ince NF, Onaran I, Abosch A. Spatio-spectral characterization of local field potentials in the subthalamic nucleus via multitrack microelectrode recordings. Conf Proc IEEE Eng Med Biol Soc 2015: 5561–5564, 2015. [DOI] [PubMed] [Google Scholar]
- van Dijk KJ, Janssen ML, Zwartjes DG, Temel Y, Visser-Vandewalle V, Veltink PH, Benazzouz A, Heida T. Spatial localization of sources in the rat subthalamic motor region using an inverse current source density method. Front Neural Circuits 10: 87, 2016. doi: 10.3389/fncir.2016.00087. [DOI] [PMC free article] [PubMed] [Google Scholar]
- Weinberger M, Mahant N, Hutchison WD, Lozano AM, Moro E, Hodaie M, Lang AE, Dostrovsky JO. Beta oscillatory activity in the subthalamic nucleus and its relation to dopaminergic response in Parkinson’s disease. J Neurophysiol 96: 3248–3256, 2006. doi: 10.1152/jn.00697.2006. [DOI] [PubMed] [Google Scholar]
- Welch PD. The use of fast Fourier transform for the estimation of power spectra: a method based on time averaging over short, modified periodograms. IEEE Trans Audio Electroacoust 15: 70–73, 1967. [Google Scholar]
- Wennberg RA, Lozano AM. Intracranial volume conduction of cortical spikes and sleep potentials recorded with deep brain stimulating electrodes. Clin Neurophysiol 114: 1403–1418, 2003. doi: 10.1016/S1388-2457(03)00152-4. [DOI] [PubMed] [Google Scholar]
- Winestone JS, Zaidel A, Bergman H, Israel Z. The use of macroelectrodes in recording cellular spiking activity. J Neurosci Methods 206: 34–39, 2012. doi: 10.1016/j.jneumeth.2012.02.002. [DOI] [PubMed] [Google Scholar]
- Winter WR, Nunez PL, Ding J, Srinivasan R. Comparison of the effect of volume conduction on EEG coherence with the effect of field spread on MEG coherence. Stat Med 26: 3946–3957, 2007. doi: 10.1002/sim.2978. [DOI] [PubMed] [Google Scholar]
- Xiaowu H, Xiufeng J, Xiaoping Z, Bin H, Laixing W, Yiqun C, Jinchuan L, Aiguo J, Jianmin L. Risks of intracranial hemorrhage in patients with Parkinson’s disease receiving deep brain stimulation and ablation. Parkinsonism Relat Disord 16: 96–100, 2010. doi: 10.1016/j.parkreldis.2009.07.013. [DOI] [PubMed] [Google Scholar]
- Zaidel A, Spivak A, Shpigelman L, Bergman H, Israel Z. Delimiting subterritories of the human subthalamic nucleus by means of microelectrode recordings and a hidden Markov model. Mov Disord 24: 1785–1793, 2009. doi: 10.1002/mds.22674. [DOI] [PubMed] [Google Scholar]