

Optic flow constitutes a biologically relevant visual cue as we move through any environment. With the use of neuroimaging and brain-stimulation techniques, this study demonstrates that separate human brain areas are involved in the analysis of the direction of radial motion and the focus of expansion in optic flow. This dissociation reveals the existence of separate processing pathways for the analysis of different attributes of optic flow that are important for the guidance of self-locomotion and object avoidance.
Keywords: transcranial magnetic stimulation, fMRI, psychophysics, V5/MT+, V3A
Abstract
Human neuropsychological and neuroimaging studies have raised the possibility that different attributes of optic flow stimuli, namely radial direction and the position of the focus of expansion (FOE), are processed within separate cortical areas. In the human brain, visual areas V5/MT+ and V3A have been proposed as integral to the analysis of these different attributes of optic flow stimuli. To establish direct causal relationships between neural activity in human (h)V5/MT+ and V3A and the perception of radial motion direction and FOE position, we used transcranial magnetic stimulation (TMS) to disrupt cortical activity in these areas while participants performed behavioral tasks dependent on these different aspects of optic flow stimuli. The cortical regions of interest were identified in seven human participants using standard functional MRI retinotopic mapping techniques and functional localizers. TMS to area V3A was found to disrupt FOE positional judgments but not radial direction discrimination, whereas the application of TMS to an anterior subdivision of hV5/MT+, MST/TO-2 produced the reverse effects, disrupting radial direction discrimination but eliciting no effect on the FOE positional judgment task. This double dissociation demonstrates that FOE position and radial direction of optic flow stimuli are signaled independently by neural activity in areas hV5/MT+ and V3A.
NEW & NOTEWORTHY Optic flow constitutes a biologically relevant visual cue as we move through any environment. With the use of neuroimaging and brain-stimulation techniques, this study demonstrates that separate human brain areas are involved in the analysis of the direction of radial motion and the focus of expansion in optic flow. This dissociation reveals the existence of separate processing pathways for the analysis of different attributes of optic flow that are important for the guidance of self-locomotion and object avoidance.
when we move through our environment, visual cues about the nature and direction of this motion are provided by the changing pattern of images formed on our retinae—so-called optic flow. The ability of the human visual system to analyze optic flow is of crucial biological significance, as it provides key visual cues that can be used for the guidance of self-motion and object avoidance (Gibson 1950). Movement by an individual (typically forward) generates a focus of expansion (FOE) in optic flow from which all motion vectors expand, and this provides crucial information about heading direction (Warren and Hannon 1988). Analysis of the global nature and direction of radial motion, on the other hand, constitutes a very different type of cue to that offered by the analysis of FOE position. The signaling of radial motion provides information that can be used globally to subtract or parse flow motion, which is essential for the tracking and avoidance of independently moving objects during self-motion (Warren and Rushton 2009).
Visually presented moving stimuli elicit neural activity across an extensive network of human brain areas, including the following: V1, V2, V3, V3A, V3B, human (h)V5/MT+, V6, and intraparietal sulcus 0–4 (Claeys et al. 2003; Culham et al. 2001; McKeefry et al. 1997; Pitzalis et al. 2010; Seiffert et al. 2003; Smith et al. 1998; Tootell et al. 1997; Watson et al. 1993; Zeki et al. 1991). In the human brain, two cortical areas within this network exhibit a particularly high sensitivity to visual motion. The first of these is hV5/MT+ and is the visual area most closely associated with motion processing (Culham et al. 2001; Dumoulin et al. 2000; Tootell et al. 1995; Watson et al. 1993; Zeki et al. 1991). hV5/MT+ forms a complex comprising at least two, but possibly more, visual areas [see Kolster et al. (2010)]. These subdivisions have been tentatively proposed as human homologues of areas medial temporal (MT) and medial superior temporal (MST), which form constituents of V5/MT+ in the monkey brain (Amano et al. 2009; Dukelow et al. 2001; Huk et al. 2002). In this study, we have adopted the terms MT/TO-1 for the posteriorly located area and MST/TO-2 for the anterior subdivision. This nomenclature reflects the suggested functional homology with the macaque, as well their differentiation in the human brain on the basis of their retinotopic characteristics (Amano et al. 2009). The other human visual area with a high degree of motion selectivity is area V3A, which contains a representation of the full contralateral visual hemifield and lies anterior and dorsal to area V3 in the occipitoparietal cortex. V3A is second only to hV5/MT+ in terms of its sensitivity to motion stimuli (Seiffert et al. 2003; Smith et al. 1998; Tootell et al. 1997; Vanduffel et al. 2002). This is in contrast to the monkey brain, where it is neurons in V3, rather than V3A, that are more responsive to motion stimuli (Felleman and Van Essen 1987).
Human neuropsychological studies have raised the possibility that the analysis of FOE position and radial motion direction of optic flow stimuli occurs within separate cortical areas. Beardsley and Vaina (2005), for example, demonstrated that a patient (GZ) with damage to hV5/MT+ was impaired in terms of her ability to perceive radial motion direction, but her ability to detect FOE position remained intact. Neuroimaging data also point to a segregation of function with regards to the analysis of the radial direction of optic flow and FOE position. Consistent with the functional specializations that have been reported for monkey MT and MST (Duffy 1998; Duffy and Wurtz 1991a, 1991b; Eifuku and Wurtz 1998; Komatsu and Wurtz 1988, 1989; Lagae et al. 1994; Mikami et al. 1986; Saito et al. 1986; Tanaka and Saito 1989; Tanaka et al. 1993), the anterior subdivision of hV5/MT+, MST/TO-2, has been shown to be selectively responsive to radial motion or optic flow stimuli. MST/TO-2 appears to be more specialized for encoding the global flow properties of complex motion stimuli compared with its posterior counterpart, MT/TO-1 (Smith et al. 2006; Wall et al. 2008). In terms of the analysis of FOE position, neural activity in area V3A has been identified as potentially important. Koyama et al. (2005), in their functional MRI (fMRI) experiments, demonstrated that activity within V3A is closely correlated with the position of FOE. Cardin et al. (2012) have also demonstrated sensitivity in V3A to FOE position.
Both neuropsychological and neuroimaging data have their limitations. In the case of the former, lesions are rarely confined to discrete visual areas, as the latter provides only correlative measures of brain function. As a result, it is neither possible to ascertain from these results whether the perception of FOE position is causally dependent on neural activity in area V3A nor whether a similar causal relationship exists between neural activity in hV5/MT+ and the perception of radial direction in optic flow. Therefore, the purpose of this study was to test the hypothesis that human cortical areas hV5/MT+ (more specifically, its anterior subdivision, MST/TO-2) and V3A perform distinct and separable contributions to the perception of radial motion direction and FOE position of optic flow stimuli. To establish causal dependencies, we used repetitive transcranial magnetic stimulation (TMS) to disrupt neural function within hV5/MT+ and V3A while participants performed behavioral tasks that assessed the ability of human observers to discriminate the direction of radially moving dots or changes in the position of FOE in optic flow stimuli. All cortical target sites were identified in each of the participants using fMRI retinotopic mapping procedures (DeYoe et al. 1996; Engel et al. 1997; Sereno et al. 1995) combined with functional localizers (Amano et al. 2009; Dukelow et al. 2001; Huk et al. 2002).
MATERIALS AND METHODS
Participants.
Seven volunteers participated in this study (5 men; ages 21–48). All participants had normal or corrected-to-normal vision at the time of testing and gave written, informed consent. Experiments were approved by Ethics Committees at both the University of Bradford and York Neuroimaging Centre and were carried out in accordance with the Declaration of Helsinki and accepted TMS safety protocols (Lorberbaum and Wassermann 2000; Rossi et al. 2009; Wassermann 1998).
Visual stimuli.
Visual stimuli were presented on a 19-inch Mitsubishi Diamond Pro 2070SB monitor (refresh rate: 75 Hz; resolution: 1,024 × 768) and consisted of moving white dots (size: ~0.2°; density: 4.69/degree2) within a 10° (diameter) circular aperture. The constituent dots moved at a speed of 7°/s (with a flat speed gradient) and were presented for 200 ms on each trial. In experiment 1, the radial motion stimuli comprised signal and noise dots. A percentage of the dots were signal dots that moved coherently in a radial direction (expanding/contracting). The exact percentage of signal dots was set (for each individual) at a level corresponding to the 75% correct performance threshold for the radial direction discrimination task. This was determined in preliminary psychophysical experiments. Across all of the observers, 75% correct performance typically required relatively low percentages of signal dots (range: 10.1–24.4%). The remaining (noise) dots moved in random directions and had a uniform density across the stimulus aperture. In experiment 2, a similar radial motion aperture stimulus was placed within a hemifield of randomly moving dots, and FOE position of this stimulus could be moved upward or downward (Fig. 1). The magnitude of the FOE displacement corresponded to 75% correct performance, which was also determined in preliminary psychophysical experiments. To prevent any confounding effects that could arise if the signal dots created a perceptual border at the intersection with the noise dots, a coherence level of 70% for the signal dots in the radial motion aperture stimulus was used. When the stimulus was placed within the hemifield of randomly moving noise dots, this effectively masked the presence of any motion-defined border between the aperture stimulus and the background. To control for any potential cues arising from the difference in density of the expanding dots at the FOE vs. the periphery, 10% of the 70% coherent signal dots were contracting toward a common focal point, whereas the remainder were expanding in the opposite direction.
Fig. 1.

TMS/behavioral paradigms. Experiment 1: radial motion stimuli (expanding or contracting) were presented in a circular aperture, displaced 15° to the left of a fixation cross. The onset of a repetitive train of 5 TMS pulses was coincident and coextensive with the onset of this stimulus. Following stimulus offset, the participants reported the perceived direction of the motion (in or out) by a key press. Experiment 2: each test sequence began with the onset of a reference stimulus (200 ms) comprising a circular aperture of radially expanding dots embedded in a background of randomly moving noise dots. After a 2,000-ms delay, a test stimulus was presented in which the FOE of the radial motion was displaced either upward or downward. The delivery of the TMS pulse train was coincident with the onset of the test stimulus. Following test offset, participants reported the perceived direction of FOE displacement (up or down) by a key press. ITI, intertrial interval; ISI, interstimulus interval.
The centers of motion stimuli were positioned 15° to the left of fixation for both TMS/behavioral experiments. This placement was used to minimize involvement of ipsilateral V5/MT+ in the performance of the motion discrimination tasks, as Amano et al. (2009), for example, have demonstrated that the receptive fields of hV5/MT+ neurons can extend well beyond the vertical meridian into the ipsilateral (in this case, the left) visual field.
fMRI localization of cortical ROIs.
All fMRI and structural MRI scans were acquired using a GE Signa Excite 3-Tesla HDx scanner. The multi-average, whole-head, T1-weighted structural scans for each participant encompassed 176 sagittal slices [repetition time = 7.8 ms; echo time = 3 ms; inversion time = 450 ms; field of view = 290 × 290 × 276, 256 × 256 × 176 matrix; flip angle = 20° 1.13 × 1.13 × 1.0 mm3]. The fMRI scan used gradient recalled echo pulse sequences to measure T2 weighted images (repetition time = 3,000 ms; echo time = 29 ms; field of view = 192 cm, 128 × 128 matrix, 39 contiguous slices, 1.5 × 1.5 × 1.5 mm3, interleaved slice order with no gap).
Two subdivisions of hV5/MT+ (MT/TO-1 and MST/TO-2) were identified using techniques similar to those described previously (Amano et al. 2009; Dukelow et al. 2001; Huk et al. 2002). Briefly, localizer stimuli consisting of a 15° aperture of 300 moving white dots (8°/s) were centrally displaced 17.5° relative to a central fixation target into either the left or right visual field. By contrasting responses to moving with those to static, MST/TO-2 was identified by ipsilateral activations to stimulation of either the right or left visual field. MT/TO-1 was located by subtracting the anterior MST/TO-2 activity from the whole hV5/MT+ complex activation found for contralateral stimulation (Amano et al. 2009; Dukelow et al. 2001; Huk et al. 2002; Strong et al. 2017). Stimuli in this case were projected onto a rear-projection screen and viewed through a mirror (refresh rate: 120 Hz; resolution: 1,920 × 1,080; viewing distance: 57 cm).
Standard retinotopic mapping techniques (DeYoe et al. 1996; Engel et al. 1997; Sereno et al. 1995), using a 90° anti-clockwise rotating wedge (flicker rate: 6 Hz) and an expanding annulus (≤15° radius), both lasting 36 s per cycle, were used to identify area V3A and the control site LO-1 in each participant. Area V3A, located in the superior occipitoparietal cortex, contains a complete hemifield representation of the contralateral visual field. This differentiates it from dorsal and ventral V2 and V3, which map only a quadrant of the contralateral field (Tootell et al. 1997). LO-1 lies ventral to V3A and contains a lower contralateral visual field map posteriorly and an upper contralateral visual field representation anteriorly (Fig. 2). LO-1 was chosen as a control site, because it lies in close proximity to areas V3A and hV5/MT+ but unlike them, is largely unresponsive to visual motion (Larsson and Heeger 2006; Silson et al. 2013) and exhibits only weak activation in response to moving stimuli (Bartels et al. 2008). BrainVoyager QX (Brain Innovation, Maastricht, The Netherlands) was used to analyze the fMRI data and to identify target sites for the TMS, which were selected as center-of-mass coordinates for identified regions of interest (ROIs). Table 1 provides Talairach coordinates for each of the target sites (right hemisphere only) in all seven participants.
Fig. 2.
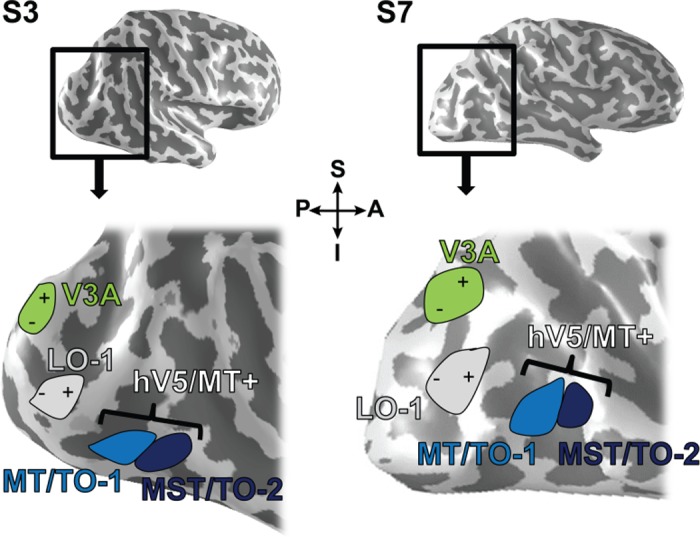
Location of main cortical ROI target sites for TMS. Inflated right hemispheres for 2 subjects (S3 and S7) with overlaid positions of TMS target sites used in experiment 1 and experiment 2. The bottom figure shows a magnified view of the posterior section of the hemisphere. The representation of the visual field in each area is denoted with a symbol (“+” and “−”). +, representation of the superior (S) contralateral visual field; −, inferior (I) contralateral visual field. These markings are absent from the representations of MT/TO-1 and MST/TO-2, as the retinotopic mapping did not produce reliable maps within these regions. A, anterior; P, posterior.
Table 1.
Comparison of average Talairach coordinates with previous literature
| x | y | z | |
|---|---|---|---|
| MST/TO-2 | |||
| This study (n = 7) | 42 ± 5 | −69 ± 9 | 0 ± 9 |
| Dukelow et al. 2001 (n = 8) | 45 ± 3 | −60 ± 5 | 5 ± 4 |
| Kolster et al. 2010 (n = 11) | 44 | −70 | 5 |
| V3A | |||
| This study (n = 7) | 17 ± 6 | −93 ± 5 | 15 ± 8 |
| Tootell et al. 1997 (n = 5) | 29 | −86 | 19 |
| LO-1 | |||
| This study (n = 7) | 27 ± 6 | −89 ± 2 | 1 ± 3 |
| Larsson and Heeger 2006 (n = 15) | 32 ± 4 | −89 ± 5 | 3 ± 7 |
Average Talairach coordinates for center of target TMS sites (MST/TO-2, V3A, LO-1) in the right hemisphere ± SD (where available). Results from the current study are compared with previous data, as cited in the table.
TMS stimulation.
The TMS coil was positioned over the cortical test and control sites identified from the fMRI localization and retinotopic mapping experiments described above. In these experiments, TMS was delivered to the target sites in the right hemisphere. Following identification of these target points in three-dimensional space, coregistration between the subject’s head and the structural scans was achieved using a three-dimensional ultrasound digitizer [CMS30P (Zebris Medical, Isny, Germany)] in conjunction with BrainVoyager software. This allowed the coil position to be monitored and adjusted throughout the experiment by creating a local spatial coordinate system that links the spatial positions of ultrasound transmitters on the subject and the coil with prespecified fiducials on the structural MRIs [see McKeefry et al. (2008)].
During the behavioral experiments, TMS pulses were delivered using a Magstim Super Rapid2 (Magstim, Carmarthenshire, UK) figure-of-eight coil (50 mm). During each trial, a train of five biphasic pulses was applied (Fig. 1). This pulse train had a total duration of 200 ms, and the pulse strengths were set at 70% maximal stimulator output. The onsets of the pulse trains were synchronous with the onset of the presentation of test stimuli.
Psychophysical/TMS experimental procedures.
Participants viewed the monitor with their right eye at a distance of 57 cm, with the left eye occluded and head restrained in a chin rest. All trials for experiment 1 and experiment 2 were set to the 75% threshold abilities of each participant. In these preliminary experiments, a method of constant stimuli was used to determine threshold, with 50 repetitions of each coherence level between 5 and 50% for the radial motion task and 30 repetitions of each position change between −1 and +1° of visual angle for the FOE task.
In the combined behavioral/TMS experiments, we used a two-alternative forced choice procedure, the order of conditions (each comprising 100 trials) was counterbalanced across participants, and TMS was applied single blind. In experiment 1, participants indicated whether the dots were moving inward (contracting) or outward (expanding). In experiment 2, participants viewed a reference stimulus comprising a similar aperture of radially expanding dots placed within a field of random dots (see figure paradigm). The FOE was level with fixation but was displaced in the left visual field. In a second presentation (test stimulus), the FOE was displaced either up or down at a distance set to threshold (75%) performance. Participants indicated the direction of positional change perceived by an appropriate keyboard button press and were instructed to respond as quickly and accurately as possible. Response time was measured as the time taken for the participant to press one of the decision keys on the keyboard following stimulus offset.
Statistical analysis of the results for each task was carried out using SPSS Statistics 20 (IBM, Armonk, NY) using repeated-measures ANOVA. The assumption of normal distribution was confirmed with Mauchly’s test of sphericity. If this assumption was violated, then the degrees of freedom were corrected to allow appropriate interpretation of the F value of the ANOVA. These corrections included the Greenhouse-Geisser when sphericity (ε) was reported as <0.75 and Huynh-Feldt correction when sphericity was >0.75.
RESULTS
Group averaged performance was expressed in terms of percent correct (pCorrect) for each of the TMS conditions, as well as for a baseline condition (when no TMS was administered while the participants performed the task). Inspection of Fig. 3 reveals that relative to all other TMS conditions, stimulation of MST/TO-2 results in a loss of performance in radial direction discrimination, whereas discrimination of FOE is impaired only for TMS applied to V3A. These effects are examined statistically below.
Fig. 3.

Average percent correct (pCorrect) data from experiment 1 and experiment 2. Bar charts showing average pCorrect (%) across experiment 1 (A) and experiment 2 (B). Error bars represent SE; *P < 0.05, **P < 0.01 significance.
As these tasks were designed to measure two different aspects of optic flow processing, the data were interrogated for any interactions using a two-way ANOVA, comparing the TMS site with tasks to investigate independence from one another. This analysis highlighted a significant interaction between the TMS site and the tasks that we examined in experiments 1 and 2 [F(3,48) = 5.98, P = 0.002]. Significant differences were also found across tasks [F(1,48) = 4.57, P = 0.038] and TMS sites [F(3,48) = 5.08, P = 0.004]. This shows that results were significantly different between tasks and TMS conditions.
To examine the main effect of the TMS site on performance for each task separately, repeated-measures ANOVA was also used. For the radial motion direction discrimination, a significant effect of TMS condition on task performance was found [F(3,18) = 13.55, P < 0.001]. Pair-wise comparisons (Bonferroni corrected) for this task indicated that this effect was due to significant differences existing between Baseline and MST/TO-2 (P = 0.018), Control and MST/TO-2 (P = 0.012), and crucially, V3A and MST/TO-2 (P = 0.015). All other comparisons failed to demonstrate any significant differences (Baseline vs. Control, P = 0.448; all other comparisons, P = 1.00; Fig. 3A). These results demonstrate that neural processing in area MST/TO-2 appears to be essential for normal levels of performance for the radial motion direction discrimination task. Conversely, disruption to neural activity in area V3A has no effect on performance levels for this task.
Similar analyses applied to the data obtained in the FOE displacement experiment demonstrated show the opposite effects for areas MST/TO-2 and V3A. There is a significant main effect of the TMS site on performance on the FOE task [F(3,18) = 15.36, P < 0.001]. Subsequent pair-wise comparisons (Bonferroni corrected) highlighted significant differences between Baseline and V3A (P = 0.005), Control and V3A (P = 0.019), and MST/TO-2 and V3A (P = 0.031), highlighting the key role of V3A in FOE processing. No other comparisons were found to be significantly different (all other comparisons equated to P = 1.00; Fig. 3B).
Average response times are plotted in Fig. 4 and were analyzed to investigate for potential differences between TMS conditions. Repeated-measures ANOVA demonstrated no significant effects of the TMS site on speed of response for experiment 1 [F(3,18) = 0.80, P = 0.509] or experiment 2 [F(3,18) = 2.15, P = 0.129]. If subjects responded quickly at the cost of accuracy, then this could have confounded our accuracy results. To investigate this, pCorrect was correlated against response times (Table 2). Evidence of a positive correlation would imply that a speed-accuracy trade-off may have been present, whereas evidence of a negative correlation would suggest that slow responses were potentially due to more difficult trials.
Fig. 4.

Average response time data from experiment 1 and experiment 2. Bar charts showing average response time (s) across experiment 1 (A) and experiment 2 (B). Error bars represent SE.
Table 2.
Descriptive statistics for percent correct (%) and response times (s)
| Means | SD | |
|---|---|---|
| Experiment 1, radial | ||
| Percent correct, % | 76.86 | 8.15 |
| Response times, s | 0.73 | 0.28 |
| Experiment 2, FOE | ||
| Percent correct, % | 73.25 | 7.32 |
| Response times, s | 0.65 | 0.20 |
Means and SDs for percent correct and response times for the correlational analysis.
The data are plotted in Fig. 5, and Pearson R analyses identified a moderate negative correlation between pCorrect and response time for experiment 1 (r = −0.36, n = 28, P = 0.061) but no significant relationship for experiment 2 (r = −0.20, n = 28, P = 0.305). It is important to note that whereas one of the correlations is not significant, and the other approaches significance, they are both negative, indicating that if a relationship between the speed of response and accuracy exists, then it is one that is in the opposite direction of a “speed-accuracy” trade-off. Therefore, we are confident that the results of our analysis of the accuracy data (above) are not confounded by reaction times, as there is no evidence for faster response times resulting in poorer performance.
Fig. 5.

Correlational data for percent correct and response time from experiment 1 and experiment 2. A scatter plot showing relationship between percent correct and response time across experiment 1 (Radial) and experiment 2 (FOE).
DISCUSSION
In this study, we have demonstrated that the perception of different attributes of optic flow stimuli, namely, radial direction and FOE position, is dependent on neural activity within separate visual areas within the human cerebral cortex. We have established that there is a direct causal relationship between neural activity in area MST/TO-2, a subdivision of the hV5/MT+ complex, and the perception of the direction of radial motion. In addition, a similar dependency exists between neural activity in area V3A and the perception of FOE position. Importantly, we have shown a double dissociation between the involvement of visual areas V3A and MST/TO-2 in the analysis of these different aspects of optic flow stimuli, which indicates that the processing of FOE position and radial motion direction occurs independently of one another within these separate cortical areas.
Expanding (radial) motion is naturally apparent when an individual moves forward through space. This optic flow constitutes a rich source of visual cues that can facilitate navigation through external environments. In static environments, analysis of the FOE can provide information about the direction in which the individual is traveling (Warren and Hannon 1988). However, in more dynamic surroundings, the importance of global directional properties of optic flow in the process of “flow parsing” has also been highlighted (Warren and Rushton 2009). This process allows signals that are generated by self-movement to be discounted to identify the motion of objects within a scene that are moving independently. This complimentary visual information is essential for the tracking and avoidance of objects during self-motion. Appropriate interpretation of all of these cues is essential for successful navigation of the external world. Of course, in addition to visual, there are a number of other nonvisual cues that contribute to the perception of self-motion (Bradley et al. 1996; Cardin and Smith 2010; Fetsch et al. 2007; Gu et al. 2006; Kaminiarz et al. 2014; Royden et al. 1992). However, if we restrict our consideration to visual cues only, then the importance of optic flow appears to be highlighted by the fact that many cortical areas are responsive to such stimuli. Human neuroimaging studies have shown that hV5/MT+, V3A, V3B, V6, ventral intraparietal area (VIP), and the cingulate sulcus visual area (CSv) are all activated by optic flow (Cardin et al. 2012; Morrone et al. 2000; Pitzalis et al. 2013a, 2013b; Smith et al. 2006; Wall and Smith 2008). The stimuli used in these and other behavioral [e.g., Warren and Hannon (1988)] and neurophysiological [e.g., Zhang and Britten (2010)] studies into the mechanisms of self-motion guidance and perception have typically used centrally viewed, large-field optic flow stimuli. In comparison, the stimuli used in this study are spatially constrained and as a result, are unlikely to provide cues for the guidance of self-motion that are as powerful as those derived from more extensive optic flow fields. The small-aperture stimuli lack the richness of all of the visual, as well as nonvisual, cues that are provided by optic flow stimuli, observed under more naturalistic viewing conditions. For example, there is no sense of “vection”—the perception of self-movement through space—generated by these small-field stimuli. However, despite their relative sparseness, the aperture stimuli used in these experiments are sufficient to reveal the existence of important functional differences between the earliest stages of this processing network, with areas MST/TO-2 and V3A playing different roles in the analysis of radial flow direction and FOE position, respectively. This functional segregation is important in that it may help to explain results from neuropsychological case studies. Beardsley and Vaina (2005), for example, examined a patient (GZ) who suffered damage to her right hV5/MT+ complex. As a result of this lesion, GZ was impaired in her ability to discriminate the radial direction of optic flow stimuli, but her ability to determine the position of the FOE remained intact. The results presented here raise the possibility that this preservation of function is due to the fact that the neural processing that underpins the perception of these different attributes of optic flow is localized within separate cortical locations. The preservation of FOE perception may be attributable to the fact that if V3A remains intact in patient GZ, then this would be sufficient to support the perception of the FOE position, even in the absence of hV5/MT+.
In the monkey brain, investigation of the physiological substrates of self-motion perception has centered on area MST (Britten 2008). Neurons in the dorsal region of MST (MSTd) are tuned to complex patterns of optic flow that result from self-motion (Duffy and Wurtz 1991a, 1991b, 1995; Saito et al. 1986; Tanaka et al. 1986, 1989). Importantly, a causal dependency has been firmly established between neural activity in this area and the perception of heading direction in monkeys (Britten and van Wezel 1998; Britten and Van Wezel 2002; Gu et al. 2006, 2007, 2008, 2012; Yu et al. 2017). The lack of any disruption to FOE positional judgments, when the human homolog of MST is disrupted by TMS, therefore presents something of an inconsistency between human and monkey data. A possible explanation for the lack of effect reported here might lie in our fMRI localizer paradigms for MST/TO-2. It is conceivable that whereas neurons in MST/TO-2 are activated by ipsilateral stimuli, some will have much stronger response biases to contralateral stimuli. This potentially might lead to some voxels that are genuinely part of MST/TO-2 being misclassified as falling within the MT/TO-1 subdivision of hV5/MT+. This could feasibly lead to an underestimation of the extent of MST/TO-2 and failure to localize it properly. However, we consider this unlikely for a number of reasons. First, previous studies have demonstrated a high degree of correspondence between functional data and population receptive field maps (Amano et al. 2009), which gives us confidence that the localizer used here is an appropriate method for identifying MT/TO-1 and MST/TO-2. Second, the Talairach coordinates from our center-of-mass target points for MT/TO-1 and MST/TO-2 are similar to those previously reported for these regions (Dukelow et al. 2001; Kolster et al. 2010). Finally, the use of the current fMRI localizers has previously enabled successful, functional differentiation between MT/TO-1 and MST/TO-2, where selective effects have been demonstrated for radial motion direction discrimination tasks following the application of TMS to these regions (Strong et al. 2017).
The lack of any effect of disruption to MST/TO-2 of FOE positional judgments would appear to suggest that human MST/TO-2 may not be critical for the perception of the direction of self-motion. This is in agreement with studies that have shown human MST/TO-2 to be responsive to optic flow stimuli, regardless of whether they were compatible with the perception of self-motion (Wall and Smith 2008). However, an alternative explanation for the apparent lack of involvement of human MST/TO-2 in FOE judgments might lie in the fact that the task in experiment 2 requires the detection of a change in FOE position. In the macaque, MSTd neurons are insensitive to temporal changes in heading direction signaled by FOE positional shifts (Paolini et al. 2000). Human MST/TO-2, although clearly responsive to optic flow stimuli (Smith et al. 2006; Strong et al. 2017; Wall et al. 2008), shows a similar lack of sensitivity to changes in FOE position (Furlan et al. 2014). The detection of such changes is important in that they signal shifts in heading direction as opposed to providing information relating to instantaneous heading direction (Furlan et al. 2014). Results from this study implicate V3A as an area that is critical for signaling these transient changes in FOE position. This is consistent with previous findings. For example, studies by Cardin et al. (2012) and Koyama et al. (2005) have both shown that fMRI signal increases in V3A are elicited by changes in position of the FOE. Furthermore, this function may form part of a wider role in the analysis and prediction of the position of moving objects that have been proposed for area V3A (Maus et al. 2010).
V3A has been given relatively little consideration in the context of self-motion perception in the monkey brain [see Britten (2008)]. This may be due to differences in the role of area V3A across the species (Anzai et al. 2011; Galletti et al. 1990; Gaska et al. 1988; Girard et al. 1991; Orban et al. 2003; Tootell et al. 1997; Tsao et al. 2003). In humans, area V3A has been shown to be highly responsive to moving stimuli forming a much more prominent constituent of the cortical network that exists for motion processing (McKeefry et al. 2008, 2010; Tootell et al. 1997). Nonetheless, V3A is still considered subordinate to area hV5/MT+ in this motion-processing hierarchy [see Britten (2008) and Felleman and Van Essen (1991)]. However, the results presented here challenge this strict hierarchy by showing that neural activity in V3A can support the perception of specific attributes of moving stimuli, even in the absence of a normally functioning hV5/MT+. The analysis of optic flow does not simply occur in a serial fashion, with information passing from V3A to hV5/MT+ for further processing. Instead, our results, consistent with neuropsychological reports, point to the existence of parallel processing pathways for radial direction and FOE positional change. MST/TO-2 and V3A would appear to form important initial stages in the processing of these two key attributes of optic flow stimuli that can ultimately be used in flow parsing and signal heading direction, both of which make important contributions to the guidance of self-movement.
The notion of multiple motion processing pathways emanating from early visual areas is compatible with previous studies (Pitzalis et al. 2010, 2013a, 2013c, 2015) but carries with it the implication that signals from these pathways must be combined at some later stage. In both humans and monkeys, other “higher” brain areas have been identified as possible subsequent stages in the perception of self-motion. One such area is V6, which is found in the medial parieto-occipital sulcus and is thought to be involved in the analysis of self-motion relative to object motion in dynamic environments (Cardin et al. 2012; Cardin and Smith 2011; Fan et al. 2015; Fischer et al. 2012; Galletti et al. 1990, 2001; Pitzalis et al. 2010, 2013a, 2013b, 2013c, 2015; Shipp et al. 1998). V6 does not appear to exhibit sensitivity to changes in FOE position (Cardin et al. 2012; Furlan et al. 2014) and as a result, is considered more important in flow parsing for the purposes of object avoidance during self-motion, rather than heading-direction analysis per se (Cardin et al. 2012). Another key region is the polysensory VIP. In monkeys, VIP contains neurons that have very similar response properties to those found in MSTd and are important in the encoding of heading direction (Bremmer et al. 2002; Schaafsma and Duysens 1996; Zhang and Britten 2010, 2011). The putative human homolog of VIP has also been shown to be responsive to egomotion-compatible optic flow and changes in FOE position (Furlan et al. 2014; Wall and Smith 2008). In the human brain, VIP and another cortical region found on the cingulate gyrus—CSv—have been identified as key areas in a pathway involved in the analysis of instantaneous changes in FOE position as a means of computing heading direction (Furlan et al. 2014). The extent to which neural activity in these higher human cortical areas can be causally related to flow-parsing mechanisms or to the perception of heading direction remains to be determined. However, results from this study would suggest that at a relatively early stage, there is evidence of segregated processing for FOE position and radial motion direction in optic flow stimuli. This segregation may persist in areas V6, VIP, and CSv as a means to support the different requirements for the analysis and guidance of self-motion.
GRANTS
Support for this work was funded by the Biotechnology and Biological Sciences Research Council (BBSRC; Grant B/N003012/1).
DISCLOSURES
No conflicts of interest, financial or otherwise, are declared by the authors.
AUTHOR CONTRIBUTIONS
S.L.S., E.H.S., A.B.M., and D.J.M. conceived and designed research; S.L.S., A.D.G., and D.J.M. performed experiments; S.L.S. and A.D.G. analyzed data; S.L.S. and D.J.M. interpreted results of experiments; S.L.S. prepared figures; S.L.S., E.H.S., A.D.G., A.B.M., and D.J.M. edited and revised manuscript; D.J.M. drafted manuscript; D.J.M. approved final version of manuscript.
ACKNOWLEDGMENTS
The authors thank William McIlhagga for comments on previous versions of this paper.
REFERENCES
- Amano K, Wandell BA, Dumoulin SO. Visual field maps, population receptive field sizes, and visual field coverage in the human MT+ complex. J Neurophysiol 102: 2704–2718, 2009. doi: 10.1152/jn.00102.2009. [DOI] [PMC free article] [PubMed] [Google Scholar]
- Anzai A, Chowdhury SA, DeAngelis GC. Coding of stereoscopic depth information in visual areas V3 and V3A. J Neurosci 31: 10270–10282, 2011. doi: 10.1523/JNEUROSCI.5956-10.2011. [DOI] [PMC free article] [PubMed] [Google Scholar]
- Bartels A, Zeki S, Logothetis NK. Natural vision reveals regional specialization to local motion and to contrast-invariant, global flow in the human brain. Cereb Cortex 18: 705–717, 2008. doi: 10.1093/cercor/bhm107. [DOI] [PubMed] [Google Scholar]
- Beardsley SA, Vaina LM. How can a patient blind to radial motion discriminate shifts in the center-of-motion? J Comput Neurosci 18: 55–66, 2005. doi: 10.1007/s10827-005-5473-z. [DOI] [PubMed] [Google Scholar]
- Bradley DC, Maxwell M, Andersen RA, Banks MS, Shenoy KV. Mechanisms of heading perception in primate visual cortex. Science 273: 1544–1547, 1996. doi: 10.1126/science.273.5281.1544. [DOI] [PubMed] [Google Scholar]
- Bremmer F, Duhamel JR, Ben Hamed S, Graf W. Heading encoding in the macaque ventral intraparietal area (VIP). Eur J Neurosci 16: 1554–1568, 2002. doi: 10.1046/j.1460-9568.2002.02207.x. [DOI] [PubMed] [Google Scholar]
- Britten KH. Mechanisms of self-motion perception. Annu Rev Neurosci 31: 389–410, 2008. doi: 10.1146/annurev.neuro.29.051605.112953. [DOI] [PubMed] [Google Scholar]
- Britten KH, Van Wezel RJ. Area MST and heading perception in macaque monkeys. Cereb Cortex 12: 692–701, 2002. doi: 10.1093/cercor/12.7.692. [DOI] [PubMed] [Google Scholar]
- Britten KH, van Wezel RJ. Electrical microstimulation of cortical area MST biases heading perception in monkeys. Nat Neurosci 1: 59–63, 1998. doi: 10.1038/259. [DOI] [PubMed] [Google Scholar]
- Cardin V, Hemsworth L, Smith AT. Adaptation to heading direction dissociates the roles of human MST and V6 in the processing of optic flow. J Neurophysiol 108: 794–801, 2012. doi: 10.1152/jn.00002.2012. [DOI] [PMC free article] [PubMed] [Google Scholar]
- Cardin V, Smith AT. Sensitivity of human visual and vestibular cortical regions to egomotion-compatible visual stimulation. Cereb Cortex 20: 1964–1973, 2010. doi: 10.1093/cercor/bhp268. [DOI] [PMC free article] [PubMed] [Google Scholar]
- Cardin V, Smith AT. Sensitivity of human visual cortical area V6 to stereoscopic depth gradients associated with self-motion. J Neurophysiol 106: 1240–1249, 2011. doi: 10.1152/jn.01120.2010. [DOI] [PMC free article] [PubMed] [Google Scholar]
- Claeys KG, Lindsey DT, De Schutter E, Orban GA. A higher order motion region in human inferior parietal lobule: evidence from fMRI. Neuron 40: 631–642, 2003. doi: 10.1016/S0896-6273(03)00590-7. [DOI] [PubMed] [Google Scholar]
- Culham J, He S, Dukelow S, Verstraten FAJ. Visual motion and the human brain: what has neuroimaging told us? Acta Psychol (Amst) 107: 69–94, 2001. doi: 10.1016/S0001-6918(01)00022-1. [DOI] [PubMed] [Google Scholar]
- DeYoe EA, Carman GJ, Bandettini P, Glickman S, Wieser J, Cox R, Miller D, Neitz J. Mapping striate and extrastriate visual areas in human cerebral cortex. Proc Natl Acad Sci USA 93: 2382–2386, 1996. doi: 10.1073/pnas.93.6.2382. [DOI] [PMC free article] [PubMed] [Google Scholar]
- Duffy CJ. MST neurons respond to optic flow and translational movement. J Neurophysiol 80: 1816–1827, 1998. [DOI] [PubMed] [Google Scholar]
- Duffy CJ, Wurtz RH. Response of monkey MST neurons to optic flow stimuli with shifted centers of motion. J Neurosci 15: 5192–5208, 1995. [DOI] [PMC free article] [PubMed] [Google Scholar]
- Duffy CJ, Wurtz RH. Sensitivity of MST neurons to optic flow stimuli. I. A continuum of response selectivity to large-field stimuli. J Neurophysiol 65: 1329–1345, 1991a. [DOI] [PubMed] [Google Scholar]
- Duffy CJ, Wurtz RH. Sensitivity of MST neurons to optic flow stimuli. II. Mechanisms of response selectivity revealed by small-field stimuli. J Neurophysiol 65: 1346–1359, 1991b. [DOI] [PubMed] [Google Scholar]
- Dukelow SP, DeSouza JF, Culham JC, van den Berg AV, Menon RS, Vilis T. Distinguishing subregions of the human MT+ complex using visual fields and pursuit eye movements. J Neurophysiol 86: 1991–2000, 2001. [DOI] [PubMed] [Google Scholar]
- Dumoulin SO, Bittar RG, Kabani NJ, Baker CL, LeGoualher G, Pike GB, Evans AC. A new anatomical landmark for reliable identification of human area V5/MT: a quantitative analysis of sulcal patterning. Cereb Cortex 10: 454–463, 2000. [DOI] [PubMed] [Google Scholar]
- Eifuku S, Wurtz RH. Response to motion in extrastriate area MSTl: center-surround interactions. J Neurophysiol 80: 282–296, 1998. [DOI] [PubMed] [Google Scholar]
- Engel SA, Glover GH, Wandell BA. Retinotopic organization in human visual cortex and the spatial precision of functional MRI. Cereb Cortex 7: 181–192, 1997. doi: 10.1093/cercor/7.2.181. [DOI] [PubMed] [Google Scholar]
- Fan RH, Liu S, DeAngelis GC, Angelaki DE. Heading tuning in macaque area V6. J Neurosci 35: 16303–16314, 2015. doi: 10.1523/JNEUROSCI.2903-15.2015. [DOI] [PMC free article] [PubMed] [Google Scholar]
- Felleman DJ, Van Essen DC. Distributed hierarchical processing in the primate cerebral cortex. Cereb Cortex 1: 1–47, 1991. doi: 10.1093/cercor/1.1.1. [DOI] [PubMed] [Google Scholar]
- Felleman DJ, Van Essen DC. Receptive field properties of neurons in area V3 of macaque monkey extrastriate cortex. J Neurophysiol 57: 889–920, 1987. [DOI] [PubMed] [Google Scholar]
- Fetsch CR, Wang S, Gu Y, Deangelis GC, Angelaki DE. Spatial reference frames of visual, vestibular, and multimodal heading signals in the dorsal subdivision of the medial superior temporal area. J Neurosci 27: 700–712, 2007. doi: 10.1523/JNEUROSCI.3553-06.2007. [DOI] [PMC free article] [PubMed] [Google Scholar]
- Fischer E, Bülthoff HH, Logothetis NK, Bartels A. Human areas V3A and V6 compensate for self-induced planar visual motion. Neuron 73: 1228–1240, 2012. doi: 10.1016/j.neuron.2012.01.022. [DOI] [PubMed] [Google Scholar]
- Furlan M, Wann JP, Smith AT. A representation of changing heading direction in human cortical areas pVIP and CSv. Cereb Cortex 24: 2848–2858, 2014. doi: 10.1093/cercor/bht132. [DOI] [PubMed] [Google Scholar]
- Galletti C, Battaglini PP, Fattori P. ‘Real-motion’ cells in area V3A of macaque visual cortex. Exp Brain Res 82: 67–76, 1990. doi: 10.1007/BF00230838. [DOI] [PubMed] [Google Scholar]
- Galletti C, Gamberini M, Kutz DF, Fattori P, Luppino G, Matelli M. The cortical connections of area V6: an occipito-parietal network processing visual information. Eur J Neurosci 13: 1572–1588, 2001. doi: 10.1046/j.0953-816x.2001.01538.x. [DOI] [PubMed] [Google Scholar]
- Gaska JP, Jacobson LD, Pollen DA. Spatial and temporal frequency selectivity of neurons in visual cortical area V3A of the macaque monkey. Vision Res 28: 1179–1191, 1988. doi: 10.1016/0042-6989(88)90035-1. [DOI] [PubMed] [Google Scholar]
- Gibson JJ. The Perception of the Visual World. Boston, MA: Houghton Mifflin, 1950. [Google Scholar]
- Girard P, Salin PA, Bullier J. Visual activity in areas V3a and V3 during reversible inactivation of area V1 in the macaque monkey. J Neurophysiol 66: 1493–1503, 1991. [DOI] [PubMed] [Google Scholar]
- Gu Y, Angelaki DE, Deangelis GC. Neural correlates of multisensory cue integration in macaque MSTd. Nat Neurosci 11: 1201–1210, 2008. doi: 10.1038/nn.2191. [DOI] [PMC free article] [PubMed] [Google Scholar]
- Gu Y, DeAngelis GC, Angelaki DE. A functional link between area MSTd and heading perception based on vestibular signals. Nat Neurosci 10: 1038–1047, 2007. doi: 10.1038/nn1935. [DOI] [PMC free article] [PubMed] [Google Scholar]
- Gu Y, Deangelis GC, Angelaki DE. Causal links between dorsal medial superior temporal area neurons and multisensory heading perception. J Neurosci 32: 2299–2313, 2012. doi: 10.1523/JNEUROSCI.5154-11.2012. [DOI] [PMC free article] [PubMed] [Google Scholar]
- Gu Y, Watkins PV, Angelaki DE, DeAngelis GC. Visual and nonvisual contributions to three-dimensional heading selectivity in the medial superior temporal area. J Neurosci 26: 73–85, 2006. doi: 10.1523/JNEUROSCI.2356-05.2006. [DOI] [PMC free article] [PubMed] [Google Scholar]
- Huk AC, Dougherty RF, Heeger DJ. Retinotopy and functional subdivision of human areas MT and MST. J Neurosci 22: 7195–7205, 2002. [DOI] [PMC free article] [PubMed] [Google Scholar]
- Kaminiarz A, Schlack A, Hoffmann KP, Lappe M, Bremmer F. Visual selectivity for heading in the macaque ventral intraparietal area. J Neurophysiol 112: 2470–2480, 2014. doi: 10.1152/jn.00410.2014. [DOI] [PubMed] [Google Scholar]
- Kolster H, Peeters R, Orban GA. The retinotopic organization of the human middle temporal area MT/V5 and its cortical neighbors. J Neurosci 30: 9801–9820, 2010. doi: 10.1523/JNEUROSCI.2069-10.2010. [DOI] [PMC free article] [PubMed] [Google Scholar]
- Komatsu H, Wurtz RH. Modulation of pursuit eye movements by stimulation of cortical areas MT and MST. J Neurophysiol 62: 31–47, 1989. [DOI] [PubMed] [Google Scholar]
- Komatsu H, Wurtz RH. Relation of cortical areas MT and MST to pursuit eye movements. I. Localization and visual properties of neurons. J Neurophysiol 60: 580–603, 1988. [DOI] [PubMed] [Google Scholar]
- Koyama S, Sasaki Y, Andersen GJ, Tootell RBH, Matsuura M, Watanabe T. Separate processing of different global-motion structures in visual cortex is revealed by FMRI. Curr Biol 15: 2027–2032, 2005. doi: 10.1016/j.cub.2005.10.069. [DOI] [PubMed] [Google Scholar]
- Lagae L, Maes H, Raiguel S, Xiao D-K, Orban GA. Responses of macaque STS neurons to optic flow components: a comparison of areas MT and MST. J Neurophysiol 71: 1597–1626, 1994. [DOI] [PubMed] [Google Scholar]
- Larsson J, Heeger DJ. Two retinotopic visual areas in human lateral occipital cortex. J Neurosci 26: 13128–13142, 2006. doi: 10.1523/JNEUROSCI.1657-06.2006. [DOI] [PMC free article] [PubMed] [Google Scholar]
- Lorberbaum JP, Wassermann E. Safety concerns of TMS. In: Transcranial Magnetic Stimulation in Neuropsychiatry, edited by George MS and Belmaker RH. Washington, DC: American Psychiatric, 2000, p. 141–161. [Google Scholar]
- Maus GW, Weigelt S, Nijhawan R, Muckli L. Does area V3A predict positions of moving objects? Front Psychol 1: 186, 2010. doi: 10.3389/fpsyg.2010.00186. [DOI] [PMC free article] [PubMed] [Google Scholar]
- McKeefry DJ, Burton MP, Morland AB. The contribution of human cortical area V3A to the perception of chromatic motion: a transcranial magnetic stimulation study. Eur J Neurosci 31: 575–584, 2010. doi: 10.1111/j.1460-9568.2010.07095.x. [DOI] [PubMed] [Google Scholar]
- McKeefry DJ, Burton MP, Vakrou C, Barrett BT, Morland AB. Induced deficits in speed perception by transcranial magnetic stimulation of human cortical areas V5/MT+ and V3A. J Neurosci 28: 6848–6857, 2008. doi: 10.1523/JNEUROSCI.1287-08.2008. [DOI] [PMC free article] [PubMed] [Google Scholar]
- McKeefry DJ, Watson JD, Frackowiak RSJ, Fong K, Zeki S. The activity in human areas V1/V2, V3, and V5 during the perception of coherent and incoherent motion. Neuroimage 5: 1–12, 1997. doi: 10.1006/nimg.1996.0246. [DOI] [PubMed] [Google Scholar]
- Mikami A, Newsome WT, Wurtz RH. Motion selectivity in macaque visual cortex. I. Mechanisms of direction and speed selectivity in extrastriate area MT. J Neurophysiol 55: 1308–1327, 1986. [DOI] [PubMed] [Google Scholar]
- Morrone MC, Tosetti M, Montanaro D, Fiorentini A, Cioni G, Burr DC. A cortical area that responds specifically to optic flow, revealed by fMRI. Nat Neurosci 3: 1322–1328, 2000. doi: 10.1038/81860. [DOI] [PubMed] [Google Scholar]
- Orban GA, Fize D, Peuskens H, Denys K, Nelissen K, Sunaert S, Todd J, Vanduffel W. Similarities and differences in motion processing between the human and macaque brain: evidence from fMRI. Neuropsychologia 41: 1757–1768, 2003. doi: 10.1016/S0028-3932(03)00177-5. [DOI] [PubMed] [Google Scholar]
- Paolini M, Distler C, Bremmer F, Lappe M, Hoffmann KP. Responses to continuously changing optic flow in area MST. J Neurophysiol 84: 730–743, 2000. [DOI] [PubMed] [Google Scholar]
- Pitzalis S, Bozzacchi C, Bultrini A, Fattori P, Galletti C, Di Russo F. Parallel motion signals to the medial and lateral motion areas V6 and MT+. Neuroimage 67: 89–100, 2013a. doi: 10.1016/j.neuroimage.2012.11.022. [DOI] [PubMed] [Google Scholar]
- Pitzalis S, Fattori P, Galletti C. The functional role of the medial motion area V6. Front Behav Neurosci 6: 91, 2013b. doi: 10.3389/fnbeh.2012.00091. [DOI] [PMC free article] [PubMed] [Google Scholar]
- Pitzalis S, Fattori P, Galletti C. The human cortical areas V6 and V6A. Vis Neurosci 32: E007, 2015. doi: 10.1017/S0952523815000048. [DOI] [PubMed] [Google Scholar]
- Pitzalis S, Sdoia S, Bultrini A, Committeri G, Di Russo F, Fattori P, Galletti C, Galati G. Selectivity to translational egomotion in human brain motion areas. PLoS One 8: e60241, 2013c. doi: 10.1371/journal.pone.0060241. [DOI] [PMC free article] [PubMed] [Google Scholar]
- Pitzalis S, Sereno MI, Committeri G, Fattori P, Galati G, Patria F, Galletti C. Human V6: the medial motion area. Cereb Cortex 20: 411–424, 2010. doi: 10.1093/cercor/bhp112. [DOI] [PMC free article] [PubMed] [Google Scholar]
- Rossi S, Hallett M, Rossini PM, Pascual-Leone A; Safety of TMS Consensus Group . Safety, ethical considerations, and application guidelines for the use of transcranial magnetic stimulation in clinical practice and research. Clin Neurophysiol 120: 2008–2039, 2009. doi: 10.1016/j.clinph.2009.08.016. [DOI] [PMC free article] [PubMed] [Google Scholar]
- Royden CS, Banks MS, Crowell JA. The perception of heading during eye movements. Nature 360: 583–585, 1992. doi: 10.1038/360583a0. [DOI] [PubMed] [Google Scholar]
- Saito H, Yukie M, Tanaka K, Hikosaka K, Fukada Y, Iwai E. Integration of direction signals of image motion in the superior temporal sulcus of the macaque monkey. J Neurosci 6: 145–157, 1986. [DOI] [PMC free article] [PubMed] [Google Scholar]
- Schaafsma SJ, Duysens J. Neurons in the ventral intraparietal area of awake macaque monkey closely resemble neurons in the dorsal part of the medial superior temporal area in their responses to optic flow patterns. J Neurophysiol 76: 4056–4068, 1996. [DOI] [PubMed] [Google Scholar]
- Seiffert AE, Somers DC, Dale AM, Tootell RB. Functional MRI studies of human visual motion perception: texture, luminance, attention and after-effects. Cereb Cortex 13: 340–349, 2003. doi: 10.1093/cercor/13.4.340. [DOI] [PubMed] [Google Scholar]
- Sereno MI, Dale AM, Reppas JB, Kwong KK, Belliveau JW, Brady TJ, Rosen BR, Tootell RB. Borders of multiple human visual areas in humans revealed by functional MRI. Science 268: 889–893, 1995. doi: 10.1126/science.7754376. [DOI] [PubMed] [Google Scholar]
- Shipp S, Blanton M, Zeki S. A visuo-somatomotor pathway through superior parietal cortex in the macaque monkey: cortical connections of areas V6 and V6A. Eur J Neurosci 10: 3171–3193, 1998. doi: 10.1046/j.1460-9568.1998.00327.x. [DOI] [PubMed] [Google Scholar]
- Silson EH, McKeefry DJ, Rodgers J, Gouws AD, Hymers M, Morland AB. Specialized and independent processing of orientation and shape in visual field maps LO1 and LO2. Nat Neurosci 16: 267–269, 2013. doi: 10.1038/nn.3327. [DOI] [PubMed] [Google Scholar]
- Smith AT, Greenlee MW, Singh KD, Kraemer FM, Hennig J. The processing of first- and second-order motion in human visual cortex assessed by functional magnetic resonance imaging (fMRI). J Neurosci 18: 3816–3830, 1998. [DOI] [PMC free article] [PubMed] [Google Scholar]
- Smith AT, Wall MB, Williams AL, Singh KD. Sensitivity to optic flow in human cortical areas MT and MST. Eur J Neurosci 23: 561–569, 2006. doi: 10.1111/j.1460-9568.2005.04526.x. [DOI] [PubMed] [Google Scholar]
- Strong SL, Silson EH, Gouws AD, Morland AB, McKeefry DJ. A direct demonstration of functional differences between subdivisions of human V5/MT+. Cereb Cortex 27: 1–10, 2017. doi: 10.1093/cercor/bhw362. [DOI] [PMC free article] [PubMed] [Google Scholar]
- Tanaka K, Fukada Y, Saito HA. Underlying mechanisms of the response specificity of expansion/contraction and rotation cells in the dorsal part of the medial superior temporal area of the macaque monkey. J Neurophysiol 62: 642–656, 1989. [DOI] [PubMed] [Google Scholar]
- Tanaka K, Hikosaka K, Saito HA, Yukie M, Fukada Y, Iwai E. Analysis of local and wide-field movements in the superior temporal visual areas of the macaque monkey. J Neurosci 6: 134–144, 1986. [DOI] [PMC free article] [PubMed] [Google Scholar]
- Tanaka K, Saito H. Analysis of motion of the visual field by direction, expansion/contraction, and rotation cells clustered in the dorsal part of the medial superior temporal area of the macaque monkey. J Neurophysiol 62: 626–641, 1989. [DOI] [PubMed] [Google Scholar]
- Tanaka K, Sugita Y, Moriya M, Saito H. Analysis of object motion in the ventral part of the medial superior temporal area of the macaque visual cortex. J Neurophysiol 69: 128–142, 1993. [DOI] [PubMed] [Google Scholar]
- Tootell RB, Mendola JD, Hadjikhani NK, Ledden PJ, Liu AK, Reppas JB, Sereno MI, Dale AM. Functional analysis of V3A and related areas in human visual cortex. J Neurosci 17: 7060–7078, 1997. [DOI] [PMC free article] [PubMed] [Google Scholar]
- Tootell RB, Reppas JB, Kwong KK, Malach R, Born RT, Brady TJ, Rosen BR, Belliveau JW. Functional analysis of human MT and related visual cortical areas using magnetic resonance imaging. J Neurosci 15: 3215–3230, 1995. [DOI] [PMC free article] [PubMed] [Google Scholar]
- Tsao DY, Vanduffel W, Sasaki Y, Fize D, Knutsen TA, Mandeville JB, Wald LL, Dale AM, Rosen BR, Van Essen DC, Livingstone MS, Orban GA, Tootell RB. Stereopsis activates V3A and caudal intraparietal areas in macaques and humans. Neuron 39: 555–568, 2003. doi: 10.1016/S0896-6273(03)00459-8. [DOI] [PubMed] [Google Scholar]
- Vanduffel W, Fize D, Peuskens H, Denys K, Sunaert S, Todd JT, Orban GA. Extracting 3D from motion: differences in human and monkey intraparietal cortex. Science 298: 413–415, 2002. doi: 10.1126/science.1073574. [DOI] [PubMed] [Google Scholar]
- Wall MB, Lingnau A, Ashida H, Smith AT. Selective visual responses to expansion and rotation in the human MT complex revealed by functional magnetic resonance imaging adaptation. Eur J Neurosci 27: 2747–2757, 2008. doi: 10.1111/j.1460-9568.2008.06249.x. [DOI] [PubMed] [Google Scholar]
- Wall MB, Smith AT. The representation of egomotion in the human brain. Curr Biol 18: 191–194, 2008. doi: 10.1016/j.cub.2007.12.053. [DOI] [PubMed] [Google Scholar]
- Warren PA, Rushton SK. Optic flow processing for the assessment of object movement during ego movement. Curr Biol 19: 1555–1560, 2009. doi: 10.1016/j.cub.2009.07.057. [DOI] [PubMed] [Google Scholar]
- Warren WH Jr, Hannon DJ. Direction of self-motion is perceived from optical flow. Nature 336: 162–163, 1988. doi: 10.1038/336162a0. [DOI] [Google Scholar]
- Wassermann EM. Risk and safety of repetitive transcranial magnetic stimulation: report and suggested guidelines from the International Workshop on the Safety of Repetitive Transcranial Magnetic Stimulation, June 5-7, 1996. Electroencephalogr Clin Neurophysiol 108: 1–16, 1998. doi: 10.1016/S0168-5597(97)00096-8. [DOI] [PubMed] [Google Scholar]
- Watson JD, Myers R, Frackowiak RS, Hajnal JV, Woods RP, Mazziotta JC, Shipp S, Zeki S. Area V5 of the human brain: evidence from a combined study using positron emission tomography and magnetic resonance imaging. Cereb Cortex 3: 79–94, 1993. doi: 10.1093/cercor/3.2.79. [DOI] [PubMed] [Google Scholar]
- Yu X, Hou H, Spillmann L, Gu Y. Causal evidence of motion signals in macaque middle temporal area weighted-pooled for global heading perception. Cereb Cortex, 2017. doi: 10.1093/cercor/bhw402. [DOI] [PubMed] [Google Scholar]
- Zeki S, Watson JD, Lueck CJ, Friston KJ, Kennard C, Frackowiak RSJ. A direct demonstration of functional specialization in human visual cortex. J Neurosci 11: 641–649, 1991. [DOI] [PMC free article] [PubMed] [Google Scholar]
- Zhang T, Britten KH. Parietal area VIP causally influences heading perception during pursuit eye movements. J Neurosci 31: 2569–2575, 2011. doi: 10.1523/JNEUROSCI.5520-10.2011. [DOI] [PMC free article] [PubMed] [Google Scholar]
- Zhang T, Britten KH. The responses of VIP neurons are sufficiently sensitive to support heading judgments. J Neurophysiol 103: 1865–1873, 2010. doi: 10.1152/jn.00401.2009. [DOI] [PMC free article] [PubMed] [Google Scholar]