Abstract
Background:
In many countries gastric cancer has the highest incidence among the gastrointestinal cancers and is the second most common cancer in Iran. The aim of this study was to identify and map high risk gastric cancer regions at the county-level in Iran.
Methods:
In this study we analyzed gastric cancer data for Iran in the years 2003-2010. Area-to-area Poisson kriging and Besag, York and Mollie (BYM) spatial models were applied to smoothing the standardized incidence ratios of gastric cancer for the 373 counties surveyed in this study. The two methods were compared in term of accuracy and precision in identifying high risk regions.
Result:
The highest smoothed standardized incidence rate (SIR) according to area-to-area Poisson kriging was in Meshkinshahr county in Ardabil province in north-western Iran (2.4, SD=0.05), while the highest smoothed standardized incidence rate (SIR) according to the BYM model was in Ardabil, the capital of that province (2.9, SD=0.09).
Conclusion:
Both methods of mapping, ATA Poisson kriging and BYM, showed the gastric cancer incidence rate to be highest in north and north-west Iran. However, area-to-area Poisson kriging was more precise than the BYM model and required less smoothing. According to the results obtained, preventive measures and treatment programs should be focused on particular counties of Iran.
Keywords: Gastric cancer, ATA poisson kriging, spatial bayesian analysis, Iran
Introduction
Cancer mortality and incidence maps are used by public health officials to identify areas of excess and to guide surveillance and control activities (Mungiole et al., 1999). Gastric cancer is the fifth most common cancer and third cancer leading to death in the world. Seventy percent of gastric cancer cases occur in the developing countries, with a higher incidence in men compared with women (International Agency for Research on Cancer All Cancers, 2012).
Iran is a country in South-Western Asia in the Middle East area with a population of about 70,000,000 during the years 2000-2010. Cancer is the third cause of mortality after car accident and cardiovascular disease in Iran, so it is an important problem in public health in this country (Mousavi et al., 2008). According to National Cancer Registry Report in 2009 in Iran, number of cancer mortality has increased during the previous two decades in this country. Since this disease is prevalent in the elderly population and population of Iran is tending to senility, the incidence of this disease is on increase in Iran (Hajian et al., 2003).
About half of the common cancers are related to gastrointestinal ones in Iran and gastric cancer has the second incidence ratio among all of the cancers. This is the most common cancer among men and the third cancer in women after breast cancer and cervix cancer in this country (International Agency for Research on Cancer All Cancers, 2012).
Therefore, gastric cancer mapping for describing the geographical features of the risk of the disease, identifying unusual high risk areas of gastric cancer incidence, and providing updated and precise results until 2010 were the main aims of this study.
In this paper, to estimate smoothed SIRs, we fitted two different models:
1) Area-to-Area Poisson kriging: The counties of Iran vary in size, shape and population. Moreover, the area data used in this study was count data based on the Poisson distribution, so Area-to-Area Poisson kriging approach was used for estimating the parameters of the map. The Area-to-Area Poisson kriging approach is recommended for estimation of disease mapping parameters, since this method accounts for spatial support and pattern in irregular spatial area, leading to more precise and accurate estimates of the risk (Goovaerts, 2005; Goovaerts, 2006; Goovaerts et al., 2008).
2) The Besag, York and Molliemodel, is commonly used in epidemiological studies and can be implemented using public domain software (Besag et al., 1991).
ATA Poisson krigingin modeling accounts the spatial structure while BYM assumed that all counties have similar shapes and sizes, with a uniform population density. So, ATA approach makes less smoothing and is more precise than other approaches such as BYM model and point Poisson kriging that ignore the spatial support. In addition to BYM model which yields prediction variance that change mainly as a function of the predicted ratio, the Poisson kriging variance increases in large sparsely populated counties (Goovaerts and Gebreab, 2008).
Materials and Methods
The case of interest was gastric cancer patients registered between the years 2003-2010. According to the Iran statistical center reports, the population at risk was obtained from the census of 2006. Population was approximately stable during 2003-2010 but the geographical units are 373 counties with a variety of sizes and shapes. Recorded data on incident cases of cancer were obtained from Ministry of Health and Medical Education (in non-infectious diseases management center) of Iran. The major sources of data collection related to cancer were report from pathology laboratories, hospitals and radiology clinics. The data were collected according to the International Classification of Diseases (C16) in Iran.
Standardized incidence ratios by county were calculated using the direct method. In order to estimate the smoothed SIRs, we fitted BYM model using OpenBUGS version 3.2.3 a standard public domain package for Bayesian inference using Markov Chain Monte Carlo (MCMC) methods (Lunn et al., 2009; Lawson et al., 2003) and ATA Poisson Kriging using the public domain software “poisson-kriging.exe” described in (Goovaerts, 2005). ArcGIS 9.2 version (ESRI, Redlands, CA) was used for mapping the cases in the study area.
Poisson kriging model
The risk over a given county was a linear combination of the target county and the neighboring counties.

Where the weights λi (vα)were calculated according to the formula reported in [5]. Each county was represented by its centroid uα=(xα, yα). For a given number N of geographical units vα (e.g. counties), denote the observed patient rates (areal data) as z(vα) = d(vα)/n(vα), where we assumed that the number of registered patients d(vα) was a random variable following a Poisson distribution with one parameter given by the population size multiplied by local risk and n(vα) was the size of the population at risk (Goovaerts and Gebreab, 2008).
BYM model
BYM is one of the most popular hierarchical Bayesian models that incorporate random effects due to unstructured and spatially structured heterogeneity into the log-linear model for the relative risk. The BYM model is formulated as follows:
yi~Poisson (ei θi)
log (θi)~α+ui+vi
Where yi is the observed number of cancer cases in a geographic unit, i is assumed to follow a Poisson distribution with mean eiθi and α is an overall level of the relative risk, ui is the correlated heterogeneity, and vi is the uncorrelated heterogeneity, respectively. Methodological aspects of the Bayesian analysis applied to geographical mapping are reported in previous articles (Besag et al., 1991).
Results
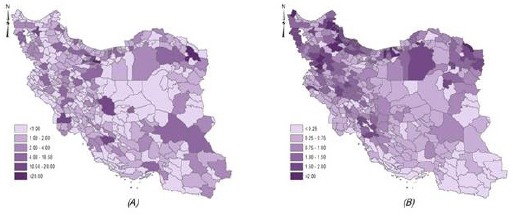
The population at risk (scaled 1/100,000) of 2006 as default for 373 counties from thirty one provinces in Iran is showed in Figure 1 (A). The standardized incidence ratio(SIR) of gastric cancer in each counties over 2003- 2010 is shown in Figure 1 (B). The highest standardized incidence ratio (SIR) of gastric cancer was seen in Sari county (2.9), the capital of Mazandaran province in the north of Iran and the overall SIRs mean was 0.8.
Figure 1.

Map Depicting General Population Density (scaled 1/100,000) (A); Map of the Standardized Incidence Ratios (SIRs) of Gastric Cancer in Iran 2003-2010 (B).
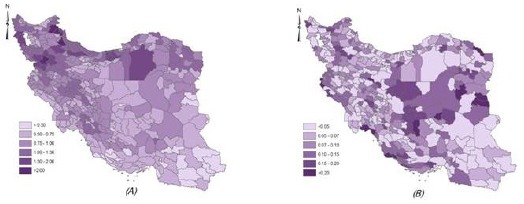
The smoothed SIRs using ATA Poisson kriging approach and corresponding prediction standard deviations are mapped in Figures 2(A) and 2(B) respectively. The smoothed SIRs mean was 0.88 and prediction standard deviations mean was 0.07. Figure 2(A) shows that the highest and lowest ratio of gastric cancer were in Meshkinshahr county in Ardabil province in the north-west of Iran (2.4, SD=0.05) and Sarbaz county in Sistan-Blochestan province in the south-east of Iran (0.01, SD=0.06), respectively. The range of standard deviation was (0.01, 0.25), as shown in Figure 2 (B).
Figure 2.

Map of the Smoothed SIRs of Gastric Cancer in Iran During 2003-2010 by ATA Poisson Kriging (A); Map of the Standard Deviations Estimated by ATA Poisson Kriging (B).
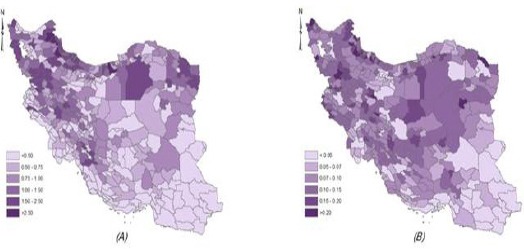
The smoothed SIRs using BYM model and corresponding estimated standard deviations are mapped in Figures 3(A) and 3(B), respectively. The smoothed SIRs mean was 0.8 and prediction standard deviations mean was 0.1. Figure 3(A) shows that the highest and lowest ratios of gastric cancer were in Ardabil, the capital of Ardabil province in north-western of Iran (2.9, SD=0.09) and Zahak county in Sistan-Blochestan province in the south-east of Iran (0.05, SD=0.03), respectively. The range of standard deviation was (0.01, 0.3) as shown in Figure 3(B).
Figure 3.

Map of the Smoothed SIRs of Gastric Cancer in Iran During 2003-2010 by BYM Model (A); Map of the Standard Deviations Estimated by BYM Model (B)
Discussion
Due to the lack of a national program to record and control cancers, particularly gastric cancer, the number of patients recorded in Iran is less than the actual cases. Nevertheless, because of the high prevalence of gastric cancer in Iran compared to the world, many studies have been done in the field of incidence, prevalence and mapping of gastric cancer in Iran.
Studies showed that although the global incidence of gastric cancer has decreased dramatically in recent decades (Malekzadeh et al., 2009), gastric cancer was more seen incidence in men (Almost double) than in women and there was a high incidence in the north and northwestern Iran than the other areas (Asmarian et al., 2012; Hajiani et al.,2006; Mousavi et al., 2001). Also, clustering the incidence of gastric cancer in 2004-2008 in the provincial-level (Kavousi et al., 2014) and in county-level in 2010(Soleimani et al., 2015), shows that north and north-west were high risk clusters. Ardebil province in Iran with the highest incidence has been introduced as a high risk area (Malekzadeh et al., 2009; Sadjadi et al., 2003).
In this study, we used popular BYM model in the gastric cancer incidence ratio mapping. Moreover, in order to increase the estimation accuracy of disease mapping parameters in irregular spatial area, we applied a geostatistic technique known as Area-to-Area Poisson kriging.
The results of our study confirmed the results of previous studies and showed that the incidence of gastric cancer had highest risk in Ardabil province over eight years. Our results demonstrated that the counties in provinces Ardebil, Mazandaran, Gilan, Golestan, Semnan, Zanjan, Kordestan, WestAzarbayjan and EastAzarbayjan have a higher risk than other counties. According to ATA approach, Meshkinshahr in Ardabil has higher risk than other counties but according to BYM approach, Ardabil, the capital of Ardabil province, in north-western Iran has a higher risk than other counties. Because of Iran’s heterogeneous spatial pattern, the result of ATA is more reliable (Asmarian et al., 2013).
So people living in northern and north-western areas of Iran have a higher probability of gastric cancer occurrence than those living in other areas. Several factors such as infection with Helicobacter pylori, smoking, high salt consumption, inadequate antioxidants consumption, lifestyle and environmental influential factors, soil selenium, soil nitrate and high level of pesticide use, are known risk factors for people in these areas (Kolahdoozan et al., 2010; Behnampour et al., 2014).
Gastric cancer is known as a poor prognosis disease with a high degree of mortality in Iran. In order to control this cancer, national screening tests (like in Japan) and recording the diseases data with high precision, especially in high-risk areas, should be properly carried out.
Acknowledgements
The authors wish to thank the office of National Cancer Registration Center and of non-communicable disease, Ministry of Health and Medical Education, Iran. Also, the authors would like to thank of Center for Development of Clinical Research of Nemazee Hospital (Shiraz University of Medical Sciences, Shiraz, Iran) and Dr. Nasrin Shokrpour for editorial assistance.
References
- Asmarian NS, Kavousi A, Salehi M, Mahaki B. Mapping of stomach cancer rate in Iran using area-to-area Poisson Kriging. J Health Syst Res. 2012;9:681–7. [Google Scholar]
- Asmarian NS, Ruzitalab A, Amir K, Masoud S, Mahaki B. Area-to-area poisson kriging analysis of mapping of county-level esophageal cancer incidence rates in Iran. Asian Pac J Cancer Prev. 2013;14:11–3. doi: 10.7314/apjcp.2013.14.1.11. [DOI] [PubMed] [Google Scholar]
- Behnampour N, Hajizadeh E, Zayeri F, Semnani S. Modeling of influential predictors of gastric cancer incidence rates in Golestan Province, North Iran. Asian Pac J Cancer Prev. 2014;15:1111–7. doi: 10.7314/apjcp.2014.15.3.1111. [DOI] [PubMed] [Google Scholar]
- Besag J, York J, Mollié A. Bayesian image restoration, with two applications in spatial statistics. Ann I Stat Math. 1991;43:1–20. [Google Scholar]
- Goovaerts P. Geostatistical analysis of disease data: estimation of cancer mortality risk from empirical frequencies using Poisson kriging. Int J Health Geogr. 2005;4:1. doi: 10.1186/1476-072X-4-31. [DOI] [PMC free article] [PubMed] [Google Scholar]
- Goovaerts P. Geostatistical analysis of disease data: accounting for spatial support and population density in the isopleth mapping of cancer mortality risk using area-to-point Poisson kriging. Int J Health Geogr. 2006;5:1. doi: 10.1186/1476-072X-5-52. [DOI] [PMC free article] [PubMed] [Google Scholar]
- Goovaerts P, Gebreab S. How does Poisson kriging compare to the popular BYM model for mapping disease risks? Int J Health Geogr. 2008;7:1. doi: 10.1186/1476-072X-7-6. [DOI] [PMC free article] [PubMed] [Google Scholar]
- Hajian K, Firouzjahi AR, Kia MT. Pattern of age distribution of different cancers Babol, 2001. J Shahid Beheshti Uni Med Sci health. 2003;3:239–45. [Google Scholar]
- Hajiani-Eskandar SMH, Rahim M, Jalal H, Mehrdad A, Rajabi T. Clinical profile of gastric cancer in Khuzestan, southwest of Iran. World J Gastroentero. 2006;14:12–30. doi: 10.3748/wjg.v12.i30.4832. [DOI] [PMC free article] [PubMed] [Google Scholar]
- Kavousi A, Bashiri Y, Mehrabi Y, Etemad K, Teymourpour A. Identifying high-risk clusters of gastric cancer incidence in iran, 2004–2009. Asian Pac J Cancer Prev. 2014;15:10335–7. doi: 10.7314/apjcp.2014.15.23.10335. [DOI] [PubMed] [Google Scholar]
- Kolahdoozan S, Sadjadi A, Radmard AR, Khademi H. Five common cancers in Iran. Arch Iranian Med. 2010;13:143–8. [PubMed] [Google Scholar]
- Lawson AB, Browne WJ, Rodeiro CLV. Disease mapping with WinBUGS and MLwiN. John Wiley and Sons; 2003. p. 11. [Google Scholar]
- Lunn D, Spiegelhalter D, Thomas A, Best N. The BUGS project: Evolution, critique and future directions. Stat Med. 2009;28:3049–67. doi: 10.1002/sim.3680. [DOI] [PubMed] [Google Scholar]
- Malekzadeh R, Derakhshan MH, Malekzadeh Z. Gastric cancer in Iran: epidemiology and risk factors. Arch Iran Med. 2009;12:576–83. [PubMed] [Google Scholar]
- Mosavi-jarraahi A, Mohagheghi MA, Zeraatti H, Mortazavi H. Cancer registration in Iran asian pacific. Asian Pac J Cancer Prev. 2001;2:35–9. [Google Scholar]
- Mousavi SM, Gouya MM, Ramazani R, et al. Cancer incidence and mortality in Iran. Ann Oncol. 2009;20:556–63. doi: 10.1093/annonc/mdn642. [DOI] [PubMed] [Google Scholar]
- Mungiole M, Pickle LW, Simonson KH, White AA. Application of a weighted head banging algorithm to mortality data maps. Stat Med. 1999;18:3201–9. doi: 10.1002/(sici)1097-0258(19991215)18:23<3201::aid-sim310>3.0.co;2-u. [DOI] [PubMed] [Google Scholar]
- Sadjadi A, Malekzadeh R, Derakhshan MH, et al. Cancer occurrence in Ardabil: Results of a population-based Cancer Registry from Iran. Int J Cancer. 2003;107:113–8. doi: 10.1002/ijc.11359. [DOI] [PubMed] [Google Scholar]
- Soleimani A, Hassanzadeh J, Motlagh AG, et al. Spatial analysis of common gastrointestinal tract cancers in counties of Iran. Asian Pac J Cancer Prev. 2015;16:4025–9. doi: 10.7314/apjcp.2015.16.9.4025. [DOI] [PubMed] [Google Scholar]


