Abstract
Colonoscopy is currently the best technique available for the detection of colon cancer or colorectal polyps or other precursor lesions. Computer aided detection (CAD) is based on very complex pattern recognition. Local binary patterns (LBPs) are strong illumination invariant texture primitives. Histograms of binary patterns computed across regions are used to describe textures. Every pixel is contrasted relative to gray levels of neighbourhood pixels. In this study, colorectal polyp detection was performed with colonoscopy video frames, with classification via J48 and Fuzzy. Features such as color, discrete cosine transform (DCT) and LBP were used in confirming the superiority of the proposed method in colorectal polyp detection. The performance was better than with other current methods.
Keywords: Colon cancer, colonoscopy, Local Binary Pattern (LBP), J48, Fuzzy, Discrete Cosine Transform (DCT)
Introduction
Colorectal cancers are the second most common type of cancer occurring in women, and the third most among men. Colorectal polyps are a precursor to colorectal cancers. They usually lead to cancer, if the polyps are not treated. Colon capsule endoscopy (CCE) is novel alternate to traditional techniques like colonoscopy or computed tomography (CT) colonography (Mamonov et al., 2014). Colorectal polyps are anomalous growths in the mucusa of colon or rectum. They have two distinctive shapes: pedunculated or sessile. The typical morphology of such polyps are the cornerstone (Filipe and Condessa, 2011). A polyp is typically a protrusion in folds. Curvature techniques may be employed for singling out the polyp.
Colonoscopy is a useful method for screening for colorectal cancers. Survival is more likely if the cancer is discovered at an earlier stage prior to metastasis to lymph nodes or other organs happens (Muthukudage et al., 2011). Detection of a polyp is more frequent at the time of withdrawing the colonoscope and so the procedure should not be rushed (Riley, 2011).
CAD helps in detecting polyps by identifying the generic shapes that look like bumps. In recent times, various prototype colon CAD frameworks with CRC have been proposed for detecting polyps so as to reduce False Positive (FP) results (Li et al., 1999). Several visual attributes are used, like texture, colour, shape as well as other combinations. Color and texture are generally combined for the analysis of colonoscopy image. Textural attributes like those based on local binary patterns (LBP), texture spectrum (TS) or gray level co-occurrence matrix (GLCM) are utilized as a resolution in relevant research.
Colour-textural features, textural features, and colour features are computed separately and then used together as the basis of the classifier. LBP operators offer efficient methods to analyse textures. They have a fundamental theoretical model and merge features of structure and statistic texture analysis methods.
Manivannan (2015) suggested colonoscopy as well as histology (cell) images learning extremely discriminative local attributes and image representations for achieving the best classification possible for medical images. Various methods were proposed for this purpose.
Manivannan and Trucco (2015) suggested a new weak-supervised features learning method, learning discriminative local attributes from image-level labeled data for classifying images. Unlike already present features learning methods that presume that a set of extra data in the format of matching/non-matching pairs of local patches are provided for learning the attributes the method utilizes solely the image-level labels that are more easy for obtaining.
Fu et al., (2014) suggested a CAD framework for colonoscopy imaging for classifying colorectal polyps according to their types. The components of the suggested framework contained image enhancement, features extraction, features selection, as well as polyps classification. The textural analyses features, spatial domain features, as well as spectral domain features were taken from the first part of the PCT. Support Vector Machine (SVM) was utilized for classifying the colorectal polyps. Hence, the suggested CAD model improved the quality of the diagnoses of colorectal polyps.
Tajbakhsh et al., (2016) provided the results of the study into the design of a CAD model to detect polyps in colonoscopy videos. The model has its basis in a hybrid context-shape method that uses context data for removing non-polyp structures as well as shapes data for reliably localizing polyps.
Material and Methods
Figure 1 shows the flowchart for the proposed technique. The techniques used are detailed here.
Figure 1.

Flow Chart for the Suggested Technique
Color Features
Features qualifying the colour of LD muscles were extracted from LD scan. The following metrics were computed for R, G as well as B colour functions of every LD scan of muscle colour attributes: µR, µG, µB that represents which statistic the average colour feature, σR, σG, σB standard deviation, representing the non-uniformity of colours, and MR, MG, MB third moments which indicate skewness or imbalance of colours [10].
Colour moments represent colour features for qualifying coloured scans. Features which are able to be included are mean (µ), standard deviation (σ), skewness (θ), as well as kurtosis (γ). For RGB color space, 3 attributes are extracted from every plane, R, G as well as B. The formulae for obtaining the moments are the following:
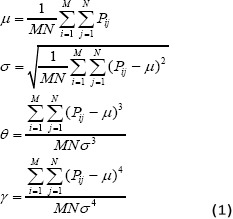
as well as N indicate the image dimensions. Pij indicates values of colour at ith column and jth row.
Local Binary Pattern (LBP) Feature
The LBP feature is garnering greater interest currently in the domain of textures classification as well as retrieval. For the former, LBP is transformed into a rotational invariant form. Currently, imaging technology permits scholars to gather a huge quantity of digitized images in the IR domain. The development of an automated system for searching, retrievals, or classification of images from the database is significant (Jabid et al., 2010). LBP is the most common textural descriptor in IR analyses. Colon scans are split into many regions from which the LBP features distribution are taken and concatenated into an improved features vector for usage as an image features descriptor.
Every pixel is labelled via thresholding P-neighbor values with centre value and converting result into binary numbers via

Wherein gc represents the gray value of the centre pixel xc, yc while gp represents the gray values of equally spaced pixels P on the circumference of circles with radius R. The values of neighbours which are not exactly on the pixel locations are estimated via bi-linear interpolation (Mamonov et al., 2014). Implies that the signs of differences in a neighbourhood are realized as P-bit binary numbers, resulting in 2p distinctive values for binary patterns. Individual pattern values are capable of describing texture data at center pixel gc.
LBP technique uses 28 =256 possible texture units rather than the 38 =6561 units used in the textural spectrum technique, resulting in a more effective abstraction of textures that lead to a comparable textures discrimination performance. LBP of a 3 × 3-pixel neighbourhood is predicted thus:
-
(i)
Original 3×3 neighbourhood (Figure 5a) is thresholded to 2 levels (0 and 1) utilizing centre pixel value.
-
(ii)
Values of the pixels in the thresholded neighbourhood are multiplied by specific weights designated to the related pixels.
-
(iii)
Values of the 8 pixels are summed for obtaining one value for the related pattern.
Figure 2.
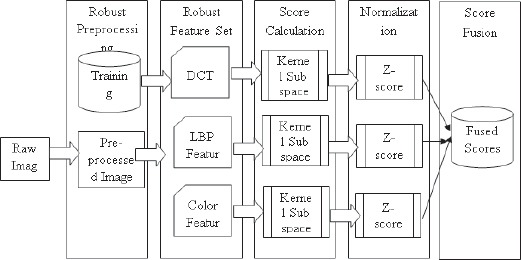
The Overall Architecture of Our Multi-Feature Subspace
Figure 3.
Classification Accuracy
Figure 4.

Sensitivity
Figure 5.

Specificity
LBP feature vectors are created through histogram bins of the LBP value distribution in the image area.
Discrete Cosine Transform (DCT)
DCT is a type of transform that is like Discrete Fourier Transform (DFT) and associated with Fourier. It possesses a strong energy compression feature and reaches a near-optimal value in compression efficacy. The single dimension DCT (Zhang et al., 2011) transformation may be given thus by (Muthukudage et al., 2011):

Inverse DCT transformation may be expressed as (4):

Fused Scores
Fusion methods are utilized in several applications. Within biometric applications, they merge matching scores from various modalities on the basis of generalized densities predicted from score spaces, although this needs huge amounts of training datasets for approximating density distributions.
Linear fusion, resulting in fused scores s from base classifier scores s=Ʃk skwk, are a generic method for combining probabilities with non-negative weights, i.e. wk ≥ 0. This has its basis in intuition as higher probability outputs from base classifiers represent huge probabilities after fusion, and distinct weights describe relative performance of classifiers. The protocol has given powerful performance (Li et al., 2012) particularly with respect to generalizations on unknown testing data sets. For combining visual as well as text searches, several fusion techniques are able to be used. The combinations lead to enhanced results instead of singular modality. Retrieval of texts generally leads to enhanced performance over visual retrieval, in medical retrieval. Therefore, the best combination strategies are to be chosen for improving performance appropriately. Earlier fusions include unimodal features before making decisions. As decision is based on information source, purely multimodal feature representation is guaranteed. Unimodal feature vectors are merged into one vector via weighting schemes.
J48
Classification refers to the procedure of constructing a model of classes from a set of records which comprise class labels. Decision Tree Algorithm refers to the finding of the way in which feature vector functions in several cases. Furthermore, based on the training samples, the classes for the new samples are discovered. The protocol produces the rules for predicting target parameter. With the assistance of tree classification protocol, the critical distribution of data is understandable (Kaur and Chhabra, 2014).
J48 classifier is a simple C4.5 decision tree for classification. It builds a binary tree. The decision tree method is useful in classification problems. Through this method, trees are built for modelling the classification procedure. Once the trees are built, they are applied to all tuples in the dataset and resulting in classifications for the tuples.
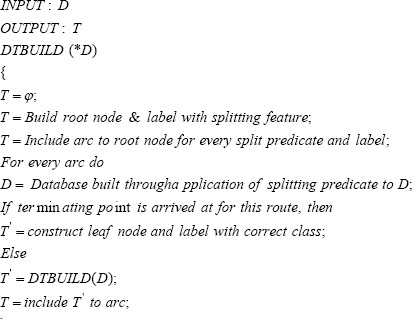
When constructing trees, J48 ignores missing values, that is, values for those items may be estimated on the basis of what is known regarding the features values for other records. The fundamental notion is the division of data into ranges on the basis of feature values for the item that is discovered in the training samples. J48 permits classification through either decision trees or rules created from them.
Fuzzy Classifier
Fuzzy Classifier learns fuzzy rules as well as unordered rule sets. The protocol induces rules for all classes distinctly utilizing the “one class – other classes” division scheme. When classifiers are trained utilizing a class, other classes are not taken into consideration. This assists in the achievement of a state where there is not a single main rule and the sequence of classes in the training procedure is not relevant (Gasparovica and Aleksejeva, 2011).
Denoting fuzzy rules is distinctive where intervals are replaced by fuzzy intervals known as fuzzy sets, with trapeze kind membership functions (Hühn and Hüllermeier, 2009).
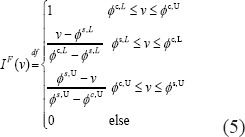
Where φc,L as well as φc,U represent the lower as well as upper bounds of the membership of fuzzy sets. FURIA has disadvantages such as when records are enclosed by rules of greater than a single class equally, confidence factor is to be calculated. The primary enhancements to RIPPER are associated with branching. However, the primary benefit of the protocol is a rule stretching technique, that resolves the issue that fresh records that ought to be classified utilizing the induced rules may not be encompassed by the earlier induced rules. The abstraction of the fuzzy rules is also distinct – the intervals are substituted by fuzzy intervals, which are fuzzy sets, with trapeze-type membership functions
Results
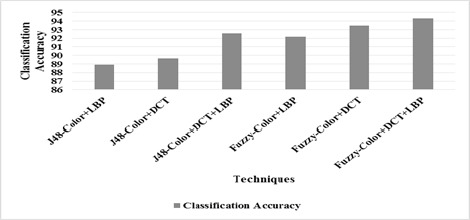
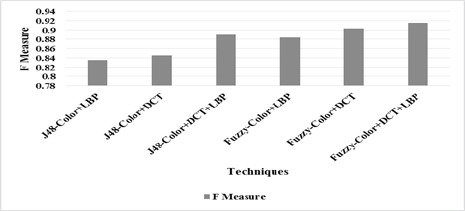
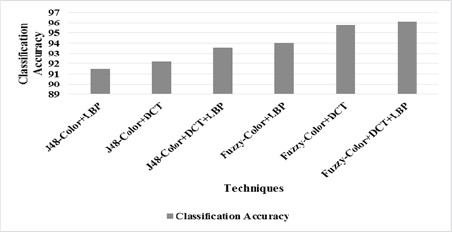
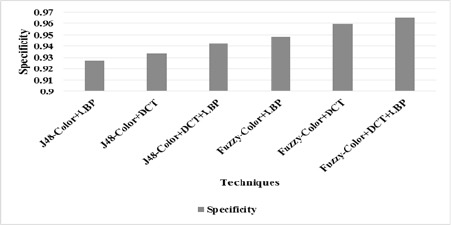
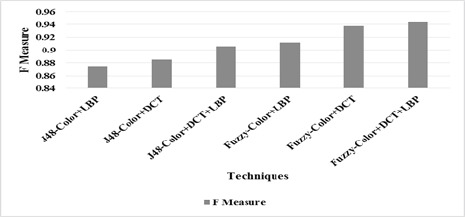
For experiments, 235 colon images with polyp and 468 normal images are considered. Table 1 and Figure 3 to 6 shows the classification accuracy, Sensitivity, Specificity and F measure for features extracted from one frame respectively. Table 2 and figure 7 to 10 shows the same for features extracted from five frames.
Table 1.
Summary of Results for Features Extracted from Single Frame
| Classification Accuracy | Sensitivity | Specificity | F Measure | |
|---|---|---|---|---|
| J48-Color+LBP | 88.9 | 0.847 | 0.910 | 0.836 |
| J48-Color+DCT | 89.6 | 0.855 | 0.917 | 0.846 |
| J48-Color+DCT+LBP | 92.6 | 0.898 | 0.940 | 0.890 |
| Fuzzy-Color+LBP | 92.2 | 0.889 | 0.938 | 0.884 |
| Fuzzy-Color+DCT | 93.5 | 0.919 | 0.942 | 0.904 |
| Fuzzy-Color+DCT+LBP | 94.3 | 0.932 | 0.949 | 0.916 |
Table 2.
Summary of Results for Features Extracted from Five Frames
| Classification Accuracy | Sensitivity | Specificity | F Measure | |
|---|---|---|---|---|
| J48-Color+LBP | 91.5 | 0.889 | 0.927 | 0.875 |
| J48-Color+DCT | 92.2 | 0.898 | 0.934 | 0.885 |
| J48-Color+DCT+LBP | 93.6 | 0.923 | 0.942 | 0.906 |
| Fuzzy-Color+LBP | 94.0 | 0.923 | 0.949 | 0.912 |
| Fuzzy-Color+DCT | 95.7 | 0.953 | 0.959 | 0.937 |
| Fuzzy-Color+DCT+LBP | 96.2 | 0.953 | 0.966 | 0.943 |
Figure 6.
F measure
Figure 7.
Classification Accuracy
From Table 1 as well as Figure 3 it is seen that the classification accuracy of Fuzzy-color, DCT and LBP for single frame performs better by 5.91% than J48-color LBP, by 5.1% than J48-color, DCT, by 1.83% than J48-color, DCT and LBP, by 2.3% than Fuzzy-color, LBP and by 0.91% than Fuzzy-color, DCT.
From table 1 as well as figure 4 it is seen that the sensitivity of Fuzzy-color, DCT and LBP for single frame performs better by 9.6% than J48-color LBP, by 8.6% than J48-color, DCT, by 3.71% than J48-color, DCT and LBP, by 4.7% than Fuzzy-color, LBP and by 1.4% than Fuzzy-color, DCT.
From Table 1 as well as figure 5 it is seen that the specificity of Fuzzy-color, DCT and LBP for single frame performs better by 4.13% than J48-color LBP, by 3.42% than J48-color, DCT, by 0.9% than J48-color, DCT and LBP, by 1.13% than Fuzzy-color, LBP and by 0.68% than Fuzzy-color, DCT.
From Table 1 as well as figure 6 it is seen that the F measure of Fuzzy-color, DCT and LBP for single frame performs better by 9.15% than J48-color LBP, by 7.94% than J48-color, DCT, by 2.88% than J48-color, DCT and LBP, by 3.6% than Fuzzy-color, LBP and by 1,38% than Fuzzy-color, DCT than J48-color, DCT and LBP, by 4.7% than Fuzzy-color, LBP and by 1.4% than Fuzzy-color, DCT.
From Table 2 as well as Figure 7 it is seen that the classification accuracy of Fuzzy-color, DCT and LBP for five frame performs better by 4.99% than J48-color LBP, by 4.23% than J48-color, DCT, by 2.69% than J48-color, DCT and LBP, by2.24% than Fuzzy-color, LBP and by 0.45% than Fuzzy-color, DCT.
From Table 2 and figure 8 it is observed that the sensitivity of Fuzzy-color, DCT and LBP for single frame performs better by 6.93% than J48-color LBP, by 5.97% than J48-color, DCT, by 3.18% than J48-color, DCT and LBP, by 3.18% than Fuzzy-color, LBP and no difference than Fuzzy-color, DCT.
Figure 8.

Sensitivity
From Table 2 and Figure 9 it is observed that the specificity of Fuzzy-color, DCT and LBP for five frames performs better by 4.1% than J48-color LBP, by 3.37% than J48-color, DCT, by 2.5% than J48-color, DCT and LBP, by 1.79% than Fuzzy-color, LBP and by 0.66% than Fuzzy-color, DCT.
Figure 9.
Specificity
From Table 2 as well as Figure 10 it is seen that the F measure of Fuzzy-color, DCT and LBP for five frame performs better by 7.55% than J48-color LBP, by 6.4% than J48-color, DCT, by 4.01% than J48-color, DCT and LBP, by 3.37% than Fuzzy-color, LBP and by 0.63% than Fuzzy-color, DCT.
Figure 10.
F measure
Discussion
Colorectal cancers occur in colon or in the rectum. They typically develop initially as a colorectal polyp, a growth within the colon or the rectum which becomes cancerous later on. The results of the experiment show that the classification accuracy of Fuzzy-color, DCT and LBP for single frame outperforms by 5.91% than J48-color LBP, by 5.1% than J48-color, DCT, by 1.83% than J48-color, DCT and LBP, by 2.3% than Fuzzy-color, LBP and by 0.91% than Fuzzy-color, DCT. LIkewise, the classification accuracy of Fuzzy-color, DCT and LBP for five frame outperforms by 4.99% than J48-color LBP, by 4.23% than J48-color, DCT, by 2.69% than J48-color, DCT and LBP, by2.24% than Fuzzy-color, LBP and by 0.45% than Fuzzy-color, DCT.
References
- Bhuvana S, Bhuvaneswari AJ. Computer aided automatic detection of polyp for colon tumor. Comput Med Imaging Graph. 2015;4:431–38. [Google Scholar]
- Filipe JC, Condessa AND. Detection and Classification of Human Colorectal Polyps. Comput Med Imaging Graph. 2011;10:1–10. [Google Scholar]
- Fu JJ, Yu YW, Lin HM, Chai JW, Chen CCC. Feature extraction and pattern classification of colorectal polyps in colonoscopic imaging. Comput Med Imaging Graph. 2014;38:267–75. doi: 10.1016/j.compmedimag.2013.12.009. [DOI] [PubMed] [Google Scholar]
- Gasparovica M, Aleksejeva L. Using fuzzy unordered rule induction algorithm for cancer data classification. Breast Cancer. 2011;13:1–7. [Google Scholar]
- Hühn J, Hüllermeier E. FURIA: An algorithm for unordered fuzzy rule induction. Data Min Knowl Discov. 2009;19:293–319. [Google Scholar]
- Jabid T, Kabir MH, Chae O. Robust facial expression recognition based on local directional pattern. ETRI J Journal. 2010;32:784–94. [Google Scholar]
- Kaur G, Chhabra A. Improved J48 classification algorithm for the prediction of diabetes. Int j comput appl technol. 2014;98:7–13. [Google Scholar]
- Li J, Tan J, Martz FA, Heymann H. Image texture features as indicators of beef tenderness. Meat Sci. 1999;53:17–22. doi: 10.1016/s0309-1740(99)00031-5. [DOI] [PubMed] [Google Scholar]
- Liu J, McCloskey S, Liu Y. computer vision-ECCV 2012. Berlin Heidelberg: Springer; 2012. Local expert forest of score fusion for video event classification; pp. 397–410. [Google Scholar]
- Mamonov AV, Figueiredo IN, Figueiredo PN, Tsai YHR. Automated polyp detection in colon capsule endoscopy. IEEE Trans Med Imaging. 2014;33:1488–1502. doi: 10.1109/TMI.2014.2314959. [DOI] [PubMed] [Google Scholar]
- Manivannan S. Visual feature learning with application to medical image classification. Doctoral dissertation, University of Dundee. 2015:1–154. [Google Scholar]
- Manivannan S, Trucco E. Learning discriminative local features from image-level labelled data for colonoscopy image classification. 2015 IEEE 12th International Symposium on Biomedical Imaging (ISBI) 2015:420–23. [Google Scholar]
- Muthukudage J, Oh J, Tavanapong W, Wong J, De Groen PC. Pacific-Rim Symposium on Image and Video Technology. Berlin Heidelberg: Springer; 2011. Color based stool region detection in colonoscopy videos for quality measurements; pp. 61–72. [Google Scholar]
- Riley SA. Colonoscopic polypectomy and endoscopic mucosal resection: a practical guide. Br Soc Gastroenterol. 2008;8:1–22. [Google Scholar]
- Tajbakhsh N, Gurudu SR, Liang J. Automated polyp detection in colonoscopy videos using shape and context information. IEEE Trans Med Imaging. 2016;35:630–44. doi: 10.1109/TMI.2015.2487997. [DOI] [PubMed] [Google Scholar]
- Zhang Y, Hao P, Wang M, Guo C. Research on classification and detection of colon cancer’s gene expression profiles. Biomed Res Int. 2011;6:2792–800. [Google Scholar]


