

Abstract
Corticosteroids (CS) are anti-inflammatory agents that cause extensive pharmacogenomic and proteomic changes in multiple tissues. An understanding of the proteome-wide effects of CS in liver and its relationships to altered hepatic and systemic physiology remains incomplete. Here, we report the application of a functional pharmacoproteomic approach to gain integrated insight into the complex nature of CS responses in liver in vivo. An in-depth functional analysis was performed using rich pharmacodynamic (temporal-based) proteomic data measured over 66 hours in rat liver following a single dose of methylprednisolone (MPL). Data mining identified 451 differentially regulated proteins. These proteins were analyzed on the basis of temporal regulation, cellular localization, and literature-mined functional information. Of the 451 proteins, 378 were clustered into six functional groups based on major clinically-relevant effects of CS in liver. MPL–responsive proteins were highly localized in the mitochondria (20%) and cytosol (24%). Interestingly, several proteins were related to hepatic stress and signaling processes, which appear to be involved in secondary signaling cascades and in protecting the liver from CS-induced oxidative damage. Consistent with known adverse metabolic effects of CS, several rate-controlling enzymes involved in amino acid metabolism, gluconeogenesis, and fatty-acid metabolism were altered by MPL. In addition, proteins involved in the metabolism of endogenous compounds, xenobiotics, and therapeutic drugs including cytochrome P450 and Phase-II enzymes were differentially regulated. Proteins related to the inflammatory acute-phase response were up-regulated in response to MPL. Functionally-similar proteins showed large diversity in their temporal profiles, indicating complex mechanisms of regulation by CS.
Keywords: methylprednisolone, liver, pharmacoproteomics, functional proteomics, pharmacodynamics
Graphical abstract
INTRODUCTION
Functional pharmacoproteomics is an emerging area that aims to elucidate relevant biological functions of proteins altered by drugs and define mechanisms of drug action at the molecular level. By understanding the functions of proteins altered by drug treatment, mechanistic connections between molecular-level perturbations and ultimate systemic responses can be clarified. Routinely performed static ‘-omics’ studies assess a single moment of genomic or proteomic expression [1]. However, the regulation of protein expression by most drugs is not static but rather a dynamic (i.e. time-dependent) phenomenon. Alterations in protein expression may emerge in a delayed manner and persist for several hours after the drug has been cleared from the system. Thus, pharmacodynamic (i.e. temporal) changes following drug dosing must be assessed in order to more comprehensively analyze proteomic alterations as well as understand the mechanisms underlying the temporal nature of drug responses in vivo.
Corticosteroids (CS), the synthetic analogues of endogenous glucocorticoid (GC) hormones, are a class of potent anti-inflammatory drugs used extensively in treating various diseases such as rheumatoid arthritis [2], asthma [3], and some lymphomas [4]. However, high-dose or chronic CS therapy leads to a magnification of GC’s normal metabolic effects, which are manifested adversely as diabetes, insulin resistance, osteoporosis, and obesity [5, 6]. Most of these effects are mediated through genomic mechanisms by the steroid binding to cytosolic glucocorticoid receptors (GR) which subsequently leads to activation, dimerization, and translocation of the drug-receptor complex into the nucleus, thereby producing widespread changes in mRNA and protein expression [7].
The liver plays a central role in maintaining systemic energy homeostasis and is one of the most sensitive organs to CS exposure [8]. The CS induce extensive biochemical changes in liver [9], altering the homeostasis of several biological processes. In addition to being the principal site for gluconeogenesis, liver stores glucose in the form of glycogen, which is released in response to hormonal signals to maintain systemic glucose concentrations. The liver also plays a critical role in lipid metabolism, which is altered upon CS treatment [10]. Hence, long-term CS use causes numerous side-effects that stem from a dysregulation of liver function. Since CS cause large-scale perturbations in mRNA and protein expression, direct assessment of drug-induced proteomic changes in vivo combined with extensive data mining and functional analyses will provide molecular-level insights into the functional and mechanistic aspects of numerous proteins altered by CS.
We conducted a study whereby a population of animals received a single dose of the synthetic CS methylprednisolone (MPL), with multiple animals sacrificed at 11 time points following dosing, and livers from these animals harvested for proteomic analysis. The development of a robust and reproducible ion-current-based quantitative nano-LC/MS method that enabled assessment of drug-induced dynamic proteomic changes in vivo, and its application in examining the temporal proteomic response of liver from these animals was reported [11]. In addition, tandem changes in the temporal responses of mRNA from a similar set of animals [12, 13] and protein expression from this animal set were also analyzed [14]. Since proteins are better predictors of phenotypic change as compared to mRNA [15, 16], a natural extension to our studies was performing a proteome-wide functional analysis to better understand the liver-specific effects of CS.
The present report describes the functional analysis and classification of proteins that were differentially regulated in rat liver following MPL dosing. Systems-based ‘omics’ approaches coupled with intensive literature-based data mining were applied to the rich proteomic time-series data in order to functionally annotate, describe, and classify 451 differentially-regulated CS-responsive proteins. The rich functional information of the MPL-responsive proteins coupled with characterization of their temporal responses provides added insights into the physiological and pharmacological effects of CS in liver.
MATERIALS AND METHODS
Animals
Liver tissues for the proteomic analysis were obtained from a large, population-based animal study conducted in our laboratory. Fifty-five adrenalectomized (ADX) male Wistar rats were given methylprednisolone sodium succinate (Solu-Medrol) at 50 mg/kg by intramuscular injection, and killed at 11 different time points (0.5, 1, 2, 4, 5.5, 8, 12, 18, 30, 48 and 66 hr) after MPL dosing, with 5 replicate animals for each time point. After perfusion and sacrifice, livers were harvested, flash frozen in liquid nitrogen and stored at −80°C until further analysis. Each time point group was compared with five vehicle (saline)-dosed animals that were sacrificed at random times after injection. The ADX rats were used to abrogate the circadian rhythm of endogenous GC production and provide a stable pharmacodynamic baseline. Perfused liver tissue was used for the proteomic analyses in order to remove the high concentrations of blood proteins. A summary of the animal study design is provided in Supplementary Figure 1. All animal protocols adhered to “Principles of Laboratory Animal Care” (NIH publication 85-23, revised in 1985) and were approved by the University at Buffalo IACUC committee (PHC08128N). The institution’s animal welfare assurance number is D16-00231.
Experimental
Proteomics
Proteins from perfused and flash frozen livers were extracted, digested, and analyzed using a nano-LC/MS instrument. A total of 80 mg of powdered liver tissue was added to 800 μL of detergent-cocktail lysis buffer [150 mM sodium chloride, 1% sodium deoxycholate, 2% Nonidet P-40 (NP-40), and 2.5% sodium dodecyl sulfate and protease inhibitors (Complete tablets, EDTA-free, Roche, Inc.)] and homogenized using a Polytron homogenizer (Kinematica, Switzerland). The samples were then sonicated using a high-energy sonicator (Qsonica, Newtown, CT). The extract was centrifuged at 20,000 g for 60 min at 4 °C. Total protein concentrations in the supernatant was measured by the Bicinchoninic Acid Assay. 100 μg of protein was diluted with the lysis buffer to a final concentration of 2 mg/mL, which was then subjected to a precipitation/on-pellet-digestion procedure. The Nano Flow Ultra-High Pressure LC system (nano-UPLC) consisted of a Spark Endurance autosampler (Emmen, Holland) and an ultra-high pressure Eksigent (Dublin, CA) Nano-2D Ultra capillary/nano-LC system, with a LTQ/Orbitrap XL mass spectrometer (Thermo Fisher Scientific, San Jose, CA) used for detection. Separation was performed on a long column [100 cm long and 50-μm inner diameter (ID)] with small particles (Pepmap 2-μm C18, 100 Å) under high pressure (~9000–11,000 psi with heating at 52 °C). The LC/MS raw data were searched against the Uniprot reviewed rat protein database (released October 2012) with 7,853 protein entries using SEQUEST-based Proteome Discoverer® (version 1.2.0.208, Thermo-Scientific). Mass tolerances for precursor and fragment ion masses were 15 ppm and 0.5 amu. Two missed cleavages were permitted for fully tryptic peptides. Carbamidomethylation of cysteines was set as a fixed modification and a variable modification of methionine oxidation was allowed. The false discovery rate was estimated by a target-decoy search strategy, using a concatenated database containing both forward and reversed sequences. Protein quantification was based on the area under the curve (AUC) of the ion-current peaks. Technical details on the ion-current based quantification method is described in a previous publication [17]. Strict criteria were applied for peak detection and frame generation, e.g., S/N > 10 for peptide precursor peaks and the elimination of peptides with ambiguous assignment, to ensure good quantitative accuracy and precision. The AUC data was interfaced to a PHP script, which transformed the quantitative data, followed by normalization for each individual sample. The protein ratios of time-course groups versus vehicle controls were computed by aggregating the AUC data on peptide levels to protein levels using a weighting model based on relative variances [11, 18]. A step-by-step summary of the proteomic profiling methodology is provided in Supplementary Figure 1 in the supporting information (SI). A more detailed description of our analytical methodology was published [11, 17]. The detailed quantitative data on peptide identification and protein levels across all the time-points are provided in Supplemental Tables 1 and 2 in the SI.
Measurements of plasma MPL and glucose concentrations
Plasma MPL concentrations were determined by a normal-phase high-performance liquid chromatography method [19]. The limit of quantitation was 10 ng/mL for MPL. The inter-day and intra-day coefficients of variation (CV) were less than 10%. A two-compartment pharmacokinetic model with dual absorption pathways as described previously [20] was used to fit the MPL plasma concentration-time profile. Plasma glucose concentrations were measured by the glucose oxidase method (Sigma GAGO-20; Sigma-Aldrich, St. Louis, MO). The manufacturer’s instructions were modified such that the assay was carried out in a 1-ml assay volume, and a standard curve consisting of seven concentrations over a 16-fold range was prepared from the glucose standard and run with each experimental set in triplicate.
Data Analysis
Analysis of Differentially Regulated Proteins
From approximately 3000 proteins identified in the LC/MS analysis, 1753 unique protein groups were quantified with sufficient quality (S/N, number of peptides, etc.) across the time points based on stringent cut-off criteria [11]. The 1753 quantified proteins were filtered to include only the protein groups that were quantified at all 11 time-points, yielding 959 proteins for further analysis. Next, the data set was filtered for differential expression over time using software for the Extraction and Analysis of Gene Expression (EDGE) [21]. Within-class differential expression was employed in order to identify proteins that showed a differential expression profile over time. Only proteins that varied significantly over time (p value < 0.05 and q-value < 0.01) were utilized in the subsequent analysis.
UniProt/Swiss-Prot ID Matching and Manual Filtering
The significantly altered proteins were listed according to their unique Universal Protein Resource (UniProt) accession number (AC) or identifier (ID) and fed into the UniProt database [22, 23]. Proteins were mapped based on their UniProt AC/ID into the UniProt knowledgebase to obtain information regarding corresponding gene and/or protein names. Redundancies in the final protein list were manually analyzed and filtered.
Characterization of Response Profiles
The pharmacodynamic response versus time profiles of each significantly altered protein was visually inspected. Based on all of the profiles observed in the dataset, each protein was classified into either up-regulated, down-regulated, or complex (biphasic) patterns of expression. Proteins showing biphasic behavior were annotated as either “up/down” or “down/up” to denote the dynamics of their temporal response.
Cellular Localization and Functional Clustering
Uniprot accession numbers corresponding to each of the significantly altered proteins were analyzed using various online tools and databases, including National Center for Biotechnology Information (NCBI) Basic Local Alignment Search Tool (BLAST), Gene Ontology Consortium - Gene Ontology Database [24], and GeneCards to confirm the identity and the annotations of the proteins provided in the UniProt database as well as check for alternate protein names. Preliminary gene ontology analysis of the significantly changing proteins was done using the functional annotation tool DAVID (Database for Annotation, Visualization and Integrated Discovery; NIH) [25], where functional classification was performed using medium-level stringency. Utilizing this information as a starting-point, extensive literature searches were performed to identify the liver-specific functions and other relevant information for the differentially expressed proteins. Cellular component information for the proteins were derived from the Gene Ontology Annotation (GOA) resource, which provides gene annotation information to the UniProt database [26] and applied to identify the sub-cellular locations of steroid-induced proteomic changes. Direct use of results from DAVID and other currently available pathway analysis tools were avoided for final functional clustering, as the databases for these tools are not complete (i.e., they do not contain functional information on all the identified proteins), and do not take into account liver-specific physiological functions of the proteins. Therefore, six functional clusters were devised based on the clinically relevant effects of MPL in liver. The proteins were then allocated into a functional cluster based on literature-derived functional information. Additional sub-clustering was performed within the classes of energy regulation and drug metabolism. Proteins that did not fit any of the six functional categories were grouped into an additional cluster referred to as ‘other MPL-regulated proteins’.
RESULTS
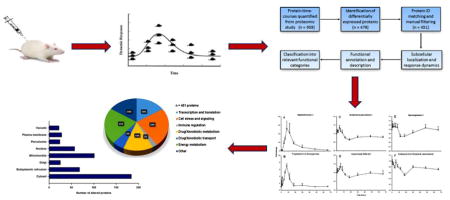
The main goal of this pharmacoproteomic analysis was to functionally annotate, describe, and classify the 451 hepatic proteins that were significantly altered by CS treatment in vivo. The major steps applied in the data analysis are summarized in Figure 1. Starting from the 1753 proteins that were quantified at one or more time-points in our proteomic study [11], proteins that were not quantified at each of the 11 time-points were filtered, which left 959 proteins for further analysis. Next, proteins with complete time-courses were analyzed using the EDGE software [21] in order to identify those which were differentially-regulated by MPL with respect to time. Using this method, 478 out of 959 proteins were found to show significantly varying temporal profiles (meeting the cut-offs p value < 0.05 and q-value < 0.01). The significantly altered proteins were then manually filtered in order to remove any redundancies (e.g. duplicate listings or identical protein subunits) that were present in the data set. However, if one or more subunits of a large protein complex (e.g. 60S ribosomal protein) possessed distinct identity and/or functionality, the protein subunits of the complex were retained for further analysis. After this step, a final group of 451 unique proteins were available for analyzing their regulation, localization, and function.
Figure 1.

Workflow for the functional analysis and clustering of the proteomic data.
Figure 2 depicts the concentration-time profile of drug in the rats following a single 50 mg/kg intramuscular bolus of MPL. Following the absorption phase of about 30 minutes, the drug concentrations declined in a bi-exponential fashion and fell below the level of detection by 8 h. This profile in ADX rats is similar to that observed following intramuscular MPL dosing in intact (i.e. non-adrenalectomized) rats [20].
Figure 2.

MPL concentrations in rat plasma following a single 50 mg/kg intramuscular dose of drug. MPL concentrations were determined by normal-phase HPLC analysis of plasma samples obtained from individual animals. Closed circles depict observed measurements from each animal and the solid line model fitting results.
Direction of temporal regulation by CS
Tables 1–6 present identified regulated proteins based on function. It is evident based on previous temporal cluster analyses of our genomic and proteomic studies that multiple patterns of changes in mRNA and protein expression occur in response to MPL dosing [13, 14, 27]. The direction of regulation of each altered protein is listed under “Regulation” in these tables. Of the total 451 proteins, 77% were enhanced or up-regulated, 18% displayed biphasic behavior, and 5% were down-regulated. Figure 3 provides representative examples of the characteristic patterns of behavior of the proteins. Shown are the expression profiles of two proteins, metallothionein-1 (Figure 3A) and tryptophan 2,3-dioxygenase (Figure 3B), where enhancement of expression is observed followed by a return to baseline. Both proteins display dynamic behavior that is similar to numerous mRNAs whose expression is enhanced by MPL in liver, including the prototypic CS-regulated gene, tyrosine aminotransferase (TAT) [7]. Mechanistically, such patterns of enhancement are often observed for proteins encoded by gene sequences containing glucocorticoid-response elements (GREs) in their promoter region [28]. While metallotheonein-1 indeed contains a pair of adjacent GREs in its promoter region [29], conflicting mechanistic explanations may exist for tryptophan 2,3-dioxygenase. Specifically, its regulation by MPL could occur either directly through the presence of a GRE-like sequence [30], or via a CS-regulated, short-lived transcription factor which indirectly alters tryptophan 2,3-dioxygenase expression [31]. Also depicted are the expression profiles of two proteins, glutathione peroxidase-1 (Figure 3C) and cytochrome P450 2A1 (Cyp2a1; Figure 3D), which display biphasic patterns of expression. While such patterns of expression are more difficult to decipher mechanistically, the involvement of secondary biosignals (e.g. transcription factors) has been postulated [7]. The temporal responses of two proteins, murinoglobulin-2 (Figure 3E) and peroxisomal 3-ketoacyl-CoA thiolase B (Figure 3F) illustrate down-regulation. While murinoglobulin-2 shows down-regulation only at 10 hours after dosing and returns to baseline by 48 hours, peroxisomal 3-ketoacyl-CoA thiolase B shows rapid down-regulation followed by a return to an ‘apparent’ baseline which is lower than in untreated animals. Together, the data presented in Figure 3 illustrate that changes in protein expression in response to CS are diverse in their dynamics and may involve multiple mechanisms of regulation.
Table 1.
MPL-regulated proteins related to cell stress and signal transduction.
| UProt_ID | Gene Name | Protein Name | Function | Regulation |
|---|---|---|---|---|
| P63102 | Ywhaz | 14-3-3 protein zeta/delta (Protein kinase C inhibitor protein 1) | Adapter protein which modulates partner activity | UP |
| O70351 | Hsd17b10 | 17-beta-hydroxysteroid dehydrogenase 10 | Catalyzes 20-beta-OH and 21-OH dehydrogenase activities with C21 steroids | UP |
| Q62730 | Hsd17b2 | 17-beta-hydroxysteroid dehydrogenase type 2 | Oxidation of estradiol and testosterone | UP/DOWN |
| P62334 | Psmc6 | 26S protease regulatory subunit | ATP-dependent degradation of ubiquinated proteins | UP |
| P13437 | Acaa2 | 3-ketoacyl-CoA thiolase, mitochondrial | Inhibits BNIP3-mediated apoptosis and mitochondrial damage | UP |
| P50554 | Abat | 4-aminobutyrate aminotransferase, mitochondrial | Catabolism of inhibitory neurotransmitter gamma-aminobutyric acid (GABA) | UP |
| Q64640 | Adk | Adenosine kinase | ATP dependent phosphorylation of adenosine | DOWN/UP |
| P10760 | Ahcy | Adenosylhomocysteinase | Control of methylations via regulation of the intracellular concentration of adenosylhomocysteine | UP |
| P29410 | Ak2 | Adenylate kinase 2, mitochondrial | Reversible transfer of the terminal phosphate group between ATP and AMP | UP |
| Q08163 | Cap1 | Adenylyl cyclase-associated protein 1 | Directly regulates filament dynamics | UP |
| Q64057 | Aldh7a1 | Aldehyde dehydrogenase family 7 member A1 (antiquitin) | Protects cells from oxidative stress | UP |
| P14669 | Anxa3 | Annexin A3 | Inhibitor of phospholipase A2; also possesses anti-coagulant properties | UP |
| P48037 | Anxa6 | Annexin A6 | Release of Ca2+ from intracellular stores | UP/DOWN |
| P18484 | Ap2a2 | AP-2 complex subunit alpha-2 | Involved in clathrin-dependent endocytosis | UP |
| Q7TMA5 | Apob | Apolipoprotein B-100 | Recognition signal for the binding and internalization of LDL particles by the apoB/E receptor | DOWN |
| P09034 | Ass1 | Argininosuccinate synthase | Blood pressure regulation; catalyzes the penultimate step of the arginine biosynthetic pathway | UP |
| P14173 | Ddc | Aromatic-L-amino-acid decarboxylase | Decarboxylation of L-DOPA to dopamine, and L-5-hydroxytryptophan to serotonin | UP |
| P26453 | Bsg | Basigin (CD antigen CD147) | Stimulates hepatic fibroblasts to produce matrix metalloproteinases | UP/DOWN |
| O88428 | Papss2 | Bifunctional PAPS synthase 2 | ATP sulfurylase and APS kinase activity - mediates two steps in the sulfate activation pathway | UP |
| P35565 | Canx | Calnexin | Calcium-binding protein that interacts with newly synthesized glycoproteins in the endoplasmic reticulum | UP |
| P18418 | Calr | Calreticulin | Protein folding and export from E.R. to Golgi; also involved in regulating intracellular free calcium levels | UP |
| P07756 | Cps1 | Carbamoyl-phosphate synthase | Role in removing excess ammonia from the cell | UP |
| B0BNN3 | Ca1 | Carbonic anhydrase 1 | Reversible hydration of carbon dioxide | UP |
| P14141 | Ca3 | Carbonic anhydrase 3 | Reversible hydration of carbon dioxide; major participant in the liver response to oxidative stress | UP |
| P04762 | Cat | Catalase | Protects cells against oxidative damage | UP |
| Q61301 | Ctnna2 | Catenin alpha-2 | Essential for actin cytoskeletal organization and canalicular membrane formation in liver | UP |
| P24268 | Ctsd | Cathepsin D | Acid protease active in intracellular protein breakdown | UP |
| P16232 | Hsd11b1 | Corticosteroid 11-beta-dehydrogenase isozyme 1 | Reversible conversion of corticosterone to 11-dehydrocorticosterone | UP |
| P00564 | Ckm | Creatine kinase M-type | Energy metabolism - transfer of phosphate between ATP and various phosphogens (e.g. creatine phosphate) | UP |
| P09605 | Ckmt2 | Creatine kinase S-type, mitochondrial | Energy metabolism - transfer of phosphate between ATP and various phosphogens (e.g. creatine phosphate) | UP |
| Q63270 | Aco1 | Cytoplasmic aconitate hydratase | Iron sensor | UP |
| Q68FS4 | Lap3 | Cytosol aminopeptidase | Processing and regulation of turnover of intracellular proteins | UP |
| Q6Q0N1 | Cndp2 | Cytosolic non-specific dipeptidase | Hydrolyzes a variety of dipeptides | DOWN/UP |
| P80254 | Ddt | D-dopachrome decarboxylase | Tautomerization of D-dopachrome | UP/DOWN |
| O08557 | Ddah1 | Dimethylarginine dimethylaminohydrolase 1 | Nitric oxide generation by regulating cellular concentrations of methylarginines | UP/DOWN |
| Q63342 | Dmgdh | Dimethylglycine dehydrogenase, mitochondrial | Catabolism of choline | UP |
| P80067 | Ctsc | Dipeptidyl peptidase 1 (Cathepsin C) | Thiol protease; has dipeptidylpeptidase activity | UP/DOWN |
| Q924C3 | Enpp1 | Ectonucleotide pyrophosphatase/phosphodiesterase member 1 | Regulation of purinergic signaling | UP |
| P02692 | Fabp1 | Fatty acid-binding protein, liver | Lipoprotein-mediated cholesterol uptake in hepatocytes | UP/DOWN |
| Q80X90 | Flnb | Filamin-B (FLN-B) | Connects cell membrane constituents to the actin cytoskeleton | UP |
| Q9QVC8 | Fkbp52 | FK506-binding protein 4 | Immunophilin protein with PPIase and co-chaperone activities (e.g. GR) | UP |
| Q07071 | Gckr | Glucokinase regulatory protein | Role in glucose homeostasis; inhibits glucokinase (GCK) by forming an inactive complex with this enzyme | UP |
| P04041 | Gpx1 | Glutathione peroxidase 1 | Protects hemoglobin in erythrocytes from oxidative breakdown | UP/DOWN |
| P00502 | Gsta1 | Glutathione S-transferase alpha-1 | Glutathione peroxidase activity - protect cells from oxidative stress | DOWN |
| P04903 | Gsta2 | Glutathione S-transferase alpha-2 | Glutathione peroxidase activity - protect cells from oxidative stress | DOWN/UP |
| P04904 | Gsta3 | Glutathione S-transferase alpha-3 | Glutathione peroxidase activity - protect cells from oxidative stress | UP |
| P24473 | Gstk1 | Glutathione S-transferase kappa 1 | Protection against genotoxic and cytotoxic electrophiles in the mitochondrial compartment | UP |
| P04905 | Gstm1 | Glutathione S-transferase Mu 1 | Conjugation of glutathione to exogenous and endogenous compounds | UP |
| P08010 | Gstm2 | Glutathione S-transferase Mu 2 | Conjugation of glutathione to exogenous and endogenous compounds | UP |
| Q80W21 | Gstm7 | Glutathione S-transferase Mu 7 | Conjugation of reduced glutathione to exogenous and endogenous hydrophobic electrophiles | UP |
| P30713 | Gstt2 | Glutathione S-transferase theta-2 | Inactivation of reactive sulfate esters in carcinogenic arylmethanols | UP |
| P08009 | Gstm3 | Glutathione S-transferase Yb-3 | Conjugation of glutathione to exogenous and endogenous compounds | UP |
| Q63060 | Gk | Glycerol kinase | Regulation of glycerol uptake and metabolism; also an ATP-stimulated GR translocation promoter | UP |
| O88600 | Hspa4 | Heat shock 70 kDa protein 4 | Transcription factor-binding protein | UP |
| P48721 | Grp75 | Heat shock 70 kDa protein, mitochondrial (Mortalin) | Cell proliferation and cellular aging | UP |
| P63018 | Hsc70 | Heat shock cognate 71 kDa protein | Binds bacterial lipopolysaccharide (LPS) and mediates LPS-induced inflammatory response | UP |
| P82995 | Hsp90aa1 | Heat shock protein HSP 90-alpha | Molecular chaperone - maturation, structural maintenance and regulation of specific -proteins (e.g. GR) | UP |
| P34058 | Hsp90ab1 | Heat shock protein HSP 90-beta | Molecular chaperone - maturation, structural maintenance and proper regulation of specific target proteins | UP |
| P01946 | Hba1 | Hemoglobin subunit alpha-1/2 | Involved in oxygen transport from the lung to the various peripheral tissues | DOWN |
| P02091 | Hbb | Hemoglobin subunit beta-1 | Involved in oxygen transport from the lung to the various peripheral tissues | DOWN |
| P20059 | Hpx | Hemopexin | Circulating heme-binding proterin; transports to the liver for breakdown and iron recovery | UP |
| P52296 | Kpnb1 | Importin subunit beta-1 | Nuclear protein import | UP |
| D3ZW55 | Itpa | Inosine triphosphate pyrophosphatase | Hydrolyzes purine nucleotides such as inosine triphosphate (ITP) | UP |
| P70615 | Lmnb1 | Lamin-B1 | Components of the nuclear lamina; provide a framework for the nuclear envelope | UP |
| P38983 | Lamr1 | Laminin receptor 1 | Cell adhesion, differentiation, migration, signaling, and metastasis | UP |
| Q5SGE0 | Lrpprc | Leucine-rich PPR motif-containing protein, mitochondrial | Role in RNA metabolism in both nuclei and mitochondria | UP |
| Q63108 | Ces3 | Liver carboxylesterase 3 | Detoxification of xenobiotics and in the activation of ester and amide prodrugs | UP |
| P02803 | Mt1 | Metallothionein-1 | Heavy-metal binding protein; transcriptionally regulated by both heavy metals and glucocorticoids | UP |
| P04355 | Mt2 | Metallothionein-2 | Heavy-metal binding protein; transcriptionally regulated by both heavy metals and glucocorticoids | UP |
| P62260 | Ywhae | Mitochondrial import stimulation factor L subunit | Adapter protein which modulates partner activity | UP |
| P21396 | Maoa | Monoamine oxidase type A | Oxidative deamination of biogenic and xenobiotic amines such as serotonin, norepinephrine and epinephrine | UP |
| Q1HCL7 | Nadk2 | NAD kinase 2, mitochondrial | Mitochondrial NAD+ kinase that phosphorylates NAD+ to yield NADP+ | UP |
| P19804 | Nme2 | Nucleoside diphosphate kinase B | Synthesis of nucleoside triphosphates other than ATP | UP |
| P02625 | Pvalb | Parvalbumin alpha | Calcium-binding albumin protein involved in calcium signaling | UP |
| Q63716 | Prdx1 | Peroxiredoxin-1 | Cellular redox regulation | UP |
| O35244 | Prdx6 | Peroxiredoxin-6 | Regulation of phospholipid turnover and protection against oxidative injury | UP |
| P31044 | Pebp1 | Phosphatidylethanolamine-binding protein 1 | Binds ATP, opioids and phosphatidylethanolamine; also acts as an inhibitor of MEK phosphorylation | UP |
| Q9EPH8 | Pabpc1 | Polyadenylate-binding protein 1 | Cytoplasmic regulatory processes of mRNA metabolism | UP |
| P62963 | Pfn1 | Profilin-1 | Inhibits formation of IP3 and DAG by inhibiting PIP2 | UP/DOWN |
| Q9JM53 | Pdcd8 | Programmed cell death protein 8 | Regulator of cellular apoptosis | UP |
| P67779 | Phb | Prohibitin | Inhibits DNA synthesis; role in regulating cell proliferation | UP |
| Q63347 | Psmc2 | Proteasome 26S subunit ATPase 2 | ATP-dependent degradation of ubiquinated proteins | UP |
| O88767 | Park7 | Protein deglycase DJ-1 | Cell protection against oxidative stress and cell death | UP |
| Q8VBU2 | Ndrg2 | Protein NDRG2 | Regulation of the Wnt signaling pathway | UP |
| P85973 | Pnp | Purine nucleoside phosphorylase (PNP) | Breakdown of beta-(deoxy)-ribonucleoside molecules | UP |
| Q3UQ44 | Iqgap2 | Ras GTPase-activating-like protein IQGAP2 | GTPase-activating protein; known to associate with calmodulin and Nrf-2 | UP |
| Q03336 | Rgn | Regucalcin | Calcium binding protein; also involved in ascorbic acid (vitamin C) biosynthesis | UP/DOWN |
| Q920A6 | Scpep1 | Retinoid-inducible serine carboxypeptidase | Carboxyl-terminal proteolytic activity at acidic pH | UP |
| Q64578 | Atp2a1 | Sarcoplasmic/endoplasmic reticulum calcium ATPase 1 | Reuptake of cytosolic Ca2+ into the sarcoplasmic reticulum | UP |
| P18596 | Atp2a3 | Sarcoplasmic/endoplasmic reticulum calcium ATPase 3 | Hydrolysis of ATP coupled with the transport of the calcium from cytosol to E.R. lumen | UP |
| Q8VIF7 | Selenbp1 | Selenium-binding protein 1 | Sensing of reactive xenobiotics in the cytoplasm; also involved in intra-Golgi protein transport | UP |
| Q63836 | Selenbp2 | Selenium-binding protein 2 ( acetaminophen-binding protein) | Sensing of reactive xenobiotics in the cytoplasm | UP |
| P12346 | Tf | Serotransferrin (Transferrin) | Transport of iron from sites of absorption and heme degradation to those of storage and utilization | UP |
| Q4FZX7 | Srprb | Signal recognition particle receptor subunit beta (SR-beta) | Targeting of the nascent secretory proteins to the endoplasmic reticulum membrane system | UP |
| Q66X93 | Snd1 | Staphylococcal nuclease domain-containing protein 1 | Transcriptional coactivator for STAT5 | UP |
| Q4FZT0 | Stoml2 | Stomatin-like protein 2, mitochondrial (SLP-2) | Regulates the biogenesis and the activity of mitochondria; regulates cardiolipin biosynthesis | UP |
| O89049 | Txnrd1 | Thioredoxin reductase 1, cytoplasmic | Role in selenium metabolism and protection against oxidative stress | UP/DOWN |
| P24329 | Tst | Thiosulfate sulfurtransferase | Mitochondrial import factor for the cytosolic 5S rRNA | DOWN |
| P63029 | Tpt1 | Translationally-controlled tumor protein | Involved in calcium binding and microtubule stabilization | UP |
| Q4KLZ6 | Tkfc | Triokinase/FMN cyclase | Phosphorylation of dihydroxyacetone and of glyceraldehyde | UP |
| Q5XHZ0 | Trap1 | Tumor necrosis factor type 1 receptor-associated protein | Chaperone that expresses ATPase activity | UP |
| P68037 | Ube2l3 | Ubiquitin-conjugating enzyme E2 L3 | Ubiquitin conjugation to target proteins | UP/DOWN |
| Q5U300 | Uba1 | Ubiquitin-like modifier-activating enzyme 1 | Ubiquitin conjugation to mark cellular proteins for degradation | UP |
| Q9Z1A6 | Hdlbp | Vigilin (High density lipoprotein-binding protein) | Sterol metabolism; protects cells from over-accumulation of cholesterol | UP |
| Q5RKI0 | Wdr1 | WD repeat-containing protein 1 | Induces disassembly of actin filaments | UP |
| P22985 | Xdh | Xanthine dehydrogenase/oxidase | Purine metabolism - oxidation of hypoxanthine to xanthine, and xanthine to uric acid | UP/DOWN |
| Q3MIF4 | Xylb | Xylulose kinase (Xylulokinase) | Phosphorylates D-xylulose; plays an important role in regulation of glucose metabolism and lipogenesis | UP |
Table 6.
Immune-related proteins regulated by MPL.
| UProt_ID | Gene Name | Protein Name | Function | Regulation |
|---|---|---|---|---|
| P17475 | Serpina1 | Alpha-1-antiproteinase (Serpin A1) | Inhibitor of serine proteases | UP |
| Q63041 | A1m | Alpha-1-macroglobulin | Inhibitor of proteinases | UP |
| P14480 | Fgb | Fibrinogen beta chain | Fibrin precursor; antibacterial immune response via both innate and T-cell mediated pathways | UP |
| Q03626 | Mug1 | Murinoglobulin-1 | Proteinase inhibitor involved in acute phase inflammatory response | UP/DOWN |
| Q6IE52 | Mug2 | Murinoglobulin-2 | Inhibitor of proteinases | DOWN |
| P97584 | Ptgr1 | Prostaglandin reductase 1 (PRG-1) | Conversion of leukotriene B4 into its biologically less active metabolite, 12-oxo-leukotriene B4 | UP/DOWN |
| Q63797 | Psme1 | Proteasome activator 28 subunit alpha | Immunoproteasome subunit that processes class I MHC peptides | UP |
| P09006 | Serpina3N | Serine protease inhibitor A3N | Irreversible, suicide inhibition of protease | UP |
| P05544 | Serpina3l | Serine protease inhibitor A3L | Irreversible, suicide inhibition of protease | UP |
| P52631 | Stat3 | Signal transducer and activator of transcription-3 | Transcription-factor involved in gene regulation of multiple biological processes | UP |
| P01026 | C3 | Complement C3 | Acute phase protein - central role in the activation of the complement system | UP |
| P06866 | HpBa1 | Haptoglobin | Hepatic recycling of heme iron; also involved in acute phase response | UP |
Figure 3.

Temporal response profiles of representative proteins showing (A and B) enhanced expression, (C and D) biphasic expression, and (E and F) down-regulation. Closed circles represent the mean and the error bars one standard deviation.
Cellular localization of CS-responsive proteins
Gene ontology analysis was performed based on information available from the Gene Ontology Annotation (GOA) resource, which provides the latest evidence-based gene ontology annotations to proteins in the UniProt knowledgebase [26]. The sub-cellular distributions of the altered proteins are shown in Figure 4. There were 184 proteins localized to the cytosol, 101 to the mitochondria, and 68 to the endoplasmic reticulum. The fact that a large portion of MPL-regulated proteins were localized to the mitochondria is consistent with the effects of CS on hepatic energy metabolism [32–34]. Several cytosolic proteins were involved in either hepatic signaling processes (Table 2) or xenobiotic/drug metabolism (Table 4). In addition, 57 proteins localized to the nucleus were altered by MPL, which is indicative of the transcriptional mechanisms of CS effects. A few instances exist where a functional protein was found to be localized to more than one cellular component. Furthermore, less than 3% of the altered proteins were localized to other compartments (e.g. cell junction), which are not presented in the figure.
Figure 4.

Gene Ontology-based annotation of cellular distribution of significantly altered proteins based on sub-cellular organelles. Solid bars represent the number of proteins altered in each cellular compartment.
Table 2A.
MPL-regulated proteins related to amino acid metabolism.
| UProt_ID | Gene Name | Protein Name | Function | Regulation |
|---|---|---|---|---|
| P20673 | Asl | Argininosuccinate lyase | Reversible breakdown of argininosuccinate producing arginine and dicarboxylic acid fumarate | UP |
| P13221 | Got1 | Aspartate aminotransferase, cytoplasmic | Biosynthesis of L-glutamate from L-aspartate or L-cysteine | UP |
| P00507 | Got2 | Aspartate aminotransferase, mitochondrial | Catalyzes interconversion of aspartate and α-ketoglutarate to oxaloacetate and glutamate | UP |
| Q03248 | Bup1 | Beta-ureidopropionase | Converts N-carbamoyl-beta-alanine (3-ureidopropanoate) to beta-alanine | UP |
| P25093 | Fah | Fumarylacetoacetate hydrolase | Synthesizes acetoacetate and fumarate from L-phenylalanine degradation | UP |
| P10860 | Glud1 | Glutamate dehydrogenase 1, mitochondrial | Converts L-glutamate into alpha-ketoglutarate | DOWN |
| P09606 | Glul | Glutamine synthetase | Production of glutamine and 4-aminobutanoate | UP |
| P21213 | Hal | Histidine ammonia-lyase | First reaction in histidine catabolism | UP/DOWN |
| Q07523 | Hao2 | Hydroxyacid oxidase 2 | Oxidation of L-alpha-hydroxy acids as well as L-alpha-amino acids | DOWN |
| Q58FK9 | Kat3 | Kynurenine-oxoglutarate transaminase 3 | L-kynurenine to kynurenic acid | UP |
| Q5XIT9 | Mccc2 | Methylcrotonoyl-CoA carboxylase beta chain | Amino acid (L-leucine) metabolism | UP |
| P04182 | Oat | Ornithine aminotransferase, mitochondrial | Formation of proline from acid ornithine | UP |
| P04176 | Pah | Phenylalanine-4-hydroxylase (PAH) | Hydroxylation of the aromatic side-chain of phenylalanine to generate tyrosine | UP |
| Q2V057 | Prodh2 | Proline dehydrogenase 2 | Converts proline to delta-1-pyrroline-5-carboxylate | UP |
| Q5I0J9 | Aspdh | Putative L-aspartate dehydrogenase | Dehydrogenation of L-aspartate to iminoaspartate | UP |
| P50431 | Shmt1 | Serine hydroxymethyltransferase, cytosolic | Interconversion of serine and glycine | DOWN |
| Q68FT5 | Bhmt2 | S-methylmethionine-homocysteine S-methyltransferase | Regulation of homocysteine metabolism | UP |
| P21643 | Tdo2 | Tryptophan 2,3-dioxygenase | Amino acid (tryptophan) metabolism | UP |
| P04694 | Tat | Tyrosine aminotransferase (TAT) | Conversion of tyrosine to 4-hydroxyphenylpyruvate (liver-specific) | UP |
| P29266 | Hibadh | 3-hydroxyisobutyrate dehydrogenase, mitochondrial | Reversible oxidation of 3-hydroxy-isobutanoate to (S)-methylmalonate-semialdehyde | UP |
| P32755 | Hpd | 4-hydroxyphenylpyruvate dioxygenase | Involved in tyrosine degradation | UP |
| A2VCW9 | Aass | Alpha-aminoadipic semialdehyde synthase | Catalyzes first two steps in lysine degradation pathway | UP |
| O09171 | Bhmt | Betaine-homocysteine S-methyltransferase 1 | Conversion of betaine and homocysteine to dimethylglycine and methionine | UP |
| P0C2X9 | Aldh4a1 | Delta-1-pyrroline-5-carboxylate dehydrogenase | Conversion of delta-1-pyrroline-5-carboxylate (P5C), derived either from proline or ornithine, to glutamate | UP |
| Q60759 | Gcdh | Glutaryl-CoA dehydrogenase, mitochondrial | Amino acid (L-lysine, L-hydroxylysine, and L-tryptophan) metabolism | UP |
| P13255 | Gnmt | Glycine N-methyltransferase | Methylation of glycine by using S-adenosylmethionine to form N-methylglycine | UP |
| P12007 | Ivd | Isovaleryl-CoA dehydrogenase, mitochondrial | Third step in leucine catabolism | UP/DOWN |
| P13444 | Mat1a | S-adenosylmethionine synthase isoform type-1 | Formation of S-adenosylmethionine from methionine and ATP | UP |
| P18298 | Mat2a | S-adenosylmethionine synthase isoform type-2 | Formation of S-adenosylmethionine from methionine and ATP | UP |
| P53395 | Dbt | Dihydrolipoamide branched chain transacylase | Mitochondrial breakdown of the branched-chain amino acids isoleucine, leucine, and valine | UP |
Table 4A.
MPL-regulated cytochrome P450 enzymes related to drug/xenobiotic/endogenous substrate metabolism.
| UProt_ID | Gene Name | Protein Name | Function | Regulation |
|---|---|---|---|---|
| P04799 | Cyp1a2 | Cytochrome P450 1A2 | Endogenous substrates = steroids, arachidonic acid; Drugs = caffeine, clozapine; benzo-a-pyrene (procarcinogen) | UP |
| P17178 | Cyp27a1 | Cytochrome P450 27A1 | Endogenous substrates = sterol intermediates; Vitamin D3 (25-hydroxylase activity) | UP |
| P11711 | Cyp2a1 | Cytochrome P450 2A1 | Endogenous substrates = testosterone, progesterone and androstenedione (steroid hydroxylase) | UP/DOWN |
| P15149 | Cyp2a2 | Cytochrome P450 2A2 | Endogenous substrate = testosterone (adult male-specific steroid hydroxylase) | UP/DOWN |
| P04167 | Cyp2b2 | Cytochrome P450 2B2 | Transcriptionally induced by phenobarbital (CAR-C/EBP dependent); substrate = Polychlorinated biphenyls | UP |
| P13107 | Cyp2b3 | Cytochrome P450 2B3 | Transcriptionally induced by phenobarbital (CAR-C/EBP dependent); substrate = Polychlorinated biphenyls | UP |
| P08683 | Cyp2c11 | Cytochrome P450 2C11 | Endogenous substrate = testosterone; Drugs = bufuralol, sildenafil; Vitamin D3 / D2 (25- and 24-hydroxylase activity) | UP |
| P20814 | Cyp2c13 | Cytochrome P450 2C13 | Endogenous substrate = testosterone (male-specific 6-beta-hydroxylase activity) and arachidonic acid (low activity) | UP |
| P24470 | Cyp2c23 | Cytochrome P450 2C23 | Endogenous substrate = arachidonic acid | DOWN |
| Q64458 | Cyp2c29 | Cytochrome P450 2C29 | Endogenous substrate = arachidonic acid; Drug = tolbutamide | UP |
| Q91X77 | Cyp2c50 | Cytochrome P450 2C50 | Endogenous substrates = arachidonic acid and linoleic acid | DOWN |
| P05179 | Cyp2c7 | Cytochrome P450 2C7 | Endogenous substrates = testosterone and retinoic acid | UP |
| P19225 | Cyp2c70 | Cytochrome P450 2C70 | Endogenous substrate = testosterone | UP/DOWN |
| P12939 | Cyp2d10 | Cytochrome P450 2D10 | *No literature information found regarding substrates* | UP |
| P10634 | Cyp2d26 | Cytochrome P450 2D26 | *No literature information found regarding substrates* | UP/DOWN |
| P05182 | Cyp2e1 | Cytochrome P450 2E1 | Procarcinogens = acrylamide, alcohol, benzene, 4-nitrophenol; Drugs = acetaminophen, isoniazid | UP |
| P05183 | Cyp3a2 | Cytochrome P450 3A2 | Cyp3a4 homolog in rat; numerous drugs, xenobiotics, and endogenous substrates | UP |
| P20817 | Cyp4a14 | Cytochrome P450 4A14 | Endogenous substrate = arachidonic acid (omega-hydroxylase) | UP/DOWN |
| P51869 | Cyp4f4 | Cytochrome P450 4F4 | Endogenous substrates = prostaglandin A1, prostaglandin E1, and leukotrienes (omega-hydroxylase) | UP |
| Q64654 | Cyp51a1 | Cytochrome P450 51A1 | Catalyzes a step in zymosterol biosynthesis from lanosterol | DOWN |
Functional clustering of CS-responsive proteins
From data mining and extensive literature searches, biological and/or pharmacological functions for the 451 altered proteins were identified. While direct use of functional gene ontology analysis tools such as DAVID were avoided for functional clustering (due to reasons cited in the “Discussion”), the UniProt knowledgebase was used to trace relevant literature information for some proteins that were functionally annotated on the database based on ‘evidence at the experimental-level’ (i.e. information derived from published reports). The proteins were further clustered into six functional groups. Proteins with biological functions that did not fit into any of the six clusters were grouped into an additional cluster referred to as ‘other MPL-regulated proteins’ (Table 7). Tables list identifying criteria, brief functional descriptions, and temporal responses following acute MPL dosing. For each protein listed in the tables, the UniProt accession number (“UProt_ID”) and corresponding gene and protein names are provided. Further, the biological function(s) of each protein along with other information (important substrates, mechanistic interactions, etc.) where relevant and/or are available are presented. The responses of the protein to MPL dosing as up-regulated (up), down-regulated (down), or complex/biphasic (some combination of both) are listed. Quantitative values at each time-point for the 451 proteins included in the analysis are provided in Supplemental Table 3 in the SI.
Table 7.
Other MPL-regulated proteins.
| UProt_ID | Gene Name | Protein Name | Function | Regulation |
|---|---|---|---|---|
| P46953 | Haao | 3-hydroxyanthranilate oxygenase | Biosynthesis of NAD+ | UP/DOWN |
| P63259 | Actg | Actin, cytoplasmic | Cell motility | UP |
| P46664 | Adss2 | Adenylosuccinate synthetase isozyme 2 | De novo and salvage pathways of purine nucleotide biosynthesis | UP |
| Q0D2L3 | Agmat | Agmatinase, mitochondrial | Putrescine biosynthesis via agmatine pathway | UP |
| Q8VHE9 | Retsat | All-trans-retinol 13,14-reductase | Retinol metabolism | UP |
| Q6DGG1 | Abhd14b | Alpha/beta hydrolase domain-containing protein 14B | Hydrolase activity towards p-nitrophenyl butyrate | UP |
| P24090 | Ahsg | Alpha-2-HS-glycoprotein | Serum glycoprotein synthesized by hepatocytes; exact function unclear | UP |
| Q9JI91 | Actn2 | Alpha-actinin-2 | Anchor actin to intracellular structures | UP |
| Q9QXQ0 | Actn4 | Alpha-actinin-4 | Anchors actin to a variety of intracellular structures | UP |
| P97384 | Anx11 | Annexin A11 | Calcium-dependent phospholipid-binding protein | UP |
| P07824 | Arg1 | Arginase-1 | Subpathway of the urea cycle that synthesizes L-ornithine and urea from L-arginine | UP |
| P16638 | Acly | ATP-citrate synthase | Synthesis of cytosolic acetyl-CoA | UP |
| Q62095 | Ddx3y | ATP-dependent RNA helicase DDX3Y | Important for spermatogenesis; role in liver unclear | UP |
| Q8BFZ3 | Actbl2 | Beta-actin-like protein 2 | Cell motility | UP |
| O35826 | Gne | Bifunctional UDP-N-acetylglucosamine 2-epimerase | Biosynthesis of N-acetylneuraminic acid (NeuAc), a precursor of sialic acids | UP |
| P27653 | Mthfd1 | C-1-tetrahydrofolate synthase, cytoplasmic | Folate metabolism - interconversion of tetrahydrofolate molecules | UP |
| P26231 | Ctnna1 | Catenin alpha-1 | Linkage of cadherins to the actin cytoskeleton | UP |
| P11442 | Cltc | Clathrin heavy chain 1 | Major protein of the polyhedral coat of coated pits and vesicles | UP |
| Q66H80 | Copd | Coatomer subunit delta (Archain) | Required for vesicle budding from Golgi membrane | UP |
| O89046 | Coro1b | Coronin-1B (Coronin-2) | Regulates cell motility | DOWN/UP |
| P32232 | Cbs | Cystathionine beta-synthase | Transsulfuration pathway - mediates elimination of L-methionine and the toxic metabolite L-homocysteine | UP |
| P18757 | Cth | Cystathionine gamma-lyase | Last step in the trans-sulfuration pathway from methionine to cysteine | DOWN |
| P00173 | Cyb5a | Cytochrome b5 | Hemoprotein which functions as an electron carrier for several membrane bound oxygenases | DOWN |
| P11240 | Cox5a | Cytochrome c oxidase subunit 5A, mitochondrial | Terminal oxidase in mitochondrial electron transport | UP |
| Q9D0M3 | Cyc1 | Cytochrome c1, heme protein, mitochondrial | Steroid biosynthesis | UP |
| Q8VID1 | Dhrs4 | Dehydrogenase/reductase SDR family member 4 | Retinal metabolism | UP |
| P06214 | Alad | Delta-aminolevulinic acid dehydratase | Catalyzes an early step in the biosynthesis of tetrapyrroles | UP/DOWN |
| P11348 | Qdpr | Dihydropteridine reductase | Production of tetrahydrobiopterin, an essential cofactor for phenylalanine, tyrosine, and tryptophan hydroxylases | UP/DOWN |
| P13803 | Etfa | Electron transfer flavoprotein subunit alpha, mitochondrial | Electron acceptor for several dehydrogenase enzymes | UP/DOWN |
| Q6UPE1 | Etfdh | Electron transfer flavoprotein-ubiquinone oxidoreductase, mito | Electron transport - reduces ubiquinone | DOWN/UP |
| P05369 | Fdps | Farnesyl pyrophosphate synthase | Isoprenoid biosynthesis - formation of farnesyl diphosphate | UP |
| O88618 | Ftcd | Formimidoyltransferase-cyclodeaminase | Channels 1-carbon units from formiminoglutamate to the folate pool | UP |
| Q9QZU7 | Bbox1 | Gamma-butyrobetaine dioxygenase | Carnitine biosynthesis - formation of L-carnitine from gamma-butyrobetaine | UP |
| O08795 | Prkcsh | Glucosidase II subunit beta | N-linked glycan-processing enzyme in the endoplasmic reticulum | UP |
| Q91Z53 | Grhpr | Glyoxylate reductase/hydroxypyruvate reductase | Dicarboxylic acid metabolism | UP/DOWN |
| Q9WU19 | Hao1 | Hydroxyacid oxidase 1 | Glycolate degradation | UP |
| O35952 | Hagh | Hydroxyacylglutathione hydrolase, mitochondrial | Hydrolysis of S-D-lactoyl-glutathione to form glutathione | UP |
| Q5BJY9 | Krt18 | Keratin, type I cytoskeletal 18 | Role in filament reorganization | UP |
| Q10758 | Krt8 | Keratin, type II cytoskeletal 8 | Together with KRT19, helps to link the contractile apparatus to dystrophin at the costameres of striated muscle | UP |
| O88867 | Kmo | Kynurenine 3-monooxygenase | Synthesis of kynurenic acid and quinolinic acid - neurotoxic NMDA receptor antagonists | UP |
| P04642 | Ldha | L-lactate dehydrogenase A chain | Inter-conversion of pyruvate and L-lactate | UP |
| Q5M7W5 | Map4 | Microtubule-associated protein 4 | Promotes microtubule assembly | UP |
| Q791V5 | Mtch2 | Mitochondrial carrier homolog 2 | Mitochondrial depolarization | UP |
| Q9QZ76 | Mb | Myoglobin | Carrier of reserve supply of oxygen | UP |
| A2AQP0 | Myh7b | Myosin heavy chain 7B | Muscle contraction - ‘slow’ ATPase | UP |
| P02600 | Myl1 | Myosin light chain 1/3, skeletal muscle isoform | Regulatory light chain of myosin; non-calcium binding | UP |
| P16409 | Myl3 | Myosin light chain 3 | Regulatory light chain of myosin; non calcium binding | UP/DOWN |
| Q64122 | Myl9 | Myosin regulatory light polypeptide 9 | Regulation of both smooth muscle and nonmuscle cell contractile activity | UP |
| Q62812 | Myh9 | Myosin-9 | Role in cytoskeleton reorganization, focal contacts formation | UP |
| Q5BK63 | Ndufa9 | NADH dehydrogenase 1 alpha subcomplex 9, mitochondrial | Subunit of the mitochondrial membrane respiratory chain | UP |
| Q9DCT2 | Ndufs3 | NADH dehydrogenase iron-sulfur protein 3, mitochondrial | Core subunit of the mitochondrial membrane respiratory chain NADH dehydrogenase | UP |
| Q62736 | Cald1 | Non-muscle caldesmon | Regulation of actomyosin | UP |
| Q68G31 | Pbld | Phenazine biosynthesis-like domain-containing protein | *Function unclear* | UP |
| Q63598 | Pls3 | Plastin-3 (T-plastin) | Actin-bundling protein | UP |
| P07633 | Pccb | Propionyl-CoA carboxylase, mitochondrial | Synthesizes succinyl-CoA from propanoyl-CoA | UP |
| Q9Z2Q1 | Sec31a | Protein transport protein Sec31A | Formation of transport vesicles from the endoplasmic reticulum | UP/DOWN |
| P26043 | Rdx | Radixin (ESP10) | Binding of the barbed end of actin filaments to the plasma membrane | UP |
| Q99PL5 | Rrbp1 | Ribosome-binding protein 1 | Electron chain transport - accepts electrons from Rieske protein and transfers to cytochrome c | UP |
| Q64380 | Sardh | Sarcosine dehydrogenase, mitochondrial | Amine (sarcosine) degradation | UP/DOWN |
| Q9EP89 | Lactb | Serine beta-lactamase-like protein LACTB, mitochondrial | Function unclear in liver | UP/DOWN |
| Q76MZ3 | Ppp2r1a | Serine/threonine-protein phosphatase 2A | Assembly of the catalytic subunit of serine/threonine-protein phosphatase | UP |
| Q62261 | Sptbn1 | Spectrin beta chain, non-erythrocytic 1 | Actin crosslinking and molecular scaffold protein | UP |
| P26039 | Tln1 | Talin-1 | Anchors major cytoskeletal structures to the plasma membrane | UP |
| A2ASS6 | Ttn | Titin (Connectin) | Assembly of contractile machinery in muscle cells | DOWN |
| P04692 | Tpm1 | Tropomyosin alpha-1 chain | Stabilizes cytoskeleton actin filaments in non-muscle cells | UP/DOWN |
| P09495 | Tpm4 | Tropomyosin alpha-4 chain | Stabilizes cytoskeleton actin filaments in non-muscle cells | UP/DOWN |
| P58775 | Tpm2 | Tropomyosin beta chain (Tropomyosin-2) | Stabilizes cytoskeleton actin filaments in non-muscle cells | UP |
| Q6AYZ1 | Tuba1c | Tubulin alpha-1C chain | Major constituent of microtubules | UP |
| Q4QRB4 | Tubb3 | Tubulin beta-3 chain (Neuron-specific class III beta-tubulin) | Major constituent of microtubules | UP |
| Q6P9T8 | Tubb4b | Tubulin beta-4B chain | Major constituent of microtubules | UP |
| Q6PEC1 | Tbca | Tubulin-specific chaperone A | Tubulin folding pathway | UP |
| Q91ZJ5 | Ugp2 | UTP-glucose-1-phosphate uridylyltransferase | Glucosyl donor in cellular metabolic pathways | UP/DOWN |
| P31000 | Vim | Vimentin | Anchors the position of the organelles in the cytosol | UP/DOWN |
Cellular Stress and Signal Transduction
Cell stress and signaling corresponds to the largest functional group, representing 107 proteins (Table 1). In general, proteins in this group include those which serve as intermediary components of various signal transduction pathways such as kinases, chaperone proteins, immunophilins, transcription factors, or enzymes involved in the termination (inactivation or catabolic breakdown) of hormone and neurotransmitter signaling. Figure 5 presents representative examples in this category. Creatine kinase (CK) isozymes catalyze the transfer of the phosphate group of phosphocreatine to ADP, to yield ATP and creatine in high-demand metabolic organs such as muscle, brain, and heart. However, conflicting results exist regarding its expression in liver [35–37]. Our results indicate that CK M-type is expressed in liver and strongly enhanced (~6-fold) in response to MPL (Figure 5A). Up-regulation of CK by GC has been reported previously in the developing rat skeletal muscle, but not in liver [38]. Interestingly, 11β-dehydrogenase type-1, the isozyme that catalyzes the conversion of inactive cortisone (11-dehydrocorticosterone in rodent) to active cortisol (corticosterone) [39], displayed a biphasic profile where expression showed a sustained increase (~1.4-fold) up to 30 hours followed by a decline below baseline at 48 and 66 hours post-dosing (Figure 5B). Since regulation of 11β-dehydrogenase type-1 is an important determinant of synthetic CS pharmacokinetics [40], alterations in this enzyme could influence CS pharmacodynamics. Two well-established molecular chaperones of cytoplasmic GR, heat-shock protein (hsp) 90-alpha [41] and FK506 binding protein 4 (encoded by Fkbp52), were up-regulated by MPL (data not shown). Since the FKBP-hsp90 chaperone complex functions to modulate steroid receptor activity [42], their enhancement in expression might serve as a protective mechanism against the presumably high intracellular steroid concentrations. This group is also represented by a number of enzymes which are responsive to cellular oxidative stress - suggestive of a protective mechanism against the oxidative stress-inducing effects of CS in tissues [43–45]. For instance, expression of aldehyde dehydrogenase 7 family member A1 (Aldh7a1; antiquitin), which plays a major role in the detoxification of aldehydes generated by alcohol metabolism, lipid peroxidation, and other cases of oxidative stress [46, 47] was altered over time. Antiquitin showed a complex time-profile where expression peaked at 2 hours followed by a decline below baseline by 12 hours and remained fairly steady up to 66 hours (Figure 5C). The expression of two major isoforms of the heavy-metal and free-radical binding proteins metallothionein (MT-I and MT-II) [48], were strongly enhanced by MPL. In fact, of all the proteins quantified in the study, the strongest drug-induced change was observed for MT-II (~100-fold; Figure 5D). This observation is in agreement with previous findings at the transcriptional level [49]. Similar to MT-I (shown in Figure 3A), enhancement of MT-II by CS is regulated by a pair of adjacent GREs in its promoter region [29].
Figure 5.

Temporal response profiles of four proteins involved in hepatic stress and/or cellular signal transduction. Closed circles depict the mean and the error bars one standard deviation.
Energy Metabolism
Proteins involved in energy metabolism formed the second-largest group, consisting of 102 proteins (Table 2), and representative examples are presented in Figure 6. Since pathways controlling energy metabolism are highly complex and involve multiple biochemical processes for macromolecular breakdown to yield energy, this group was further sub-clustered into proteins involved in protein/amino acid metabolism, carbohydrate metabolism, lipid/fatty acid metabolism, and the Krebs cycle.
Figure 6.

Temporal response profiles of representative proteins involved in the regulation of hepatic energy metabolism. Closed circles represent the mean and the error bars one standard deviation.
Drug-responsive proteins involved in hepatic amino acid metabolism are listed in Table 2A. Aminotransferase (or transaminase) enzymes catalyze the redistribution of nitrogen between amino acids and corresponding oxoacids participating in both protein metabolism and gluconeogenesis [50]. Significant MPL-induced up-regulation was observed for four aminotransferases: alanine aminotransferase (AAT), cytosolic aspartate aminotransferase (cASAT), ornithine aminotransferase (OAT), and tyrosine aminotransferase (TAT). Interestingly, although CS stimulate expression of all four aminotransferases through GRE-binding [51–53], the kinetics and dynamics (i.e. magnitude) of induction by MPL markedly differ among the enzymes. For instance, the induction of cASAT peaked near 30 h and continued until 48 h after drug dosing before returning to baseline, whereas TAT expression showed a sharp rise to peak by 12 hours and returned to baseline by 18 hours (Figure 6A). Such differences in response profiles may be attributed to the differential rates of protein turnover, viz compare the half-lives of TAT (~4 h) versus cASAT (5–11 days) [11]. In addition to the aminotransferases, phenylalanine hydroxylase (PAH), which catalyzes the rate-limiting step of phenylalanine catabolism into tyrosine, was also significantly up-regulated in response to MPL, peaking at 30 hours (Figure 6B). This observation is in line with previous findings that GC administration stimulates PAH enzyme activity in rat liver in vivo [54]. Furthermore, tryptophan 2,3-dioxygenase, a sensitive GC-inducible enzyme that catalyzes amino acid tryptophan metabolism [55], was also strongly up-regulated (~7-fold) by 8 hours after MPL dosing (Figure 3B). These examples, along with others listed in Table 2A illustrate that MPL induces a number of hepatic amino-acid metabolizing enzymes that in turn provide gluconeogenic substrates for glucose production [56].
Drug-responsive proteins involved in hepatic glucose metabolism are listed in Table 2B. Net utilization and/or production of hepatic glucose production is controlled by the relative expression and activity of specific enzymes involved in the glycolytic or gluconeogenic pathways. Hepatic gluconeogenesis, the production of glucose from non-carbohydrate sources, is, activated either under fasting-conditions [56] or upon CS treatment [57, 58]. Hepatocytes contain rate-controlling enzymes specific for gluconeogenesis [pyruvate carboxylase (PC), phosphoenolpyruvate carboxykinase (PEPCK), fructose 1,6-bisphosphatase (1,6-FBPase), and glucose-6-phosphatase (G-6-P)] [59]. The time-course of PEPCK, the rate-limiting enzyme in gluconeogenesis, is shown in Figure 6C. It is evident that MPL strongly enhances the expression of PEPCK (~ 3.5-fold) by 5.5 hours, whereas PC and 1,6-FBPase are altered to much lower extents (data not shown). Mechanistically, stimulation of PEPCK transcription rate by CS occurs via GRE-binding in its promoter region [60]. The time-course of PEPCK enhancement correlated with plasma glucose concentrations measured in the same animals (Figure 6D).
Table 2B.
MPL-regulated proteins related to carbohydrate metabolism.
| UProt_ID | Gene Name | Protein Name | Function | Regulation |
|---|---|---|---|---|
| P85968 | Pgd | 6-phosphogluconate dehydrogenase | Pentose phosphate pathway - decarboxylation of 6-phosphogluconate to ribulose 5-phosphate and CO2 | UP |
| P85971 | Pgls | 6-phosphogluconolactonase (6PGL) | Pentose phosphate pathway - hydrolysis of 6-phosphogluconolactone to 6-phosphogluconate | UP |
| P04764 | Eno1 | Alpha-enolase | Glycolysis - conversion of 2-phosphoglycerate to phosphoenolpyruvate | UP/DOWN |
| P15429 | Eno3 | Beta-enolase-3 | Glycolysis - conversion of 2-phosphoglycerate (2-PG) to phosphoenolpyruvate (PEP) | DOWN/UP |
| P19112 | Fbp1 | Fructose-1,6-bisphosphatase 1 | Gluconeogenesis - catalyzes the hydrolysis of fructose 1,6-bisphosphate to fructose 6-phosphate | UP/DOWN |
| P05065 | Aldoa | Fructose-bisphosphate aldolase A | Catalyzes reversible reactions in both glycolysis and gluconeogenesis | UP |
| P00884 | Aldob | Fructose-bisphosphate aldolase B | Glycolytic subpathway - synthesizes D-glyceraldehyde 3-phosphate and glycerone phosphate from D-glucose | UP |
| Q6P6V0 | Gpi | Glucose-6-phosphate isomerase | Glycolysis - interconverts glucose-6-phosphate (G6P) and fructose-6-phosphate (F6P) | UP |
| P04797 | Gapdh | Glyceraldehyde-3-phosphate dehydrogenase (GAPDH) | Conversion of glyceraldehyde 3-phosphate to D-glycerate 1,3-bisphosphate | UP |
| P09811 | Pygl | Glycogen phosphorylase, liver form | Release glucose-1-phosphate from liver glycogen stores (rate-limiting) | UP |
| Q02974 | Khk | Ketohexokinase (Hepatic fructokinase) | Phosphorylation of fructose to fructose-1-phosphate | UP |
| P09367 | Sds | L-serine dehydratase/L-threonine deaminase | Gluconeogenesis - conversion of L-serine to pyruvate and L-threonine to 2-oxobutanoate | UP |
| P04636 | Mdh2 | Malate dehydrogenase, mitochondrial | Gluconeogenesis - reversibly catalyzes reduction of oxaloacetate to malate | UP |
| P07379 | Pck1 | Phosphoenolpyruvate carboxykinase, cytosolic | Gluconeogenesis - conversion of oxaloacetate to phosphoenolpyruvate (rate-limiting step) | UP |
| P38652 | Pgm1 | Phosphoglucomutase-1 | Breakdown and synthesis of glucose | UP/DOWN |
| P16617 | Pgk1 | Phosphoglycerate kinase 1 | Glycolysis - reversible reaction of 1,3-bisphosphoglycerate to 3-phosphoglycerate | UP |
| P16290 | Pgam2 | Phosphoglycerate mutase 2 | Glycolysis - reversible reaction of 3-phosphoglycerate to 2-phosphoglycerate | UP |
| P52873 | Pc | Pyruvate carboxylase, mitochondrial | Gluconeogenesis - irreversible carboxylation of pyruvate to form oxaloacetate | UP |
| P12928 | Pklr | Pyruvate kinase | Glycolysis - transfer of phosphate from phosphoenolpyruvate to ADP | UP/DOWN |
| P27867 | Sord | Sorbitol dehydrogenase | Carbohydrate metabolism - converts sorbitol to fructose | UP |
| P50137 | Tkt | Transketolase | Pentose phosphate pathway - transfers glycoaldehyde from ketose-donor to aldose-acceptor sugars | UP |
| P48500 | Tpi1 | Triosephosphate isomerase | Reversible interconversion of dihydroxyacetone phosphate (DHAP) and D-glyceraldehyde 3-phosphate | DOWN/UP |
MPL-responsive proteins involved in the processes of hepatic lipid and/or fatty acid metabolism are listed in Table 2C. The CS stimulate lipolysis in white adipose tissue producing free fatty acids for use by other tissues [61] and glycerol for gluconeogenesis [62]. In addition, CS also inhibit hepatic fatty acid β-oxidation [63], the process by which fatty acids are broken down in the mitochondria and/or in peroxisomes to generate acetyl-CoA which subsequently feeds into the Krebs cycle. Together, these effects trigger hepatic fat accumulation (steatosis) which is associated with the metabolic syndrome. Acyl-CoA dehydrogenases (ACAD) are mitochondrial enzymes that catalyze the initial rate-limiting step in the beta-oxidation of fatty acyl-CoA [64]. Multiple ACADs including long-chain specific acyl-CoA dehydrogenase (Acadl), medium-chain acyl-CoA dehydrogenase (Acadm), short/branched chain acyl-CoA dehydrogenase (Acadsb), and short-chain specific acyl-CoA dehydrogenase (Acads) were diversely altered by MPL, mostly displaying biphasic profiles (data not shown). In addition, as shown in Figure 3F, expression of peroxisomal 3-ketoacyl-CoA thiolase B, which catalyzes the final step in the peroxisomal β-oxidation of straight-chain acyl-CoA, was strongly down-regulated (~60%) by MPL by 18 hours.
Table 2C.
MPL-regulated proteins related to lipid/fatty acid metabolism.
| UProt_ID | Gene Name | Protein Name | Function | Regulation |
|---|---|---|---|---|
| Q8CHM7 | Hacl1 | 2-hydroxyacyl-CoA lyase 1 | Fatty acid alpha oxidation - carbon-carbon cleavage reaction | UP |
| P21775 | Acaa1a | 3-ketoacyl-CoA thiolase A, peroxisomal | Fatty acid beta oxidation - convert two units of acetyl-CoA to acetoacetyl CoA | UP/DOWN |
| P07871 | Acaa1b | 3-ketoacyl-CoA thiolase B, peroxisomal | Fatty acid beta oxidation - catalyzes the final step of beta-oxidation | DOWN |
| Q5XI22 | Acat2 | Acetyl-CoA acetyltransferase, cytosolic | Degradative pathways such as fatty acid beta-oxidation | UP |
| P11497 | Acaca | Acetyl-CoA carboxylase 1 | Rate-limiting reaction in the biogenesis of long-chain fatty acids | UP |
| Q9QXG4 | Acss2 | Acetyl-coenzyme A synthetase, cytoplasmic | Activates acetate for use in lipid synthesis or energy generation | UP |
| Q14DH7 | Acss3 | Acyl-CoA synthetase short-chain family member 3, mitochondrial | Activates acetate for use in lipid synthesis or energy generation | UP |
| P70473 | Amacr | Alpha-methylacyl-CoA racemase | Bile acid biosynthesis; racemization of 2-methyl-branched fatty acid CoA esters | UP/DOWN |
| P23965 | Eci1 | Enoyl-CoA delta isomerase 1, mitochondrial | Fatty acid metabolism - isomerizes both 3-cis and trans double bonds into enoyl-CoA species | UP |
| P14604 | Echs1 | Enoyl-CoA hydratase, mitochondrial | Fatty acid beta oxidation - Hydration of 2-trans-enoyl-coenzyme A (CoA) intermediates | DOWN/UP |
| P12785 | Fasn | Fatty acid synthase | Formation of long-chain fatty acids from acetyl-CoA, malonyl-CoA and NADPH | UP |
| P55053 | Fabp5 | Fatty acid-binding protein, epidermal | High specificity for fatty acids | UP/DOWN |
| P97612 | Faah1 | Fatty-acid amide hydrolase 1 | Degrades bioactive fatty acid amides like oleamide, and the endogenous cannabinoid, anandamide | UP |
| O35077 | Gpd1 | Glycerol-3-phosphate dehydrogenase | Reversible conversion of dihydroxyacetone phosphate to glycerol-3-phosphate | UP |
| Q9WVK7 | Hadh | Hydroxyacyl-coenzyme A dehydrogenase, mitochondrial | Fatty acid beta oxidation - short chain fatty acids | UP |
| P97519 | Hmgcl | HMG-CoA lyase, mitochondrial | Key enzyme in ketogenesis | UP |
| P17425 | Hmgcs1 | HMG-CoA synthase, cytoplasmic | Condenses acetyl-CoA with acetoacetyl-CoA to form HMG-CoA | UP/DOWN |
| P22791 | Hmgcs2 | HMG-CoA synthase, mitochondrial | Condenses acetyl-CoA with acetoacetyl-CoA to form HMG-CoA | UP |
| O35760 | Idi1 | Isopentenyl-diphosphate Delta-isomerase 1 | Regulation of farnesyl diphosphate and cholesterol synthesis | DOWN/UP |
| P15650 | Acadl | Long-chain specific acyl-CoA dehydrogenase (LCAD) | Fatty acid beta oxidation - catalyze the initial step of mitochondrial beta-oxidation of straight- chain fatty acid | UP/DOWN |
| P18163 | Acsl1 | Long-chain-fatty-acid-CoA ligase 1 | Activates long-chain fatty acids for synthesis of cellular lipids and degradation via beta-oxidation | UP |
| O88813 | Acsl5 | Long-chain-fatty-acid-CoA ligase 5 | Activates long-chain fatty acids for synthesis of cellular lipids, and degradation via beta-oxidation | UP |
| P08503 | Acadm | Medium-chain acyl-CoA dehydrogenase, mitochondrial | Fatty acid metabolism - catalyzes the initial step of fatty acid beta-oxidation | UP |
| Q9Z2M4 | Decr2 | Peroxisomal 2,4-dienoyl-CoA reductase | Degradation of unsaturated fatty enoyl-CoA esters in peroxisome | DOWN |
| P07872 | Acox1 | Peroxisomal acyl-coenzyme A oxidase 1 | Fatty acid beta-oxidation - desaturation of acyl-CoAs to 2-trans-enoyl-CoAs | UP/DOWN |
| P97562 | Acox2 | Peroxisomal acyl-coenzyme A oxidase 2 | Fatty acid beta-oxidation - oxidizes the CoA esters of bile acid intermediates | UP |
| Q63448 | Acox3 | Peroxisomal acyl-coenzyme A oxidase 3 | Fatty acid beta-oxidation | UP/DOWN |
| P07896 | Ehhadh | Peroxisomal bifunctional enzyme | Fatty acid beta oxidation - contains enoyl-CoA hydratase as well as 3-hydroxyacyl-CoA dehydrogenase activity | DOWN |
| P97852 | Hsd17b4 | Peroxisomal multifunctional enzyme type 2 | Fatty acid beta oxidation - formation of 3-ketoacyl-CoA intermediates from straight-chain fatty acids | DOWN |
| Q9WVK3 | Pecr | Peroxisomal trans-2-enoyl-CoA reductase | Chain elongation of fatty acids | UP |
| P57093 | Phyh | Phytanoyl-CoA dioxygenase, peroxisomal | Fatty acid metabolism - converts phytanoyl-CoA to 2-hydroxyphytanoyl-CoA | UP |
| P14882 | Pcca | Propionyl-CoA carboxylase alpha chain, mitochondrial | Fatty acid beta oxidation - catalyses the carboxylation reaction of propionyl CoA to form (S)-methylmalonyl CoA | UP |
| P70584 | Acadsb | Short/branched chain acyl-CoA dehydrogenase, mitochondrial | Fatty acid beta oxidation - greatest activity toward short branched chain acyl-CoA derivatives | UP/DOWN |
| P15651 | Acads | Short-chain specific acyl-CoA dehydrogenase (SCAD) | Fatty acid beta oxidation - catalyze the initial step of mitochondrial beta-oxidation of straight-chain fatty acid | UP/DOWN |
| Q5PPL3 | Nsdhl | Sterol-4-alpha-carboxylate 3-dehydrogenase | Cholesterol biosynthesis | UP |
| Q64428 | Hadha | Trifunctional enzyme subunit alpha, mitochondrial | Catalyzes the final step of beta-oxidation | UP |
| Q60587 | Hadhb | Trifunctional enzyme subunit beta, mitochondrial | Catalyzes the final step of beta-oxidation | UP |
| P45953 | Vlcad | Very long-chain specific acyl-CoA dehydrogenase, mitochondrial | Fatty-acid metabolism - esters of very long chain fatty acids such as palmitoyl-CoA | UP |
Altered proteins related to the Krebs (tricarboxylic acid) cycle are listed in Table 2D. Requirement of a separate Krebs cycle group is justified by the fact that this process serves as key metabolic pathway that unifies carbohydrate, fat, and protein metabolism. Metabolic intermediates produced from all three energy sources feed into the Krebs cycle and undergo oxidative reactions to ultimately generate ATP. While metabolic stress as well as GC are known to influence the activity of the Krebs cycle [65], little information exists regarding the specific proteins altered by CS. The time-profiles of two well-known Krebs cycle-related proteins, succinate dehydrogenase (Figure 6E) and malate dehydrogenase (Figure 6F), are shown. Both proteins were modestly up-regulated (~1.5-fold), the former peaking around 5.5 hours whereas the latter peaked by 8 hours.
Table 2D.
MPL-regulated proteins related to the Krebs (Tricarboxylic acid) cycle.
| UProt_ID | Gene Name | Protein Name | Function | Regulation |
|---|---|---|---|---|
| Q4KLP0 | Dhtkd1 | 2-oxoglutarate dehydrogenase E1 | Conversion of 2-oxoglutarate to succinyl-CoA and CO2 | UP |
| Q9ER34 | Aco2 | Aconitate hydratase, mitochondrial | Isomerization of citrate to isocitrate via cis-aconitate | UP/DOWN |
| P41562 | Idh1 | NADP-isocitrate dehydrogenase | Reversible oxidative decarboxylation of isocitrate to yield α-ketoglutarate (α-KG) | UP/DOWN |
| P14408 | Fh | Fumarate hydratase, mitochondrial | Formation of L-malate from fumarate | UP/DOWN |
| O88989 | Mdh1 | Malate dehydrogenase | Reversible oxidation of malate to oxaloacetate | UP |
| P16332 | Mut | Methylmalonyl-CoA mutase, mitochondrial | Degradation of amino acids, odd-chain fatty acids and cholesterol via propionyl-CoA | UP |
| Q920L2 | Sdha | Succinate dehydrogenase, mitochondrial | Electron transfer from succinate to ubiquinone (coenzyme Q) | UP/DOWN |
| Q9Z2I9 | Sucla2 | Succinyl-CoA ligase [ADP-forming] subunit beta, mitochondrial | ATP-dependent ligation of succinate and CoA to form succinyl-CoA | UP/DOWN |
| Q9Z2I8 | Suclg2 | Succinyl-CoA ligase [GDP-forming] subunit beta, mitochondrial | GTP-dependent ligation of succinate and CoA to form succinyl-CoA | UP |
| P00481 | Otc | Ornithine carbamoyltransferase, mitochondrial | Catalyzes the second step of the urea cycle | UP/DOWN |
| P13697 | Mod-1 | NADP-dependent malic enzyme | Reversible oxidative decarboxylation of malate; links the glycolytic and citric acid cycles. | UP |
Transcription, Translation, and Protein-processing
Another highly populated group consisting of 73 proteins altered by MPL contains those related to transcription, translation, and post-translational protein processing (Table 3). Representative examples are presented in Figure 7. A majority of proteins in this group function as nuclear proteins regulating transcription, specialized ribosomal protein subunits involved in translation, and enzymes or chaperone proteins which facilitate post-translational protein folding and/or glycosylation. A number of heterogeneous nuclear ribonucleoproteins (hnRNPs), which are present as complexes of RNA and protein in the cell nucleus during gene transcription of the newly synthesized RNA (pre-mRNA) [66], were up-regulated in response to MPL. In particular, hnRNPU, which is reported to interact with nuclear GR complex to regulate transcription in vivo [67], was modestly up-regulated by 2 hours before a slow return to baseline (Figure 7A). The hnRNPA2/B1, which is involved in DNA replication and repair, gene transcription, pre-mRNA splicing, and nucleo-cytoplasmic mRNA export [68], showed a sharp (12-fold) rise to peak at 4 hours and promptly returned to baseline by 5.5 hours (Figure 7B). In addition, nucleolin, a histone chaperone that regulates chromatin remodeling and gene transcription [69], and also interacts with GR [70] was up-regulated to peak by 18 hours and returned to baseline only at 66 hours (Figure 7C). In regard to protein translation, a number of ribosomal protein subunits of both 60S and 40S complexes were altered over time, mostly being up-regulated by MPL. While functional information on all the subunits is unavailable, specialized roles of some ribosomal proteins are listed in Table 3. Additionally, expression of isozymes involved in the post-translational modification (PTM) of nascent peptides such as dolichyl-diphosphooligosaccharide glycosyltransferases, protein disulfide-isomerases, and peptidyl-prolyl cis-trans isomerases were diversely altered in response to MPL (data not shown).
Table 3.
MPL-regulated proteins related to transcription, translation, and (post-translational) protein processing.
| UProt_ID | Gene Name | Protein Name | Function | Regulation |
|---|---|---|---|---|
| TRANSCRIPTION | ||||
| P13383 | Ncl | Nucleolin (Protein C23) | Induces chromatin decondensation by binding to histone H1 | UP |
| Q99020 | Hnrnpab | Heterogeneous nuclear ribonucleoprotein A/B | Transcriptional repressor | UP |
| Q794E4 | Hnrnpf | Heterogeneous nuclear ribonucleoprotein F | Regulation of alternative splicing events | UP |
| P61980 | Hnrnpk | Heterogeneous nuclear ribonucleoprotein K | pre-mRNA-binding protein; role in p53/TP53 response to DNA damage | UP |
| Q8VEK3 | Hnrnpu | Heterogeneous nuclear ribonucleoprotein U | Circadian regulation of the core clock component ARNTL/BMAL1 transcription | UP |
| A7VJC2 | hnRNPA2/B1 | Heterogeneous nuclear ribonucleoproteins A2/B1 | pre-mRNA processing and mRNA metabolism and transport | UP |
| P60843 | Eif4a1 | Eukaryotic initiation factor 4A-I | RNA helicase - cap recognition and is required for mRNA binding to ribosome | UP |
| Q5RKI1 | Eif4a2 | Eukaryotic initiation factor 4A-II (eIF-4A-II) | RNA helicase required for mRNA binding to ribosome | UP |
| Q6NZJ6 | Eif4g1 | Eukaryotic translation initiation factor 4 gamma 1 | Recognition of the mRNA cap and recruitment of mRNA to the ribosome | UP |
| P43274 | H1f4 | Histone H1.4 | Condense nucleosome chains into chromatin fibers; regulator of gene transcription by chromatin remodeling | UP/DOWN |
| Q9D2U9 | Hist3h2ba | Histone H2B type 3-A | Component of nucleosome; role in transcription , DNA repair, DNA replication and chromosomal stability | UP |
| P84245 | H3.3 | Histone H3.3 | Incorporated into chromatin independently of DNA synthesis | UP |
| P62804 | Hist4 | Histone H4 | Component of nucleosome; role in transcription , DNA repair, DNA replication and chromosomal stability | UP |
| P62961 | Nsep1 | Nuclease-sensitive element-binding protein 1 | pre-mRNA alternative splicing, binds and stabilizes cytoplasmic mRNA | DOWN/UP |
| Q00438 | Ptbp1 | Polypyrimidine tract-binding protein 1 | Role in pre-mRNA splicing and in the regulation of alternative splicing events | UP |
| P48679 | Lmna | Prelamin-A/C | Role in nuclear assembly, chromatin organization, nuclear membrane and telomere dynamics | UP/DOWN |
|
| ||||
| TRANSLATION | ||||
| P02401 | Rplp2 | 60S acidic ribosomal protein P2 | Component protein of the 60S ribosomal protein; role in the elongation step of protein synthesis | UP |
| P04644 | Rps17 | 40S ribosomal protein S17 | Component protein of the 40S ribosomal protein | UP |
| P05426 | Rpl7 | 60S ribosomal protein L7 | Component protein of the 60S ribosomal protein; inhibitor of cell-free translation of mRNAs | UP |
| P12001 | Rpl18 | 60S ribosomal protein L18 | Component protein of the 60S ribosomal protein | UP |
| P17077 | Rpl9 | 60S ribosomal protein L9 | Component protein of the 60S ribosomal protein | UP |
| P86048 | Rpl10l | 60S ribosomal protein L10 | Component of the 60S ribosomal subunit | UP |
| P19944 | Rplp1 | 60S acidic ribosomal protein P1 | Component protein of the 60S ribosomal protein; elongation step of protein synthesis | DOWN/UP |
| P21531 | Rpl3 | 60S ribosomal protein L3 (L4) | Component protein of the 60S ribosomal protein | UP |
| P21533 | Rpl6 | 60S ribosomal protein L6 | Component protein of the 60S ribosomal protein | UP |
| P23358 | Rpl12 | 60S ribosomal protein L12 | Component protein of the 60S ribosomal protein | UP |
| P24049 | Rpl17 | 60S ribosomal protein L17 | Component protein of the 60S ribosomal protein | UP |
| P29314 | Rps9 | 40S ribosomal protein S9 | Component protein of the 40S ribosomal protein | UP |
| P47198 | Rpl22 | 60S ribosomal protein L22 | Component protein of the 60S ribosomal protein | UP |
| P62909 | Rps3 | 40S ribosomal protein S3 | Component of the 40S ribosomal subunit; role in repair of damaged DNA | UP |
| P49242 | Rps3a | 40S ribosomal protein S3a | Component of the 40S ribosomal subunit; erythropoiesis through regulation of transcription factor DDIT3 | UP |
| P50878 | Rpl4 Rpl1 | 60S ribosomal protein L4 (60S ribosomal protein L1) | Component protein of the 60S ribosomal protein | UP |
| P62083 | Rps7 | 40S ribosomal protein S7 | Component of the 40S ribosomal subunit; rRNA maturation | UP |
| P62250 | Rps16 | 40S ribosomal protein S16 | Component of the 40S ribosomal subunit | UP |
| P62271 | Rps18 | 40S ribosomal protein S18 | Component of the 40S ribosomal subunit; contacts several helices of the 18S rRNA | UP/DOWN |
| P62425 | Rpl7a | 60S ribosomal protein L7a | Interaction with nuclear hormone receptors, including thyroid hormone receptor | UP |
| P62703 | Rps4x | 40S ribosomal protein S4, X isoform | Component of the 40S ribosomal subunit | UP/DOWN |
| P62752 | Rpl23a | 60S ribosomal protein L23a | Component protein of the 60S ribosomal protein | UP |
| P62856 | Rps26 | 40S ribosomal protein S26 | Component of the 40S ribosomal subunit | UP |
| P62902 | Rpl31 | 60S ribosomal protein L31 | Component protein of the 60S ribosomal protein | UP |
| P15178 | Dars | Aspartate-tRNA ligase, cytoplasmic | Specific attachment of an amino acid to its cognate tRNA during translation | UP |
| Q8CGC7 | Eprs | Bifunctional glutamate/proline-tRNA ligase | Attachment of the cognate amino acid to the corresponding tRNA | UP |
| Q5XHY5 | Tars | Threonine--tRNA ligase, cytoplasmic | Aminoacyl-tRNA biosynthesis | UP |
| P62630 | Eef1a1 | Elongation factor 1-alpha 1 | Promotes the GTP-dependent binding of aminoacyl-tRNA to ribosomes during protein biosynthesis | UP |
| P62632 | Eef1a2 | Elongation factor 1-alpha 2 | Promotes the GTP-dependent binding of aminoacyl-tRNA to ribosomes during protein biosynthesis | UP |
| O70251 | Eef1b | Elongation factor 1-beta (EF-1-beta) | Stimulate the exchange of GDP bound to EF-1-alpha to GTP | UP |
| Q68FR9 | Eef1d | Elongation factor 1-delta | Enzymatic delivery of aminoacyl tRNAs to the ribosome | UP |
| Q68FR6 | Eef1g | Elongation factor 1-gamma | Enzymatic delivery of aminoacyl tRNAs to the ribosome | UP |
| P05197 | Eef2 | Elongation factor 2 | GTP-dependent ribosomal translocation step during translation elongation | UP |
| P52759 | Psp1 | Ribonuclease UK114 | Inhibition of translation by cleaving mRNA | UP |
|
| ||||
| POST-TRANSLATIONAL PROCESSING | ||||
| P07153 | Rpn1 | Dolichyl-diphosphooligosaccharide glycosyltransferase 1 | Protein glycosylation | UP |
| P25235 | Rpn2 | Dolichyl-diphosphooligosaccharide glycosyltransferase 2 | Protein glycosylation | UP |
| Q641Y0 | Ddost | Dolichyl-diphosphooligosaccharide glycosyltransferase 48 | Protein glycosylation | UP |
| Q66HD0 | Hsp90b1 | Heat shock protein 90 kDa beta member 1 (Endoplasmin) | Molecular chaperone - processing and transport of secreted proteins | UP |
| Q9D0S9 | Hint2 | Histidine triad nucleotide-binding protein 2, mitochondrial | Control of oxidative protein folding in the endoplasmic reticulum | UP/DOWN |
| P28480 | Tcp1 | T-complex protein 1 subunit alpha | Molecular chaperone - folding of proteins upon ATP hydrolysis | UP |
| Q5XIM9 | Cctb | T-complex protein 1 subunit beta (TCP-1-beta) | Molecular chaperone - assists the folding of proteins upon ATP hydrolysis | UP |
| Q68FQ0 | Cct5 | T-complex protein 1 subunit epsilon (TCP-1-epsilon) | Molecular chaperone - folding of proteins upon ATP hydrolysis | UP |
| Q6P502 | Cct3 | T-complex protein 1 subunit gamma | Molecular chaperone - folding of proteins upon ATP hydrolysis | UP |
| Q9D1Q6 | Txndc4 | Thioredoxin domain-containing protein 4 | Post-translational modifications of proteins | UP |
| Q9JLA3 | Uggt1 | UDP-glucose:glycoprotein glucosyltransferase 1 | Quality control for protein folding in the endoplasmic reticulum | UP |
| P04785 | P4hb | Protein disulfide-isomerase | Formation, breakage and rearrangement of disulfide bonds | UP |
| P11598 | Pdia3 | Protein disulfide-isomerase A3 | Rearrangement of disulfide (-S-S-) bonds in proteins | UP |
| P38659 | Pdia4 | Protein disulfide-isomerase A4 | Rearrangement of disulfide (-S-S-) bonds in proteins | UP |
| Q63081 | Pdia6 | Protein disulfide-isomerase A6 | Rearrangement of disulfide (-S-S-) bonds in proteins; may also inhibit aggregation of misfolded proteins | UP |
| P17879 | Hspa1b | Heat shock 70 kDa protein 1B | Folding of newly translated polypeptides | UP |
| P06761 | Hspa5 | Heat shock 70 kDa protein 5 | Assembly of multimeric protein complexes inside the endoplasmic reticulum | UP |
| P26772 | Hspe1 | 10 kDa heat shock protein, mitochondrial | Protein folding; also a molecular chaperone | DOWN/UP |
| P10111 | Ppia | Peptidyl-prolyl cis-trans isomerase A | Protein folding - cis-trans isomerization of proline imidic peptide bonds in oligopeptides | DOWN/UP |
| P24368 | Ppib | Peptidyl-prolyl cis-trans isomerase B (PPIase B) | Protein folding - cis-trans isomerization of proline imidic peptide bonds in oligopeptides | UP |
| Q923V8 | 15-Sep | 15-kDa selenoprotein | Protein folding - redox reactions associated with the formation of disulfide bonds | UP |
Figure 7.

Temporal response profiles of three proteins involved in the regulation of transcription, translation, and protein processing. Closed circles represent the mean and the error bars one standard deviation.
Metabolism and Transport of Small Molecules
The proteins classified under this group are involved in the production, processing, and degradation, or transport of endogenous compounds, xenobiotics, and therapeutic drugs. The liver is highly involved in the elimination of potentially toxic endogenous by-products as well as in the biotransformation of exogenous lipophilic chemicals (e.g. drugs and pesticides) into more water-soluble products that are excretable in urine. For the purpose of a more in-depth functional classification, hepatic metabolizing enzymes were further sub-clustered into groups comprising the cytochrome P450 (CYP) (Phase-I) enzymes (Table 4A), Phase-II enzymes (Table 4B), or other metabolic enzymes (Table 4C), while proteins involved in the active or facilitated transport of endogenous and/or drug compounds are listed in Table 5. A total of 62 hepatic metabolizing enzymes were found to be differentially regulated by MPL of which 20 were CYP enzymes, 14 Phase-II enzymes, and 28 other enzymes involved in small molecule metabolism.
Table 4B.
MPL-regulated Phase-II enzymes related to drug/xenobiotic/endogenous substrate metabolism.
| UProt_ID | Gene Name | Protein Name | Function | Regulation |
|---|---|---|---|---|
| Q64550 | Ugt1a1 | UDP-glucuronosyltransferase 1A1 | Drugs = opioids, SN-38 (irinotecan); endogenous substrates = bilirubin, ethinylestradiol; polymorphic enzyme | DOWN/UP |
| Q62452 | Ugt1a9 | UDP-glucuronosyltransferase 1A9 | Drugs = R-oxepam, mycophenolic acid, SN-38 (irinotecan); halogenated phenols; polymorphic enzyme | DOWN |
| P09875 | Ugt2b1 | UDP-glucuronosyltransferase 2B1 | Drug = diclofenac ; bisphenol A (environmental chemical) | UP |
| P36511 | Ugt2b15 | UDP-glucuronosyltransferase 2B15 | Drug = S-oxazepam, paracetamol, (+)-menthol, and eugenol; polymorphic enzyme | UP |
| P08542 | Ugt2b17 | UDP-glucuronosyltransferase 2B17 | Drug = MK-7246; endogenous substrates = steroid hormones; polymorphic enzyme | UP |
| P08541 | Ugt2b2 | UDP-glucuronosyltransferase 2B2 | Endogenous substrates = triiodothyronine, androsterone | UP |
| P17988 | Sult1a1 | Sulfotransferase 1A1 | Sulfate conjugation of catecholamines, phenolic drugs and neurotransmitters | UP |
| P50237 | Sult1c1 | Sulfotransferase 1C1 | Sulfonation of p-nitrophenol and N-hydroxy-2-acetylaminofluorene | UP/DOWN |
| P22789 | St2a2 | Sulfotransferase 2A2 | Sulfonation of hydroxysteroids and xenobiotics | UP |
| P52847 | Sult1b1 | Sulfotransferase 1B1 | Major SULT in liver; sulfonation of 4-methyllumbellferone, p-nitrophenol, and 1-naphthol | UP |
| P08011 | Gst1 | Glutathione S-transferase 1 (microsomal) | Drugs = chlorambucil, BCNU | UP |
| Q5PQT3 | Glyat | Glycine N-acyltransferase | Detoxification of salicylic acid and benzoic acid by glycine conjugation | UP |
| P22734 | Comt | Catechol O-methyltransferase | Inactivation of catecholamine neurotransmitters and hormones | UP |
| P49889 | Ste | Estrogen sulfotransferase, isoform 3 | Sulfate conjugation of estradiol and estrone | UP/DOWN |
Table 4C.
Other MPL-regulated enzymes related to drug/xenobiotic/endogenous substrate metabolism.
| UProt_ID | Gene Name | Protein Name | Function | Regulation |
|---|---|---|---|---|
| Q64563 | Adh4 | Alcohol dehydrogenase 4 | Reduction of benzoquinones | UP |
| P12711 | Adh5 | Alcohol dehydrogenase class-3 | Ineffective in oxidizing ethanol, but it readily catalyzes the oxidation of long-chain primary alcohols | UP/DOWN |
| P06757 | Adh1 | Alcohol dehydrogenase 1 | Conversion of primary unbranched alcohols to their corresponding aldehydes | UP |
| P30839 | Aldh3a2 | Aldehyde dehydrogenase 4, microsomal | Oxidation of long-chain aliphatic aldehydes to fatty acids | UP/DOWN |
| Q8BH00 | Aldh8a1 | Aldehyde dehydrogenase family 8 member A1 | Converts 9-cis-retinal to 9-cis-retinoic acid | UP |
| Q66HF8 | Aldh1b1 | Aldehyde dehydrogenase 1B1, mitochondrial | Ethanol degradation - transformation from acetaldehyde to acetic acid | UP |
| Q8K009 | Aldh1l2 | Aldehyde dehydrogenase 1L2, mitochondrial | Formate oxidation (homolog of 10-formyltetrahydrofolate dehydrogenase) | UP |
| Q9JLJ3 | Aldh9a1 | Aldehyde dehydrogenase 9A1 | Carnitine biosynthesis | UP |
| P13601 | Aldh1a7 | Aldehyde dehydrogenase 1A7, cytosolic | Oxidizes benzaldehyde, propionaldehyde and acetaldehyde | UP |
| P11884 | Aldh2 | Aldehyde dehydrogenase, mitochondrial | Ethanol degradation - catalyzes the transformation from acetaldehyde to acetic acid | UP |
| Q9Z0U5 | Aox1 | Aldehyde oxidase 1 | Metabolizes aldehyde compounds and drugs containing aromatic azaheterocyclic substituents | UP |
| P31210 | Akr1d1 | Aldo-keto reductase 1D1 | Reduction of progesterone, androstenedione, and testosterone to 5-beta-reduced metabolites | UP |
| Q63276 | Baat | Bile acid-CoA:amino acid N-acyltransferase | Glycine and/or taurine conjugation for biliary excretion | UP/DOWN |
| Q9ES38 | Slc27a5 | Bile acyl-CoA synthetase | Glycine and/or taurine conjugation for biliary excretion | UP/DOWN |
| P16303 | Ces1d | Carboxylesterase 1D | Metabolism of xenobiotics and of natural substrates; hydrolyzes triacylglycerols and monoacylglycerols | UP |
| P28037 | Aldh1l1 | Cytosolic 10-formyltetrahydrofolate dehydrogenase | Folate metabolism - interconversion of tetrahydrofolate molecules | UP |
| P07687 | Ephx1 | Epoxide hydrolase 1, microsomal | Hydrolysis of arene and aliphatic epoxides to less reactive and more water soluble dihydrodiols | UP |
| Q923D2 | Blvrb | Flavin reductase | NADPH-dependent reduction of flavins, such as riboflavin, FAD or FMN, and biliverdins | UP |
| P00388 | Por | NADPH-cytochrome P450 reductase | Required for electron transfer from NADP to cytochrome P450 in microsomes | UP |
| P97524 | Slc27a2 | Solute carrier family 27 member 2 (THCA-CoA ligase) | Bile acid metabolism | UP |
| P23457 | Akr1c9 | Dihydrodiol dehydrogenase | Inactivates several endogenous steroid hormones | UP |
| Q9EQ76 | Fmo3 | Dimethylaniline monooxygenase | Oxidative metabolism of a variety of xenobiotics such as drugs and pesticides | UP |
| P36365 | Fmo1 | Hepatic flavin-containing monooxygenase 1 | Oxidative metabolism of a variety of xenobiotics such as drugs and pesticides | UP |
| P20070 | Cyb5r3 | NADH-cytochrome b5 reductase 3 | Desaturation and elongation of fatty acids, cholesterol biosynthesis, and drug metabolism | UP |
| P55159 | Pon1 | Serum paraoxonase/arylesterase 1 | Hydrolyzes the toxic metabolites of a variety of organophosphorus insecticides | UP |
| Q6AXM8 | Pon2 | Serum paraoxonase/arylesterase 2 (PON 2) | Hydrolysis of lactones and aromatic carboxylic acid esters | UP |
| Q68FP2 | Pon3 | Serum paraoxonase/lactonase 3 | Hydrolysis of lactones such as statin prodrugs | UP |
| P17764 | Acat1 | Acetyl-CoA acetyltransferase, mitochondrial | Ketone body metabolism | UP |
Table 5.
MPL-regulated proteins involved in active/facilitated transport of endogenous and drug compounds.
| UProt_ID | Gene Name | Protein Name | Function | Regulation |
|---|---|---|---|---|
| P63039 | Hsp60 | 60 kDa heat shock protein, mitochondrial | Mitochondrial protein import and macromolecular assembly | UP |
| P11030 | Dbi | Acyl-CoA-binding protein | Intracellular carrier of acyl-CoA esters | UP |
| P61751 | Arf4 | ADP-ribosylation factor 4 | Protein trafficking; may modulate vesicle budding and uncoating within the Golgi apparatus | UP |
| P62332 | Arf6 | ADP-ribosylation factor 6 | Endocytic recycling and cytoskeleton remodeling | UP |
| P41034 | Ttpa | Alpha-tocopherol transfer protein | Binds alpha-tocopherol, enhances its transfer between separate membranes, and stimulates release from liver | UP |
| P02650 | Apoe | Apolipoprotein E (Apo-E) | Binding, internalization, and catabolism of lipoprotein particles; ligand for hepatic LDL-receptor | UP/DOWN |
| P15999 | Atp5a1 | ATP synthase subunit alpha, mitochondrial | Mitochondrial membrane ATP synthase | UP |
| P10719 | Atp5b | ATP synthase subunit beta, mitochondrial | Mitochondrial membrane ATP synthase | UP |
| P31399 | Atp5h | ATP synthase subunit d, mitochondrial (ATPase subunit d) | Mitochondrial membrane ATP synthase | UP |
| P29419 | Atp5i | ATP synthase subunit e, mitochondrial | Mitochondrial membrane ATP synthase | UP/DOWN |
| P35435 | Atp5c1 | ATP synthase subunit gamma, mitochondrial | Mitochondrial membrane ATP synthase | UP |
| Q06647 | Atp5o | ATP synthase subunit O, mitochondrial | Mitochondrial membrane ATP synthase | UP/DOWN |
| Q8K442 | Abca8a | ATP-binding cassette sub-family A member 8-A | ATP-dependent lipophilic drug transporter (e.g. substrate = digoxin) | UP |
| O70127 | Bsep | Bile salt export pump | ATP-dependent secretion of bile salts into the canaliculus of hepatocytes | UP |
| P11915 | Scp2 | Non-specific lipid-transfer protein | Transfer of common phospholipids, cholesterol and gangliosides between membranes | UP |
| P61107 | Rab14 | Ras-related protein Rab-14 | Endocytic transport of ADAM10, N-cadherin/CDH2 shedding and cell-cell adhesion | UP |
| P10536 | Rab1b | Ras-related protein Rab-1B | Regulates vesicular transport between the endoplasmic reticulum and successive Golgi compartments | UP |
| P09527 | Rab7a | Ras-related protein Rab-7a | Endo-lysosomal maturation and trafficking; also involved in growth-factor cell signaling | UP |
| Q9Z1J8 | Sec14l3 | SEC14-like protein 3 | Transport of hydrophobic ligands like tocopherol, squalene and phospholipids | UP |
| Q9QXX4 | Slc25a13 | Solute carrier family 25 member 13 | Calcium-dependent exchange of cytoplasmic glutamate with mitochondrial aspartate | UP |
| Q09073 | Slc25a5 | Solute carrier family 25 member 5 | Exchange of cytoplasmic ADP with mitochondrial ATP across the mitochondrial inner membrane | DOWN/UP |
| O35913 | Oatp1a4 | Solute carrier organic anion transporter family member 1A4 | Sodium-independent transport of organic anions | DOWN |
| Q9JMD3 | Stard10 | StAR-related lipid transfer protein 10 | Phospholipid transfer protein | UP |
| Q9Z2L0 | Vdac1 | Voltage-dependent anion-selective channel protein 1 | Facilitated diffusion of small hydrophilic molecules across mitochondrial outer membrane | UP |
| P81155 | Vdac2 | Voltage-dependent anion-selective channel protein 2 | Facilitated diffusion of small hydrophilic molecules across mitochondrial outer membrane | DOWN |
While a number of CYPs were up-regulated by MPL, dynamic changes in protein abundance of three CYP enzymes, CYP2C13, CYP2D10, and CYP3A2 (Figures 8A–C) as measured by proteomic profiling are shown. In all three instances, hepatic CYP protein expression was increased by 2–3 fold, peaking at 5.5 hours (2C13 and 2D10) or at 12 hours (3A2). In addition, CYP2A1 showed complex biphasic regulation over time (Figure 3D). In rat, CYP3A2 is the main constitutive liver enzyme; sharing 73% homology in the amino acid sequence, some substrate preference and functional analogies to human CYP3A4 [71], which metabolizes a wide range of drugs and endogenous compounds. Our finding that MPL enhances CYP3A2 expression in the rat is in line with previous findings that dexamethasone (DEX) induces CYP3A2 mRNA and protein expression as well as enzyme activity in rat liver [72].
Figure 8.

Temporal response profiles of representative proteins involved in transport and metabolism of endogenous substrates, xenobiotics, and/or drugs. Closed circles represent the mean and the error bars one standard deviation.
The expression profiles of two major Phase-II conjugation enzymes, sulfonyltransferase 1A1 (SULT1A1) and UDP-glucuronosyltransferase 1A1 (UGT1A1) are depicted in Figures 8D and 8E. Both enzymes showed distinct and interesting patterns of regulation. SULT1A1 was up-regulated to peak expression by 18 hours (~2 fold) and remained enhanced until 48 hours, before starting to decline to baseline at 66 hours. UGT1A1 displayed strong biphasic behavior; expression was down-regulated (~40%) by 2 hours, followed by a sharp rise to peak around 8 hours before eventually returning to baseline. SULT1A1 is involved in the conjugation of 3′-phosphoadenosine-5′-phosphosulfate (PAPS) to several endogenous and exogenous substrates such as hormones (e.g. thyroid hormone) [73], neurotransmitters (e.g. dopamine) [73], and phenolic compounds [74]; whereas UGT1A1 catalyzes the conjugation of UDP-glucuronic acid to small, hydrophobic molecules such as bilirubin [75], ethinylestradiol [76], opioids [77], and the active metabolite of irinotecan, SN-38 [78].
Other MPL-regulated enzymes related to small molecule metabolism are listed in Table 4C. Carboxylesterases are ubiquitously distributed in mammalian tissues, and show highest activity in liver microsomes [79]. They play an important role in the hydrolytic biotransformation of several drugs, especially those containing ester or amide bonds [79] such as methylphenidate and clopidogrel. Carboxylesterase 1D showed an unusual profile in response to MPL, where expression remained at baseline levels until 12 hours before sharply rising to peak (~6-fold) by 18 hours and eventually returning to baseline by 48 hours (Figure 8F). NADPH:CYP oxidoreductase (POR) is an essential component for all microsomal CYP monooxygenases, to which it transfers electrons originating from NADPH [80]. POR expression showed a delayed enhancement profile, where it increased in a time-dependent manner (~2.5-fold) for up to 30 hours, before declining to baseline (Figure 8G).
There were 25 proteins involved in the intracellular transport and/or excretion (i.e. influx or efflux) of endogenous compounds and xenobiotics that were significantly altered by MPL dosing (Table 5). Of note, protein expression of bile salt export pump (BSEP), an important liver-specific efflux transporter located on the canalicular membrane of hepatocytes involved in the biliary excretion of monovalent bile salts [81], was modestly up-regulated (~1.7-fold) by 8 hours after MPL dosing (Figure 8H). This observation is consistent with previous reports of DEX-mediated Bsep mRNA induction in cultured rat hepatocytes [82].
Immune Regulation
Table 6 lists and describes 11 proteins related to immune and/or inflammatory processes that were significantly altered by MPL, with representative examples presented in Figure 9. Over half of these proteins were found to be involved in the hepatic acute phase response, which plays a significant role in tissue and organ protection in response to diverse stimuli [83]. The serine anti-proteinases, α1-antitrypsin (serpin A1) and α 1-antichymotrypsin (serpin A3n), which play a prominent role in proteolytic cascades, including the mammalian coagulation pathways [84], were up-regulated in response to MPL. In addition, signal transducer and activator of transcription-3 (STAT3), an important upstream transcription factor that is regulated by CS and co-interacts with GR [85] to regulate several downstream inflammatory responses was also enhanced following MPL. In fact, STAT3 signaling is reported to play a role in downstream serpin activation [86], which might explain the observed increases in serpin A1 and A3n protein expression. The temporal protein expression profiles of STAT3, serpin A3n, and serpin A1 (Figures 9A–C) are shown. STAT3 is up-regulated (~3.3-fold) by 8 hours and shows a wide response window before returning to baseline after 48 hours. While both serpins peaked at ~12 hours, serpin A1 protein expression was enhanced to a lesser extent compared to serpin A3n (2.5-fold vs. 5-fold). Our observation of the MPL-induced increase in STAT3 protein expression is consistent with previous work showing up-regulation of STAT3 mRNA by MPL in liver [87].
Figure 9.

Temporal response profile of representative immune-related proteins involved in the acute phase response. Closed circles represent the mean and the error bars one standard deviation.
Other MPL-regulated proteins
Of the 451 differentially regulated proteins, 73 proteins that did not meet functional criteria for classification into any one of the six clusters were grouped separately as ‘other MPL-regulated proteins’. These proteins are listed along with their description in Table 7. Several proteins involved in cytoskeletal structure and membrane anchorage such as Titin, Talin-1, Vimetin, Tubulin, and Coronin-1B were diversely altered by MPL. Interestingly, kynurenine 3-monooxygenase (KMO), which metabolizes kynurenine (tryptophan metabolite) into kynurenic acid and quinolinic acid was modestly up-regulated by MPL (~ 2-fold; profile not shown). Increased production of kynurenine and quinolinic acid metabolites in brain by KMO has been suggested to play a role in the pathogenesis of multiple neurological disorders via modulation of N-methyl-D-aspartate receptor (NMDAR) activity and glutamatergic signaling [88]. While the role of inflammatory cytokines in mediating KMO-induced neurotoxicity has been reported [89], GC-regulation of KMO in brain and its potential role in CS-induced neurotoxicity [90] have not been previously documented.
DISCUSSION
This report describes the mining of a rich proteomic time-series dataset obtained from the analysis of liver tissues obtained from a population of 60 adrenalectomized rats given a single 50 mg/kg intramuscular bolus of MPL and killed at select times over the course of 66 hours after dosing. An in-depth functional analysis was performed to better elucidate the complex nature of CS effects in liver in vivo. Analysis of global changes in transcriptomic expression has been an integral part in studying mechanisms of actions of various pharmacological agents, and have been extensively performed in our laboratory to understand the tissue-specific effects of CS [12, 13, 27, 87, 91]. Although highly useful in understanding the mechanisms of pharmacogenomic regulation by CS, genomic approaches fall short in that changes in mRNA expression may not directly correlate with, and hence be reflective of drug effects occurring in the tissue ‘proteome’ [16, 92]. Proteomics can be viewed as being complementary to genomics as it focuses on the gene products which mediate cellular responses [93]. While measurement of dynamic proteomic changes is highly desirable, several challenges exist in accurately quantifying large-scale proteomic changes in vivo. We reported the development of a sensitive and robust label-free quantification strategy for large-scale quantitative proteomics [11]. The complexities in mRNA-protein correlation were highlighted in our previous report where tandem changes in MPL-induced mRNA and protein expression in liver were analyzed. The concordance between mRNA and protein dynamics were observed only for a small number of genes [14]. Since proteins better reflect drug-induced physiological changes, mining of functional information at the proteomic-level coupled with characterizing temporal responses of important proteins can provide mechanistic insight into the physiological and pharmacological effects of CS.
Significance analysis for differentially-regulated proteins was performed using the EDGE software, which analyzes time course differential expression using spline-based methods for longitudinal fitting of data [21, 94]. There were 478 out of 959 proteins that showed significantly varying temporal profiles (p value < 0.05; q-value < 0.01). Following further manual filtering for redundancies in the dataset, a final group of 451 proteins became the subject of intensive analysis of MPL-induced regulation, cellular localization, and biological function.
Upon exploratory data analysis of time-courses of protein expression following MPL, it was evident that great diversity exists in the shapes of protein response profiles over time. In general, this observation is consistent with mRNA response profiles observed at the transcriptomic level in liver as well as in other tissues [13, 14, 95]. Proteins were annotated on the basis of temporal regulation by simply visually inspecting all 451 profiles for “up” and “down”-regulation based on deviation from baseline. In many cases, temporal response profiles met both criteria, indicating complex biphasic regulation. Around 75% of all proteins showed up-regulation in response to MPL, while approximately 20% displayed biphasic behavior. A small number of proteins (~5%) were purely down-regulated by MPL dosing. However, it is possible that some other down-regulated proteins were not detected due to their low abundance following suppression by MPL. The widely accepted mechanism for CS-mediated enhancement of target gene expression involves binding of free steroid to its cytosolic receptor, translocation of drug-receptor complex into the nucleus, homo-dimerization followed by binding to GREs located in the 5′-promoter region of target genes, and consequent alteration of the rates of transcription of select genes. Alternatively, CS may also post-transcriptionally regulate the rate of mRNA expression by altering mRNA stability [96]. However, it is possible that these understandings of pharmacogenomic regulation by CS are too simplistic [27], especially in cases where complex patterns in mRNA and/or protein expression emerge over time. Indeed, mechanistic studies have revealed the involvement of transcription factors which serve as secondary biosignals or coactivators of GR signaling such as STAT3 [85] (Figure 9A) or CCAAT/enhancer-binding protein [97, 98]. It can be hypothesized that such secondary signals might synergize with or antagonize GR-mediated transcriptional or post-transcriptional effects, which in turn produce complex patterns of mRNA and protein expression. Based on work by Ramamoorthy and Cidlowski [99], CS-induced repression of the target genes may occur via GR-NCoR1-histone deacetylase 3 interactions with negative GREs.
It is known that CS mediate their pharmacologic effects by inducing molecular and cellular changes via genomic (receptor/gene-mediated) and non-genomic mechanisms [100, 101]. However, there is at present no integrated knowledge regarding the subcellular localization of genes or proteins that are affected by CS. We found that significant portions were localized to the cytosol (24%), mitochondria (20%), and endoplasmic reticulum (13%). The indication that a large number of mitochondrial proteins were altered by MPL is consistent with current knowledge regarding MPL-effects on metabolic pathways such as gluconeogenesis, fatty acid oxidation, and the Krebs cycle, which primarily occur within the mitochondria [5, 65]. Among the small number of proteins that were localized to the peroxisome (~5%), a few proteins were involved in fatty acid oxidation in that organelle as well (e.g. peroxisomal 3-ketoacyl-CoA thiolase B), which is reasonable since both mitochondria and the peroxisome are known sites for lipid metabolism [102]. A number of drug metabolizing CYP450 enzymes were altered in response to MPL (Table 4A). There were 19 out of the 20 CYP enzymes regulated by MPL found to be microsomal; i.e. localized to endoplasmic reticulum in vivo. A significant number (57 proteins) were localized to the nucleus, of which a number of proteins were involved in the regulation of replication, gene transcription, and also interacting with GR. There were a few instances where an active protein was localized to more than one organelle. For example, programmed cell death-8 (PCD8), an apoptotic factor, is released from the mitochondrion intermembrane space into the cytosol and to the nucleus in response to cellular stress, where it functions as a proapoptotic factor [103]. In such instances, proteins were counted to be present in more than one organelle. Collectively, these results illustrate that CS mediate effects that are widespread at the scale of subcellular location.
We utilized a function-based approach to understand how CS-induced perturbations at the proteome-level related to adverse and/or therapeutic pharmacologic effects of CS therapy in the liver. The liver is a vital organ involved in regulating essential physiological processes in the body, with hepatocytes as the major cell type occupying close to 80% of the total liver volume [104]. The liver functions to detoxify and eliminate potentially toxic products such as endogenous metabolic waste-products or foreign compounds (e.g. drugs). It is also involved in the synthesis of plasma proteins (e.g. albumin), clotting factors (e.g. fibrinogen), and certain globulins which transport substances such as cholesterol, vitamin D, and iron [105, 106]. In addition, the liver produces acute-phase proteins in response to microbes or hepatic stressors, which are associated with inflammation, tissue repair, and immune cell activities [107]. Another crucial function of the liver is the regulation of systemic energy metabolism, which is under complex control by hormones such as insulin, glucagon, and importantly, GC [56].
A summary of the functional cluster analysis of proteins differentially regulated by MPL is shown in Figure 10. A number of proteins altered by CS belonged to biological processes that are critical to hepatic and whole-body function. The two largest functional clusters belonged to the processes of hepatic stress and signaling (24%) and energy regulation (22%) (Figure 10; left). With respect to cell signaling, a number of proteins such as annexin A6, regucalcin, profilin-1, calnexin, and calreticulin, which are involved in upstream- and/or downstream-regulation of intracellular calcium (Ca2+) were diversely regulated upon MPL dosing. While this may or may not be a direct consequence of MPL effects on the proteins, alterations in the highly-sensitive Ca2+-pathway are quite likely involved in mediating further downstream effects, suggestive of complex higher-order regulation of biological processes following MPL. In addition, a number of glutathione S-transferase isozymes, which are involved in the detoxification of electrophilic xenobiotics (e.g. chemical carcinogens, antitumor agents) as well as endogenous unsaturated aldehydes, quinones, epoxides, and hydroperoxides formed during oxidative stress, were up-regulated (refer to Table 1). This effect is suggestive of a protective mechanism against the oxidative stress-inducing effects of CS in tissues [43–45]. Approximately 100 proteins related to various aspects of energy metabolism (amino acid metabolism, carbohydrate metabolism, lipid/fatty acid metabolism, and the Krebs cycle) were identified as differentially regulated by MPL (Figure 10; bottom right). Our observations of MPL-induced up-regulation in amino acid degrading enzymes such as TAT are consistent with previous findings at the mRNA level [13, 108]. Furthermore, the time-course of TAT protein expression strongly complemented that of TAT activity measured using a colorimetric assay [108] in livers obtained from the same animals (Supplementary Figure S2 in the SI). We found that expression of glutamine synthetase, an amino-acid metabolizing gene extensively studied in skeletal muscle [109, 110], was slightly up-regulated in liver as well. Interestingly, glutamine synthetase is reported to be expressed in a rim of hepatocytes surrounding hepatic veins [111], which provides a plausible explanation for its regulation by CS in liver. The temporal profile of PEPCK protein expression showed good correlation with previously reported PEPCK mRNA and activity profiles [112]. Furthermore, the profile of PEPCK, which is the rate-limiting enzyme of gluconeogenesis, showed good correspondence to systemic plasma glucose concentrations measured from the same rats, demonstrating the mechanisms through which CS induce their hyperglycemic effects in vivo. Peroxisomal 3-ketoacyl-CoA thiolase B, which catalyzes the final step in the peroxisomal β-oxidation of straight-chain acyl-CoA, was down-regulated by MPL. Interestingly, lack of peroxisomal 3-ketoacyl-CoA thiolase B is associated with decreased β-oxidation under conditions of metabolic stress in mice [113]. Together, these findings suggest that peroxisomal 3-ketoacyl-CoA thiolase B may play an important role in CS-induced dysregulation of hepatic fatty acid metabolism.
Figure 10.

Summary of functional clustering results for MPL-altered proteins involved in diverse biological processes. The pie-chart on the left summarizes the percentage of proteins involved in each of the functional categories. The chart on the top-right summarizes the percentage of proteins in the sub-clusters related to hepatic endogenous substrate, xenobiotic, and/or drug metabolism. The chart on the bottom-right summarizes the percentage of proteins in the sub-clusters related to hepatic energy regulation.
Another important group of proteins altered by MPL are those involved in the metabolism of endogenous substrates, xenobiotics, or therapeutic drugs. Of the metabolizing enzymes regulated by MPL, 32% were CYP enzymes, 23% Phase-II conjugating enzymes, and the remaining other enzymes (including non-CYP Phase-I enzymes). While it is evident from Figure 8 that MPL regulates the protein expression of important CYP enzymes (e.g. CYP3A2) and Phase-II enzymes (e.g. UGT1A1 and SULT1A1), these findings do not imply that MPL has a direct impact on the metabolism and pharmacokinetics of drug substrates for these enzymes. Instead, these findings serve to generate mechanistic hypotheses for further evaluating potential drug-interactions with MPL. Collectively, these results provide global insight into the effect of CS at the proteomic level and its relationship to physiological processes occurring in liver.
An important element that is often overlooked while investigating drug action is the time-dependent nature of pharmacological responses. Assessment of effects at a single point in time does not fully characterize the actions of the drug. This approach can be even more misleading for characterizing of the magnitude of expression change, since the magnitude of effect will be dependent on the particular time-point examined, as exemplified in this study. Through use of our “giant-rat” study paradigm, pharmacodynamic changes in the liver proteome was assessed across 66 hours after dosing. Although drug concentrations were dissipated by 8 hours, temporal responses of several proteins showed that many biological cascades remained active well after the drug was cleared from the system. Furthermore, the temporal proteomic data enabled us to more rigorously functionally characterize MPL-induced changes in liver; especially in cases where changes in protein expression began to occur several hours after dosing. Male ADX rats were used in our animal experiments in order to prevent the confounding effects of endogenous corticosterone on tissue gene expression, and hence create stable pharmacodynamic baselines. However, in reality, expression of several GC-regulated mRNA and proteins occur in a circadian fashion in peripheral tissues [114], due to rhythmic corticosterone production by the adrenal cortex.
Our approach for functionally annotating and classifying significantly altered proteins is similar to one applied in our microarray studies [27, 87, 115]; literature-based functional information for each protein was mined and annotated. Each protein was then assigned to a functional cluster devised based on the physiologically and pharmacologically relevant effects of CS. Direct use of DAVID and other currently available gene ontology and pathway analysis tools were avoided for final functional clustering for several reasons. First, although highly comprehensive in terms of genomic and proteomic coverage [116], the functional information on the proteins contained in the databases for these tools are not complete. Second, as noted by us and others [115, 116], these tools do not take into account tissue-specific or context-specific physiological functions of proteins. Finally, gene ontology analyses based on “biological process” and “molecular function” yielded overly broad or specific functional clusters. For instance, functional clustering based on gene ontology tools would cluster MPL-responsive CYP enzymes which are involved in drug metabolism into either “iron-binding” (biological process) or as an “oxidoreductase” (molecular function). While both these classifications are in technical terms not incorrect, they do not serve in identifying any further implications for CS action. For instance, information regarding drug substrates of the CYP enzyme could provide insight into potential drug interactions with MPL. However, this is not to imply that our approach is devoid of limitations. Our stringent criteria for selecting differentially-regulated protein may have led to the exclusion of potentially useful information on some down-regulated proteins, which are consistently detected in controls but detected at fewer times in the treated animals. However, the stringent selection criteria set in this study was tailored towards i) ensuring that protein fold-changes were reported with high confidence across each time-point, and ii) meeting the goals of subsequent data analyses. Therefore, proteins which are undetectable in the treatment group at one or two time-points could still warrant consideration for further analyses, depending on the downstream application of the results. An inherent difficulty in manually clustering based on functionality is that a protein could (and often does) mediate multiple biological effects, and hence can be clustered into more than one functional group. In instances where a protein functionally met criteria for classification into more than one cluster, the protein was allocated to the cluster with greater relevance to MPL-induced effects in liver. Although this system may bear some caveats, these groupings together with the proteomic expression profiles provide insight into the global impact of CS on liver physiology.
For over a decade, our laboratories have utilized genomic microarray data in conjunction with mechanism-based pharmacokinetic/pharmacodynamic (PK/PD) modeling [117] to better understand the receptor/gene-mediated effects of steroids in multiple organ systems [7, 118, 119]. In order to identify common mechanisms underlying MPL-induced mRNA expression of genes, unifying mathematical models were developed to describe temporally-clustered groups of genes. While this approach is extremely useful in understanding mechanisms of CS-induced gene regulation at the level of mRNA, a functional clustering approach is required at the protein level as it provides insight into designing systems PK/PD models based on the biological function of proteins as opposed to temporal patterns alone. An initial question that was addressed during the analysis was whether proteins clustered on the basis of function would show similar trends in their temporal responses. However, to the contrary, it was interesting to note that the time-course of proteins are highly varied within functional groups–reflecting diversity in response times of proteins mediating similar functions. Future work involves developing mechanistic PK/PD models that quantitatively integrate and describe the large-scale changes observed in our transcriptomic and proteomic datasets to gain a more holistic understanding of CS pharmacodynamics. To our knowledge, this is the first effort that merges pharmacodynamics with large-scale functional pharmacoproteomics to gain an understanding of drug-induced changes in vivo. The time profiles of proteins mediating important biological functions provided new insights into the diverse temporal changes and their implications associated with gene transcription and protein translation, cell stress and signaling, energy regulation (amino acid metabolism, gluconeogenesis, fatty acid oxidation), hepatic drug metabolism, and inflammatory responses.
Supplementary Material
Experimental procedure for the animal experiments and large-scale, ion-current-based quantitative proteomic profiling.
Comparison of the time-courses of tyrosine aminotransferase (TAT) protein expression and TAT activity measured in livers obtained from the same animals.
Highlights.
An approach for function-based clustering of pharmacoproteomic data is described.
Cytosolic and mitochondrial proteins are highly altered by corticosteroid in liver.
Relationship of altered hepatic proteomics to systemic steroid effects is described.
Functionally similar steroid-regulated proteins display diverse temporal patterns.
SIGNIFICANCE.
Clinical use of corticosteroid (CS) therapy is frequent and chronic. However, current knowledge on the proteome-level effects of CS in liver and other tissues is sparse. While transcriptomic regulation following methylprednisolone (MPL) dosing has been temporally examined in rat liver, proteomic assessments are needed to better characterize the tissue-specific functional aspects of MPL actions. This study describes a functional pharmacoproteomic analysis of dynamic changes in MPL-regulated proteins in liver and provides biological insight into how steroid-induced perturbations on a molecular level may relate to both adverse and therapeutic responses presented clinically.
Acknowledgments
Grants
This work was supported by the National Institutes of Health [GM24211].
Footnotes
Disclosures
No conflicts of interest, financial or otherwise, are declared by the authors.
Publisher's Disclaimer: This is a PDF file of an unedited manuscript that has been accepted for publication. As a service to our customers we are providing this early version of the manuscript. The manuscript will undergo copyediting, typesetting, and review of the resulting proof before it is published in its final citable form. Please note that during the production process errors may be discovered which could affect the content, and all legal disclaimers that apply to the journal pertain.
References
- 1.Oh S, Song S, Dasgupta N, Grabowski G. The analytical landscape of static and temporal dynamics in transcriptome data. Frontiers in Genetics. 2014;5:35. doi: 10.3389/fgene.2014.00035. [DOI] [PMC free article] [PubMed] [Google Scholar]
- 2.Kirwan JR. The effect of glucocorticoids on joint destruction in rheumatoid arthritis. New England Journal of Medicine. 1995;333:142–147. doi: 10.1056/NEJM199507203330302. [DOI] [PubMed] [Google Scholar]
- 3.Barnes PJ. Efficacy of inhaled corticosteroids in asthma. Journal of Allergy and Clinical Immunology. 1998;102:531–538. doi: 10.1016/s0091-6749(98)70268-4. [DOI] [PubMed] [Google Scholar]
- 4.Kofman S, Perlia CP, Boesen E, Eisenstein R, Taylor SG. The role of corticosteroids in the treatment of malignant lymphomas. Cancer. 1962;15:338–345. doi: 10.1002/1097-0142(196203/04)15:2<338::aid-cncr2820150217>3.0.co;2-u. [DOI] [PubMed] [Google Scholar]
- 5.Vegiopoulos A, Herzig S. Glucocorticoids,metabolism and metabolic diseases. Molecular and Cellular Endocrinology. 2007;275:43–61. doi: 10.1016/j.mce.2007.05.015. [DOI] [PubMed] [Google Scholar]
- 6.Schacke H, Docke WD, Asadullah K. Mechanisms involved in the side effects of glucocorticoids. Pharmacol Ther. 2002;96:23–43. doi: 10.1016/s0163-7258(02)00297-8. [DOI] [PubMed] [Google Scholar]
- 7.Jin JY, Almon RR, DuBois DC, Jusko WJ. Modeling of corticosteroid pharmacogenomics in rat liver using gene microarrays. J Pharmacol Exp Ther. 2003;307:93–109. doi: 10.1124/jpet.103.053256. [DOI] [PubMed] [Google Scholar]
- 8.Quax RA, Manenschijn L, Koper JW, Hazes JM, Lamberts SWJ, van Rossum EFC, Feelders RA. Glucocorticoid sensitivity in health and disease. Nat Rev Endocrinol. 2013;9:670–686. doi: 10.1038/nrendo.2013.183. [DOI] [PubMed] [Google Scholar]
- 9.Tanner AR, Powell LW. Corticosteroids in liver disease: possible mechanisms of action, pharmacology, and rational use. Gut. 1979;20:1109–1124. doi: 10.1136/gut.20.12.1109. [DOI] [PMC free article] [PubMed] [Google Scholar]
- 10.Hazra A, Pyszczynski NA, DuBois DC, Almon RR, Jusko WJ. Modeling of corticosteroid effects on hepatic low-density lipoprotein receptors and plasma lipid dynamics in rats. Pharm Res. 2008;25:769–80. doi: 10.1007/s11095-007-9371-8. [DOI] [PMC free article] [PubMed] [Google Scholar]
- 11.Nouri-Nigjeh E, Sukumaran S, Tu C, Li J, Shen X, Duan X, DuBois DC, Almon RR, Jusko WJ, Qu J. Highly multiplexed and reproducible ion-current-based strategy for large-scale quantitative proteomics and the application to protein expression dynamics induced by methylprednisolone in 60 rats. Anal Chem. 2014;86:8149–57. doi: 10.1021/ac501380s. [DOI] [PMC free article] [PubMed] [Google Scholar]
- 12.Almon RR, Chen J, Snyder G, DuBois DC, Jusko WJ, Hoffman EP. In vivo multi-tissue corticosteroid microarray time series available online at Public Expression Profile Resource (PEPR) Pharmacogenomics. 2003;4:791–9. doi: 10.1517/phgs.4.6.791.22816. [DOI] [PubMed] [Google Scholar]
- 13.Almon RR, Dubois DC, Jin JY, Jusko WJ. Pharmacogenomic responses of rat liver to methylprednisolone: an approach to mining a rich microarray time series. AAPS J. 2005;7:E156–94. doi: 10.1208/aapsj070117. [DOI] [PMC free article] [PubMed] [Google Scholar]
- 14.Kamisoglu K, Sukumaran S, Nouri-Nigjeh E, Tu C, Li J, Shen X, Duan X, Qu J, Almon RR, DuBois DC, Jusko WJ, Androulakis IP. Tandem analysis of transcriptome and proteome changes after a single dose of corticosteroid: a systems approach to liver function in pharmacogenomics. OMICS. 2015;19:80–91. doi: 10.1089/omi.2014.0130. [DOI] [PMC free article] [PubMed] [Google Scholar]
- 15.Pandey A, Mann M. Proteomics to study genes and genomes. Nature. 2000;405:837–846. doi: 10.1038/35015709. [DOI] [PubMed] [Google Scholar]
- 16.Maier T, Güell M, Serrano L. Correlation of mRNA and protein in complex biological samples. FEBS Letters. 2009;583:3966–3973. doi: 10.1016/j.febslet.2009.10.036. [DOI] [PubMed] [Google Scholar]
- 17.Tu C, Li J, Sheng Q, Zhang M, Qu J. Systematic Assessment of Survey Scan and MS2-Based Abundance Strategies for Label-Free Quantitative Proteomics Using High-Resolution MS Data. Journal of Proteome Research. 2014;13:2069–2079. doi: 10.1021/pr401206m. [DOI] [PMC free article] [PubMed] [Google Scholar]
- 18.Fisk JC, Li J, Wang H, Aletta JM, Qu J, Read LK. Proteomic analysis reveals diverse classes of arginine methylproteins in mitochondria of trypanosomes. Mol Cell Proteomics. 2013;12:302–11. doi: 10.1074/mcp.M112.022533. [DOI] [PMC free article] [PubMed] [Google Scholar]
- 19.Haughey DB, Jusko WJ. Analysis of methylprednisolone, methylprednisone and corticosterone for assessment of methylprednisolone disposition in the rat. J Chromatogr. 1988;430:241–8. doi: 10.1016/s0378-4347(00)83159-x. [DOI] [PubMed] [Google Scholar]
- 20.Hazra A, Pyszczynski N, DuBois DC, Almon RR, Jusko WJ. Pharmacokinetics of methylprednisolone after intravenous and intramuscular administration in rats. Biopharm Drug Dispos. 2007;28:263–73. doi: 10.1002/bdd.551. [DOI] [PMC free article] [PubMed] [Google Scholar]
- 21.Leek JT, Monsen E, Dabney AR, Storey JD. EDGE: extraction and analysis of differential gene expression. Bioinformatics. 2006;22:507–508. doi: 10.1093/bioinformatics/btk005. [DOI] [PubMed] [Google Scholar]
- 22.UniProt-Consortium. The Universal Protein Resource (UniProt) Nucleic Acids Res. 2007;35:D193–7. doi: 10.1093/nar/gkl929. [DOI] [PMC free article] [PubMed] [Google Scholar]
- 23.Boutet E, Lieberherr D, Tognolli M, Schneider M, Bansal P, Bridge AJ, Poux S, Bougueleret L, Xenarios I. UniProtKB/Swiss-Prot, the manually annotated section of the UniProt KnowledgeBase: How to use the entry view. Methods Mol Biol. 2016;1374:23–54. doi: 10.1007/978-1-4939-3167-5_2. [DOI] [PubMed] [Google Scholar]
- 24.Ashburner M, Ball CA, Blake JA, Botstein D, Butler H, Cherry JM, Davis AP, Dolinski K, Dwight SS, Eppig JT, Harris MA, Hill DP, Issel-Tarver L, Kasarskis A, Lewis S, Matese JC, Richardson JE, Ringwald M, Rubin GM, Sherlock G. Gene ontology: tool for the unification of biology. The Gene Ontology Consortium. Nat Genet. 2000;25:25–9. doi: 10.1038/75556. [DOI] [PMC free article] [PubMed] [Google Scholar]
- 25.Huang da W, Sherman BT, Lempicki RA. Systematic and integrative analysis of large gene lists using DAVID bioinformatics resources. Nat Protoc. 2009;4:44–57. doi: 10.1038/nprot.2008.211. [DOI] [PubMed] [Google Scholar]
- 26.Huntley RP, Sawford T, Mutowo-Meullenet P, Shypitsyna A, Bonilla C, Martin MJ, O’Donovan C. The GOA database: gene Ontology annotation updates for 2015. Nucleic Acids Res. 2015;43:D1057–63. doi: 10.1093/nar/gku1113. [DOI] [PMC free article] [PubMed] [Google Scholar]
- 27.Almon RR, DuBois DC, Yao Z, Hoffman EP, Ghimbovschi S, Jusko WJ. Microarray analysis of the temporal response of skeletal muscle to methylprednisolone: comparative analysis of two dosing regimens. Physiol Genomics. 2007;30:282–99. doi: 10.1152/physiolgenomics.00242.2006. [DOI] [PMC free article] [PubMed] [Google Scholar]
- 28.Ayyar VS, Almon RR, Jusko WJ, DuBois DC. Quantitative tissue-specific dynamics of in vivo GILZ mRNA expression and regulation by endogenous and exogenous glucocorticoids. Physiol Rep. 2015;3 doi: 10.14814/phy2.12382. [DOI] [PMC free article] [PubMed] [Google Scholar]
- 29.Kelly EJ, Sandgren EP, Brinster RL, Palmiter RD. A pair of adjacent glucocorticoid response elements regulate expression of two mouse metallothionein genes. Proc Natl Acad Sci U S A. 1997;94:10045–10050. doi: 10.1073/pnas.94.19.10045. [DOI] [PMC free article] [PubMed] [Google Scholar]
- 30.Comings DE, Muhleman D, Dietz G, Sherman M, Forest GL. Sequence of human tryptophan 2,3-dioxygenase (TDO2): presence of a glucocorticoid response-like element composed of a GTT repeat and an intronic CCCCT repeat. Genomics. 1995;29:390–6. doi: 10.1006/geno.1995.9990. [DOI] [PubMed] [Google Scholar]
- 31.Nakamura T, Niimi S, Nawa K, Noda C, Ichihara A, Takagi Y, Anai M, Sakaki Y. Multihormonal regulation of transcription of the tryptophan 2,3-dioxygenase gene in primary cultures of adult rat hepatocytes with special reference to the presence of a transcriptional protein mediating the action of glucocorticoids. J Biol Chem. 1987;262:727–33. [PubMed] [Google Scholar]
- 32.Cooper G. Mitochondria. Sinauer Associates; Sunderland (MA): 2000. [Google Scholar]
- 33.Hernández-Alvarez MI, Paz JC, Sebastián D, Muñoz JP, Liesa M, Segalés J, Palacín M, Zorzano A. Glucocorticoid modulation of mitochondrial function in hepatoma cells requires the mitochondrial fission protein Drp1. Antioxidants & Redox Signaling. 2013;19:366–378. doi: 10.1089/ars.2011.4269. [DOI] [PMC free article] [PubMed] [Google Scholar]
- 34.Dumas J-F, Simard G, Roussel D, Douay O, Foussard F, Malthiery Y, Ritz P. Mitochondrial energy metabolism in a model of undernutrition induced by dexamethasone. The British Journal of Nutrition. 2003;90:969–977. doi: 10.1079/bjn2003980. [DOI] [PMC free article] [PubMed] [Google Scholar]
- 35.Meffert G, Gellerich FN, Margreiter R, Wyss M. Elevated creatine kinase activity in primary hepatocellular carcinoma. BMC Gastroenterology. 2005;5:9–9. doi: 10.1186/1471-230X-5-9. [DOI] [PMC free article] [PubMed] [Google Scholar]
- 36.Masson S, Quistorff B. Kinetics of creatine uptake in the perfused mouse liver: a 31P-n.m.r. study of transgenic mice expressing creatine kinase (CKBB) in the liver. Biochemical Journal. 1994;303:531–538. doi: 10.1042/bj3030531. [DOI] [PMC free article] [PubMed] [Google Scholar]
- 37.Koretsky AP, Brosnan MJ, Chen LH, Chen JD, Van Dyke T. NMR detection of creatine kinase expressed in liver of transgenic mice: determination of free ADP levels. Proc Natl Acad Sci U S A. 1990;87:3112–6. doi: 10.1073/pnas.87.8.3112. [DOI] [PMC free article] [PubMed] [Google Scholar]
- 38.Kloosterboer HJ, van Faassen H, Stoker-De Vries SA, Hommes FA. Effect of hormones on the development of creatine kinase activity in rat skeletal muscle. Biol Neonate. 1979;35:156–74. doi: 10.1159/000241168. [DOI] [PubMed] [Google Scholar]
- 39.Ricketts ML, Shoesmith KJ, Hewison M, Strain A, Eggo MC, Stewart PM. Regulation of 11 beta-hydroxysteroid dehydrogenase type 1 in primary cultures of rat and human hepatocytes. J Endocrinol. 1998;156:159–68. doi: 10.1677/joe.0.1560159. [DOI] [PubMed] [Google Scholar]
- 40.Diederich S, Eigendorff E, Burkhardt P, Quinkler M, Bumke-Vogt C, Rochel M, Seidelmann D, Esperling P, Oelkers W, Bahr V. 11beta-hydroxysteroid dehydrogenase types 1 and 2: an important pharmacokinetic determinant for the activity of synthetic mineralo- and glucocorticoids. J Clin Endocrinol Metab. 2002;87:5695–701. doi: 10.1210/jc.2002-020970. [DOI] [PubMed] [Google Scholar]
- 41.Murphy PJ. Regulation of glucocorticoid receptor steroid binding and trafficking by the hsp90/hsp70-based chaperone machinery: implications for clinical intervention. Leukemia. 2005;19:710–2. doi: 10.1038/sj.leu.2403687. [DOI] [PubMed] [Google Scholar]
- 42.Cheung J, Smith DF. Molecular chaperone interactions with steroid receptors: an update. Molecular Endocrinology. 2000;14:939–946. doi: 10.1210/mend.14.7.0489. [DOI] [PubMed] [Google Scholar]
- 43.Spiers JG, Chen H-JC, Sernia C, Lavidis NA. Activation of the hypothalamic-pituitary-adrenal stress axis induces cellular oxidative stress. Frontiers in Neuroscience. 2014;8:456. doi: 10.3389/fnins.2014.00456. [DOI] [PMC free article] [PubMed] [Google Scholar]
- 44.Bjelakovic G, Beninati S, Pavlovic D, Kocic G, Jevtovic T, Kamenov B, Saranac LJ, Bjelakovic B, Stojanovic I, Basic J. Glucocorticoids and oxidative stress. J Basic Clin Physiol Pharmacol. 2007;18:115–27. doi: 10.1515/jbcpp.2007.18.2.115. [DOI] [PubMed] [Google Scholar]
- 45.You JM, Yun SJ, Nam KN, Kang C, Won R, Lee EH. Mechanism of glucocorticoid-induced oxidative stress in rat hippocampal slice cultures. Can J Physiol Pharmacol. 2009;87:440–7. doi: 10.1139/y09-027. [DOI] [PubMed] [Google Scholar]
- 46.Chan CL, Wong JW, Wong CP, Chan MK, Fong WP. Human antiquitin: structural and functional studies. Chem Biol Interact. 2011;191:165–70. doi: 10.1016/j.cbi.2010.12.019. [DOI] [PubMed] [Google Scholar]
- 47.Brocker C, Cantore M, Failli P, Vasiliou V. Aldehyde dehydrogenase 7A1 (ALDH7A1) attenuates reactive aldehyde and oxidative stress induced cytotoxicity. Chem Biol Interact. 2011;191:269–77. doi: 10.1016/j.cbi.2011.02.016. [DOI] [PMC free article] [PubMed] [Google Scholar]
- 48.Ruttkay-Nedecky B, Nejdl L, Gumulec J, Zitka O, Masarik M, Eckschlager T, Stiborova M, Adam V, Kizek R. The role of metallothionein in oxidative stress. Int J Mol Sci. 2013;14:6044–66. doi: 10.3390/ijms14036044. [DOI] [PMC free article] [PubMed] [Google Scholar]
- 49.Hager LJ, Palmiter RD. Transcriptional regulation of mouse liver metallothionein-I gene by glucocorticoids. Nature. 1981;291:340–2. doi: 10.1038/291340a0. [DOI] [PubMed] [Google Scholar]
- 50.Vroon DH, Israili Z. Aminotransferases. In: Walker HK, Hall WD, Hurst JW, editors. Clinical Methods: The History, Physical, and Laboratory Examinations. Buttterworths; Boston, MA: 1990. pp. 492–493. [PubMed] [Google Scholar]
- 51.Cousin MA, Lando D, Moguilewsky M. Ornithine decarboxylase induction by glucocorticoids in brain and liver of adrenalectomized rats. Journal of Neurochemistry. 1982;38:1296–1304. doi: 10.1111/j.1471-4159.1982.tb07904.x. [DOI] [PubMed] [Google Scholar]
- 52.Jantzen H-M, Strähle U, Gloss B, Stewart F, Schmid W, Boshart M, Miksicek R, Schütz G. Cooperativity of glucocorticoid response elements located far upstream of the tyrosine aminotransferase gene. Cell. 1987;49:29–38. doi: 10.1016/0092-8674(87)90752-5. [DOI] [PubMed] [Google Scholar]
- 53.Aggerbeck M, Garlatti M, Feilleux-Duche S, Veyssier C, Daheshia M, Hanoune J, Barouki R. Regulation of the cytosolic aspartate aminotransferase housekeeping gene promoter by glucocorticoids, cAMP, and insulin. Biochemistry. 1993;32:9065–9072. doi: 10.1021/bi00086a011. [DOI] [PubMed] [Google Scholar]
- 54.Haggerty DF, Chiappelli F, Kern R, Scully S, Lynch M. Regulation by glucocorticoids of rat-liver phenylalanine hydroxylase in vivo. Biochem Biophys Res Commun. 1983;115:965–70. doi: 10.1016/s0006-291x(83)80029-1. [DOI] [PubMed] [Google Scholar]
- 55.Nagao M, Nakamura T, Ichihara A. Developmental control of gene expression of tryptophan 2,3-dioxygenase in neonatal rat liver. Biochimica et Biophysica Acta (BBA) - Gene Structure and Expression. 1986;867:179–186. doi: 10.1016/0167-4781(86)90032-1. [DOI] [PubMed] [Google Scholar]
- 56.Rui L. Energy metabolism in the liver. Comprehensive Physiology. 2014;4:177–197. doi: 10.1002/cphy.c130024. [DOI] [PMC free article] [PubMed] [Google Scholar]
- 57.Jin JY, Jusko WJ. Pharmacodynamics of glucose regulation by methylprednisolone. II. Normal rats. Biopharmaceutics & Drug Disposition. 2009;30:35–48. doi: 10.1002/bdd.642. [DOI] [PMC free article] [PubMed] [Google Scholar]
- 58.Kuo T, McQueen A, Chen TC, Wang JC. Regulation of glucose homeostasis by glucocorticoids. Adv Exp Med Biol. 2015;872:99–126. doi: 10.1007/978-1-4939-2895-8_5. [DOI] [PMC free article] [PubMed] [Google Scholar]
- 59.Pilkis SJ, Granner DK. Molecular physiology of the regulation of hepatic gluconeogenesis and glycolysis. Annu Rev Physiol. 1992;54:885–909. doi: 10.1146/annurev.ph.54.030192.004321. [DOI] [PubMed] [Google Scholar]
- 60.Scott DK, Stromstedt PE, Wang JC, Granner DK. Further characterization of the glucocorticoid response unit in the phosphoenolpyruvate carboxykinase gene. The role of the glucocorticoid receptor-binding sites. Mol Endocrinol. 1998;12:482–91. doi: 10.1210/mend.12.4.0090. [DOI] [PubMed] [Google Scholar]
- 61.Sukumaran S, Jusko WJ, DuBois DC, Almon RR. Mechanistic modeling of the effects of glucocorticoids and circadian rhythms on adipokine expression. J Pharmacol Exp Ther. 2011;337:734–46. doi: 10.1124/jpet.111.179960. [DOI] [PMC free article] [PubMed] [Google Scholar]
- 62.Sukumaran S, Dubois DC, Jusko WJ, Almon RR. Glucocorticoid effects on adiponectin expression. Vitam Horm. 2012;90:163–86. doi: 10.1016/B978-0-12-398313-8.00007-5. [DOI] [PMC free article] [PubMed] [Google Scholar]
- 63.Letteron P, Brahimi-Bourouina N, Robin MA, Moreau A, Feldmann G, Pessayre D. Glucocorticoids inhibit mitochondrial matrix acyl-CoA dehydrogenases and fatty acid beta-oxidation. Am J Physiol. 1997;272:G1141–50. doi: 10.1152/ajpgi.1997.272.5.G1141. [DOI] [PubMed] [Google Scholar]
- 64.Houten SM, Wanders RJA. A general introduction to the biochemistry of mitochondrial fatty acid β-oxidation. Journal of Inherited Metabolic Disease. 2010;33:469–477. doi: 10.1007/s10545-010-9061-2. [DOI] [PMC free article] [PubMed] [Google Scholar]
- 65.Rustin P, Bourgeron T, Parfait B, Chretien D, Munnich A, Rötig A. Inborn errors of the Krebs cycle: a group of unusual mitochondrial diseases in human. Biochimica et Biophysica Acta (BBA) - Molecular Basis of Disease. 1997;1361:185–197. doi: 10.1016/s0925-4439(97)00035-5. [DOI] [PubMed] [Google Scholar]
- 66.Choi YD, Grabowski PJ, Sharp PA, Dreyfuss G. Heterogeneous nuclear ribonucleoproteins: role in RNA splicing. Science. 1986;231:1534–9. doi: 10.1126/science.3952495. [DOI] [PubMed] [Google Scholar]
- 67.Eggert H, Schulz M, Fackelmayer FO, Renkawitz R, Eggert M. Effects of the heterogeneous nuclear ribonucleoprotein U (hnRNP U/SAF-A) on glucocorticoid-dependent transcription in vivo. The Journal of Steroid Biochemistry and Molecular Biology. 2001;78:59–65. doi: 10.1016/s0960-0760(01)00074-7. [DOI] [PubMed] [Google Scholar]
- 68.He Y, Smith R. Nuclear functions of heterogeneous nuclear ribonucleoproteins A/B. Cell Mol Life Sci. 2009;66:1239–56. doi: 10.1007/s00018-008-8532-1. [DOI] [PMC free article] [PubMed] [Google Scholar]
- 69.Tajrishi MM, Tuteja R, Tuteja N. Nucleolin: The most abundant multifunctional phosphoprotein of nucleolus. Communicative & Integrative Biology. 2011;4:267–275. doi: 10.4161/cib.4.3.14884. [DOI] [PMC free article] [PubMed] [Google Scholar]
- 70.Schulz M, Schneider S, Lottspeich F, Renkawitz R, Eggert M. Identification of nucleolin as a glucocorticoid receptor interacting protein. Biochem Biophys Res Commun. 2001;280:476–80. doi: 10.1006/bbrc.2000.4141. [DOI] [PubMed] [Google Scholar]
- 71.Wojcikowski J, Haduch A, Daniel WA. Effect of classic and atypical neuroleptics on cytochrome P450 3A (CYP3A) in rat liver. Pharmacol Rep. 2012;64:1411–8. doi: 10.1016/s1734-1140(12)70938-6. [DOI] [PubMed] [Google Scholar]
- 72.Li L, Li Z, Deng C, Ning M, Li H, Bi S, Zhou T, Lu W. A mechanism-based pharmacokinetic/pharmacodynamic model for CYP3A1/2 induction by dexamethasone in rats. Acta Pharmacologica Sinica. 2012;33:127–136. doi: 10.1038/aps.2011.161. [DOI] [PMC free article] [PubMed] [Google Scholar]
- 73.Richard K, Hume R, Kaptein E, Stanley EL, Visser TJ, Coughtrie MW. Sulfation of thyroid hormone and dopamine during human development: ontogeny of phenol sulfotransferases and arylsulfatase in liver, lung, and brain. J Clin Endocrinol Metab. 2001;86:2734–42. doi: 10.1210/jcem.86.6.7569. [DOI] [PubMed] [Google Scholar]
- 74.Vietri M, Pietrabissa A, Mosca F, Spisni R, Pacifici GM. Curcumin is a potent inhibitor of phenol sulfotransferase (SULT1A1) in human liver and extrahepatic tissues. Xenobiotica. 2003;33:357–63. doi: 10.1080/0049825031000065197. [DOI] [PubMed] [Google Scholar]
- 75.Bosma PJ, Seppen J, Goldhoorn B, Bakker C, Oude Elferink RP, Chowdhury JR, Chowdhury NR, Jansen PL. Bilirubin UDP-glucuronosyltransferase 1 is the only relevant bilirubin glucuronidating isoform in man. J Biol Chem. 1994;269:17960–4. [PubMed] [Google Scholar]
- 76.Williams JA, Ring BJ, Cantrell VE, Campanale K, Jones DR, Hall SD, Wrighton SA. Differential modulation of UDP-glucuronosyltransferase 1A1 (UGT1A1)-catalyzed estradiol-3-glucuronidation by the addition of UGT1A1 substrates and other compounds to human liver microsomes. Drug Metab Dispos. 2002;30:1266–73. doi: 10.1124/dmd.30.11.1266. [DOI] [PubMed] [Google Scholar]
- 77.Tukey RH, Strassburg CP. Human UDP-glucuronosyltransferases: metabolism, expression, and disease. Annu Rev Pharmacol Toxicol. 2000;40:581–616. doi: 10.1146/annurev.pharmtox.40.1.581. [DOI] [PubMed] [Google Scholar]
- 78.Ando Y, Saka H, Asai G, Sugiura S, Shimokata K, Kamataki T. UGT1A1 genotypes and glucuronidation of SN-38, the active metabolite of irinotecan. Ann Oncol. 1998;9:845–7. doi: 10.1023/a:1008438109725. [DOI] [PubMed] [Google Scholar]
- 79.Satoh T, Hosokawa M. The mammalian carboxylesterases: from molecules to functions. Annu Rev Pharmacol Toxicol. 1998;38:257–88. doi: 10.1146/annurev.pharmtox.38.1.257. [DOI] [PubMed] [Google Scholar]
- 80.Gomes AM, Winter S, Klein K, Turpeinen M, Schaeffeler E, Schwab M, Zanger UM. Pharmacogenomics of human liver cytochrome P450 oxidoreductase: multifactorial analysis and impact on microsomal drug oxidation. Pharmacogenomics. 2009;10:579–599. doi: 10.2217/pgs.09.7. [DOI] [PubMed] [Google Scholar]
- 81.Trauner M, Boyer JL. Bile salt transporters: Molecular characterization, function, and regulation. Physiological Reviews. 2003;83:633–671. doi: 10.1152/physrev.00027.2002. [DOI] [PubMed] [Google Scholar]
- 82.Warskulat U, Kubitz R, Wettstein M, Stieger B, Meier PJ, Haussinger D. Regulation of bile salt export pump mRNA levels by dexamethasone and osmolarity in cultured rat hepatocytes. Biol Chem. 1999;380:1273–9. doi: 10.1515/BC.1999.162. [DOI] [PubMed] [Google Scholar]
- 83.Kushner I, Rzewnicki DL. The acute phase response: general aspects. Baillieres Clin Rheumatol. 1994;8:513–30. doi: 10.1016/s0950-3579(05)80113-x. [DOI] [PubMed] [Google Scholar]
- 84.Law RHP, Zhang Q, McGowan S, Buckle AM, Silverman GA, Wong W, Rosado CJ, Langendorf CG, Pike RN, Bird PI, Whisstock JC. An overview of the serpin superfamily. Genome Biology. 2006;7:216–216. doi: 10.1186/gb-2006-7-5-216. [DOI] [PMC free article] [PubMed] [Google Scholar]
- 85.Zhang Z, Jones S, Hagood JS, Fuentes NL, Fuller GM. STAT3 Acts as a co-activator of glucocorticoid receptor signaling. Journal of Biological Chemistry. 1997;272:30607–30610. doi: 10.1074/jbc.272.49.30607. [DOI] [PubMed] [Google Scholar]
- 86.Ahmed ST, Darnell JE. Serpin B3/B4, activated by STAT3, promote survival of squamous carcinoma cells. Biochemical and Biophysical Research Communications. 2009;378:821–825. doi: 10.1016/j.bbrc.2008.11.147. [DOI] [PMC free article] [PubMed] [Google Scholar]
- 87.Almon RR, DuBois DC, Jusko WJ. A microarray analysis of the temporal response of liver to methylprednisolone: a comparative analysis of two dosing regimens. Endocrinology. 2007;148:2209–25. doi: 10.1210/en.2006-0790. [DOI] [PMC free article] [PubMed] [Google Scholar]
- 88.Parrott JM, O’Connor JC. Kynurenine 3-Monooxygenase: An influential mediator of neuropathology. Frontiers in Psychiatry. 2015;6:116. doi: 10.3389/fpsyt.2015.00116. [DOI] [PMC free article] [PubMed] [Google Scholar]
- 89.Heyes MP, Saito K, Crowley JS, Davis LE, Demitrack MA, Der M, Dilling LA, Elia J, Kruesi MJ, Lackner A, et al. Quinolinic acid and kynurenine pathway metabolism in inflammatory and non-inflammatory neurological disease. Brain. 1992;115(Pt 5):1249–73. doi: 10.1093/brain/115.5.1249. [DOI] [PubMed] [Google Scholar]
- 90.Uno H, Eisele S, Sakai A, Shelton S, Baker E, DeJesus O, Holden J. Neurotoxicity of glucocorticoids in the primate brain. Horm Behav. 1994;28:336–48. doi: 10.1006/hbeh.1994.1030. [DOI] [PubMed] [Google Scholar]
- 91.Almon RR, Lai W, DuBois DC, Jusko WJ. Corticosteroid-regulated genes in rat kidney: mining time series array data. Am J Physiol Endocrinol Metab. 2005;289:E870–82. doi: 10.1152/ajpendo.00196.2005. [DOI] [PMC free article] [PubMed] [Google Scholar]
- 92.Payne SH. The utility of protein and mRNA correlation. Trends in Biochemical Sciences. 2015;40:1–3. doi: 10.1016/j.tibs.2014.10.010. [DOI] [PMC free article] [PubMed] [Google Scholar]
- 93.Witzmann FA, Grant RA. Pharmacoproteomics in drug development. Pharmacogenomics J. 2003;3:69–76. doi: 10.1038/sj.tpj.6500164. [DOI] [PubMed] [Google Scholar]
- 94.Storey JD, Xiao W, Leek JT, Tompkins RG, Davis RW. Significance analysis of time course microarray experiments. Proceedings of the National Academy of Sciences of the United States of America. 2005;102:12837–12842. doi: 10.1073/pnas.0504609102. [DOI] [PMC free article] [PubMed] [Google Scholar]
- 95.Almon RR, DuBois DC, Piel WH, Jusko WJ. The genomic response of skeletal muscle to methylprednisolone using microarrays: tailoring data mining to the structure of the pharmacogenomic time series. Pharmacogenomics. 2004;5:525–52. doi: 10.1517/14622416.5.5.525. [DOI] [PMC free article] [PubMed] [Google Scholar]
- 96.Ing NH. Steroid hormones regulate gene expression posttranscriptionally by altering the stabilities of messenger RNAs. Biology of Reproduction. 2005;72:1290–1296. doi: 10.1095/biolreprod.105.040014. [DOI] [PubMed] [Google Scholar]
- 97.MacDougald OA, Cornelius P, Lin FT, Chen SS, Lane MD. Glucocorticoids reciprocally regulate expression of the CCAAT/enhancer-binding protein alpha and delta genes in 3T3-L1 adipocytes and white adipose tissue. J Biol Chem. 1994;269:19041–7. [PubMed] [Google Scholar]
- 98.Yang Z, Guo C, Zhu P, Li W, Myatt L, Sun K. Role of glucocorticoid receptor and CCAAT/enhancer-binding protein alpha in the feed-forward induction of 11beta-hydroxysteroid dehydrogenase type 1 expression by cortisol in human amnion fibroblasts. J Endocrinol. 2007;195:241–53. doi: 10.1677/JOE-07-0303. [DOI] [PubMed] [Google Scholar]
- 99.Ramamoorthy S, Cidlowski JA. Ligand-induced repression of the glucocorticoid receptor gene is mediated by an NCoR1 repression complex formed by long-range chromatin interactions with intragenic glucocorticoid response elements. Molecular and Cellular Biology. 2013;33:1711–1722. doi: 10.1128/MCB.01151-12. [DOI] [PMC free article] [PubMed] [Google Scholar]
- 100.Jusko WJ. Pharmacokinetics and receptor-mediated pharmacodynamics of corticosteroids. Toxicology. 1995;102:189–96. doi: 10.1016/0300-483x(95)03047-j. [DOI] [PubMed] [Google Scholar]
- 101.Groeneweg FL, Karst H, de Kloet ER, Joëls M. Rapid non-genomic effects of corticosteroids and their role in the central stress response. Journal of Endocrinology. 2011;209:153–167. doi: 10.1530/JOE-10-0472. [DOI] [PubMed] [Google Scholar]
- 102.Lodhi Irfan J, Semenkovich Clay F. Peroxisomes: A nexus for lipid metabolism and cellular signaling. Cell Metabolism. 2014;19:380–392. doi: 10.1016/j.cmet.2014.01.002. [DOI] [PMC free article] [PubMed] [Google Scholar]
- 103.Wang X. The expanding role of mitochondria in apoptosis. Genes Dev. 2001;15:2922–33. [PubMed] [Google Scholar]
- 104.Kmiec Z. Cooperation of liver cells in health and disease. Adv Anat Embryol Cell Biol. 2001;161:Iii–xiii. 1–151. doi: 10.1007/978-3-642-56553-3. [DOI] [PubMed] [Google Scholar]
- 105.Tennent GA, Brennan SO, Stangou AJ, O’Grady J, Hawkins PN, Pepys MB. Human plasma fibrinogen is synthesized in the liver. Blood. 2007;109:1971–1974. doi: 10.1182/blood-2006-08-040956. [DOI] [PubMed] [Google Scholar]
- 106.McIntosh AL, Atshaves BP, Storey SM, Landrock KK, Landrock D, Martin GG, Kier AB, Schroeder F. Loss of liver FA binding protein significantly alters hepatocyte plasma membrane microdomains. Journal of Lipid Research. 2012;53:467–480. doi: 10.1194/jlr.M019919. [DOI] [PMC free article] [PubMed] [Google Scholar]
- 107.Moshage H. Cytokines and the hepatic acute phase response. J Pathol. 1997;181:257–66. doi: 10.1002/(SICI)1096-9896(199703)181:3<257::AID-PATH756>3.0.CO;2-U. [DOI] [PubMed] [Google Scholar]
- 108.Hazra A, Pyszczynski N, DuBois DC, Almon RR, Jusko WJ. Modeling receptor/gene-mediated effects of corticosteroids on hepatic tyrosine aminotransferase dynamics in rats: dual regulation by endogenous and exogenous corticosteroids. J Pharmacokinet Pharmacodyn. 2007;34:643–67. doi: 10.1007/s10928-007-9063-3. [DOI] [PMC free article] [PubMed] [Google Scholar]
- 109.Sun YN, McKay LI, DuBois DC, Jusko WJ, Almon RR. Pharmacokinetic/Pharmacodynamic models for corticosteroid receptor down-regulation and glutamine synthetase induction in rat skeletal muscle by a Receptor/Gene-mediated mechanism. J Pharmacol Exp Ther. 1999;288:720–8. [PubMed] [Google Scholar]
- 110.Yao Z, DuBois DC, Almon RR, Jusko WJ. Modeling circadian rhythms of glucocorticoid receptor and glutamine synthetase expression in rat skeletal muscle. Pharm Res. 2006;23:670–9. doi: 10.1007/s11095-005-9608-3. [DOI] [PMC free article] [PubMed] [Google Scholar]
- 111.Fleming KE, Wanless IR. Glutamine synthetase expression in activated hepatocyte progenitor cells and loss of hepatocellular expression in congestion and cirrhosis. Liver Int. 2013;33:525–34. doi: 10.1111/liv.12099. [DOI] [PubMed] [Google Scholar]
- 112.Jin JY, DuBois DC, Almon RR, Jusko WJ. Receptor/gene-mediated pharmacodynamic effects of methylprednisolone on phosphoenolpyruvate carboxykinase regulation in rat liver. J Pharmacol Exp Ther. 2004;309:328–39. doi: 10.1124/jpet.103.061515. [DOI] [PubMed] [Google Scholar]
- 113.Fidaleo M, Arnauld S, Clémencet M-C, Chevillard G, Royer M-C, De Bruycker M, Wanders RJA, Athias A, Gresti J, Clouet P, Degrace P, Kersten S, Espeel M, Latruffe N, Nicolas-Francès V, Mandard S. A role for the peroxisomal 3-ketoacyl-CoA thiolase B enzyme in the control of PPARα-mediated upregulation of SREBP-2 target genes in the liver. Biochimie. 2011;93:876–891. doi: 10.1016/j.biochi.2011.02.001. [DOI] [PubMed] [Google Scholar]
- 114.Sukumaran S, Almon RR, DuBois DC, Jusko WJ. Circadian rhythms in gene expression: Relationship to physiology, disease, drug disposition and drug action. Adv Drug Deliv Rev. 2010;62:904–17. doi: 10.1016/j.addr.2010.05.009. [DOI] [PMC free article] [PubMed] [Google Scholar]
- 115.Sukumaran S, Jusko WJ, Dubois DC, Almon RR. Light-dark oscillations in the lung transcriptome: implications for lung homeostasis, repair, metabolism, disease, and drug action. J Appl Physiol (1985) 2011;110:1732–47. doi: 10.1152/japplphysiol.00079.2011. [DOI] [PMC free article] [PubMed] [Google Scholar]
- 116.Khalid S, Fraser K, Khan M, Wang P, Liu X, Li S. Analysing microarray data using the multi-functional immune ontologiser. Journal of Integrative Bioinformatics. 2006;3:25. [Google Scholar]
- 117.Jusko WJ. Moving from basic toward systems pharmacodynamic models. J Pharm Sci. 2013;102:2930–40. doi: 10.1002/jps.23590. [DOI] [PMC free article] [PubMed] [Google Scholar]
- 118.Yao Z, Hoffman EP, Ghimbovschi S, Dubois DC, Almon RR, Jusko WJ. Mathematical modeling of corticosteroid pharmacogenomics in rat muscle following acute and chronic methylprednisolone dosing. Mol Pharm. 2008;5:328–39. doi: 10.1021/mp700094s. [DOI] [PMC free article] [PubMed] [Google Scholar]
- 119.Hazra A, DuBois DC, Almon RR, Snyder GH, Jusko WJ. Pharmacodynamic modeling of acute and chronic effects of methylprednisolone on hepatic urea cycle genes in rats. Gene Regul Syst Bio. 2008;2:1–19. [PMC free article] [PubMed] [Google Scholar]
Associated Data
This section collects any data citations, data availability statements, or supplementary materials included in this article.
Supplementary Materials
Experimental procedure for the animal experiments and large-scale, ion-current-based quantitative proteomic profiling.
Comparison of the time-courses of tyrosine aminotransferase (TAT) protein expression and TAT activity measured in livers obtained from the same animals.