Abstract
Purpose
The purpose of this study was to determine if there is a quantitative relationship between chronic intracranial pressure (ICP) and peripapillary Bruch's membrane (pp-BM) shape and to determine whether change in pp-BM shape can be detected within 1 hour after ICP lowering by lumbar puncture (LP).
Methods
In this study, 30° nasal-temporal optical coherence tomography B-scans were obtained within 1 hour before and after LP in 39 eyes from 20 patients (age = 23–86 years, 75% female, ICP [opening pressure] = 10–55 cm H2O). A total of 16 semi-landmarks defined pp-BM on each image. Geometric morphometric analysis identified principal components of shape in the image set. Generalized estimating equation models, accounting for within-subject correlation, were used to identify principal components that were associated with chronic ICP (comparing pre-LP images between eyes) and/or acute ICP changes (comparing pre- and post-LP images within eyes). The pp-BM width and anterior pp-BM location were calculated directly from each image and were studied in the same manner.
Results
Principal component 1 scalar variable on pre-LP images was associated with ICP (P < 0.0005). Principal component 4 magnitude changed within eyes after LP (P = 0.003). For both principal components 1 and 4, lower ICP corresponded with a more posterior position of pp-BM. Chronic ICP was associated with both pp-BM width (6.81 μm/cm H2O; P = 0.002) and more anterior location of temporal and nasal pp-BM margins (3.41, 3.49 μm/cm H2O; P < 0.0005, 0.002).
Conclusions
This study demonstrates a quantitative association between pp-BM shape and chronic ICP level. Changes in pp-BM shape are detectable within 1 hour of lowering ICP. pp-BM shape may be a useful marker for chronic ICP level and acute ICP changes. Further study is needed to determine how pp-BM shape changes relate to clinical markers of papilledema.
Keywords: papilledema, intracranial pressure, Bruch's membrane, optic nerve, biomechanics
Papilledema, the swelling of the optic nerve head resulting from elevated cerebral spinal fluid (CSF) pressure around the orbital optic nerve, is an important clinical sign that suggests high intracranial pressure (ICP). However, its role as a clinical marker of ICP changes is suboptimal because development and resolution are delayed following acute changes in ICP.1 One possible reason for this delay is that papilledema results from biological changes at the cellular level, namely congestion of axoplasm inside the retinal ganglion cell axons where they coalesce to form the optic nerve head.2
The flattening of the posterior globe as a result of high fluid pressure in the optic nerve sheath is another anatomical change that occurs in high ICP states. Unlike papilledema, this cannot be viewed on the ophthalmoscopic exam, although it can be readily appreciated using cross-sectional imaging such as magnetic resonance imaging,3 where flattening is visualized as a change in the spherical contour of the globe or optical coherence tomography (OCT),4 where flattening is seen as a less convex or even concave shape of the peripapillary Bruch's membrane (pp-BM) relative to the vitreous cavity. Previous studies have shown that globe contour and BM shape are different in patients with high ICP versus patients with normal ICP,3,5 and in patients with high ICP who undergo medical or surgical treatment to lower ICP, there is a return of shape toward normal within 2 to 3 weeks.5 The mechanism of this shape change has not been elucidated, but it is postulated that it is the result of the mechanical effect of increased fluid pressure in the optic nerve sheath.6 If so, we might expect the shape to be quantitatively related to the CSF pressure magnitude and to respond quickly to changes in ICP.
Shape is defined as a characteristic of an object independent from translation, rotation, and scale. Geometric morphometric analysis is a methodology for comparison of shape that is widely applied in the biological and geologic sciences including prior studies of pp-BM shape.5–7 The methodology involves assigning semi-landmarks to a set of images and using the coordinates of these semi-landmarks to calculate a consensus shape to which the semi-landmarks characterizing each individual image can be referenced. Principal components (PCs) are also calculated from the coordinates of the semi-landmarks for the entire image set. PCs are independent components of shape arranged in order of decreasing variance. In other words, the first PC captures more variation in the data set than the second PC and so on. PCs have direction (i.e., vectors along which the semi-landmarks move) and magnitude (i.e., how far along the vectors they move in a positive or negative direction). PC magnitudes are scalar variables that can be compared between images in the data set as independent quantities. Because PCs are orthogonal and independent from each other, the scalar variable can be used as variables in regression models.8
Prior studies of pp-BM shape have not elucidated the relationship between ICP as a continuous quantitative variable and pp-BM shape, nor have they determined if pp-BM shape changes occur over the short term following ICP lowering. The purpose of this study is to investigate the hypothesis that the pp-BM shape is quantitatively related to ICP using ophthalmic images obtained in patients undergoing outpatient lumbar puncture (LP). We hypothesize that the pp-BM shape is quantitatively related to chronic ICP and evaluate this by testing for a linear relationship between pre-LP pp-BM shape parameters and ICP as measured during LP. We also hypothesize that pp-BM shape change can be detected within 1 hour of ICP lowering and evaluate this by testing for a nonzero difference between pre- and post-LP pp-BM shape parameters.
Methods
Adult patients scheduled to undergo outpatient LP for a clinical indication were recruited from the neurology and ophthalmology clinics at the University of Illinois at Chicago between November 2014 and March 2016. All patients undergoing LP were screened for study enrollment (i.e., they were not targeted based on suspected ICP) to obtain a sample with a range of chronic ICP values. This is consistent with study goals of determining the quantitative relationship between chronic ICP and pp-BM shape, and the relationship between acute ICP changes and pp-BM shape changes across ICP levels. The research adhered to the tenets of the Declaration of Helsinki. The study was approved by the University of Illinois at Chicago Institutional Review Board, and informed consent was obtained from all participants after explanations of the nature and possible consequences of the study.
Reason for LP, positioning for procedure, optic disc appearance, age, and sex were recorded from the medical record. For each participant, cross-sectional OCT images of both optic nerves along the nasal–temporal axis (Spectralis; Heidelberg Engineering, Inc., Heidelberg, Germany) were obtained within 1 hour prior to LP and within 1 hour after LP. The optic nerve radial scan protocol was used for this purpose. Opening pressure was measured immediately after gaining access to the spinal canal with the LP needle and before any cerebrospinal fluid was withdrawn. Opening pressure was recorded as the height of the column of spinal fluid above the spinal canal as measured using a manometer. Intraocular pressure and blood pressure were measured concurrent with pre-LP imaging. Near visual acuity with pinhole was assessed prior to obtaining the first OCT image. Intraocular pressure was measured a second time concurrent with post-LP imaging in the first 11 participants. LP closing pressure and volume of CSF collected were recorded from the medical record when available. Participants were classified according to ICP (normal < 20 cm H2O, borderline 20 ≤ ICP < 25 cm H2O, elevated ≥ 25 cm H2O) and optic disc appearance (presence and grade of papilledema).9
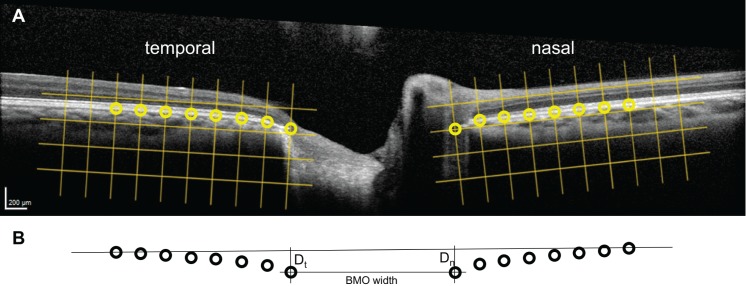
Geometric morphometric shape analysis was performed according to the method of Sibony et al.6 using nasal–temporal B-scans through the optic nerve head and the TPS software suite available as freeware (F.J. Rohlf, State University of New York Stony Brook, Stony Brook, NY, USA).10 This two-dimensional analysis is based on an assumption of radial symmetry of the optic nerve head. Modifications of the methodology of Sibony et al.6 included the use of four fewer semi-landmarks and reduced spacing between semi-landmarks to accommodate differences in the image window. Thus, the pp-BM span analyzed in this study was shorter than in prior studies. Left eye images were mirrored on the vertical axis so that they could be directly compared to right eye images. The nasal and temporal margins of the BM opening surrounding the optic nerve were manually identified on each image by a single investigator using contrast and brightness adjustments as necessary. The 220-μm square grids aligned with the nasal and temporal margins were superimposed on the images using Photoshop (Adobe, Inc., San Jose, CA, USA). The 16 semi-landmarks on BM (8 nasal to optic disc, 8 temporal to optic disc) spaced 220-μm apart were digitized on each image using TPSdig with the grid as a placement guide (Fig. 1A). Geometric morphometric shape analysis was performed using TPSrelw.10 The inputs were the coordinates of the 16 semi-landmarks for all images (pre- and post-LP for both eyes of each participant) arranged using TPSutil. Outputs included the 28 independent PCs that characterize the group of pp-BM shapes and the scalar variable for each PC for each image. TPSregr was used to compare the pp-BM shapes of the pre-LP images between the right eyes of all participants as a function of ICP. TPSregr was used to compare the change in pp-BM shapes within participants pre- versus post-LP for the right eyes of the entire set of participants, for the set of participants with definite pseudotumor cerebrii (i.e., ICP > 25 cm H2O and papilledema) and for the set-up participants without pseudotumor cerebrii. Both of these analysis used 10,000 permutations and assessed statistical significance using Goodall's F-test per the method used by Sibony et al.8,11
Figure 1.
Definition of BM semi-landmarks and directly calculated shape parameters using OCT B-scans of optic nerve heads. (A) The 8 semi-landmarks (circles) spaced at 220 μm (grids) along the BM on either side of the optic nerve head were digitized. Their coordinates served as the input for geometric morphometric shape analysis. (B) Geometric transformations applied to semi-landmarks identified on the OCT image were used to calculate the BM opening (BMO) width and the displacement of the temporal (Dt) and nasal (Dn) BM margins from a secant line drawn between the two most lateral semi-landmarks.
Models of the relationship between shape and chronic ICP were constructed for each of the PCs that accounted for greater than 2% of shape variation within the set using SPSS version 24 (IBM, Inc., Armonk, NY, USA). Generalized estimating equation (GEE) models were used for the analysis as these account for within-subject correlations and therefore accommodate both eyes for each participant in a single model. GEE models with scalar variable for a given PC as the outcome, eye as the within-subject variable, and ICP as the independent variable were fit using data for both eyes from all participants prior to LP. The model estimates for ICP regression coefficients were used to test the hypotheses of linear association between chronic ICP magnitude and scalar variable of each PC of pp-BM shape. Models were run with and without age as a covariate to assess for confounding.
Models of change in shape following ICP lowering were constructed for each of the PCs that accounted for greater than 2% of shape variations within the set. Intercept-only GEE models were fit using data for both eyes from all participants. Outcome variables were changes in scalar variables for a given PC; eye was the within-subject variable, and there were no independent variables. The model estimates for intercepts were used to test the hypotheses of a relationship between recent ICP lowering and change in scalar variable of each PC of shape. Models were run with and without age as a covariate to assess for confounding.
A secondary analysis was performed using directly calculated shape parameters. The first parameter was the perpendicular distance between each of the markers defining BM opening and a secant line drawn between the two markers furthest from the BM opening. The second was the horizontal distance between the two markers defining the BM opening (Fig. 1b). These parameters were selected based on shape features shown to be altered in prior studies5 and are of interest because they are more intuitive than geometric morphometric derived PCs and can be calculated directly from each image without mapping to concurrently or previously calculated geometric morphometric PCs based on an image set. GEE models of each of these parameters with eye as the within-subject variable and ICP as the independent variable were fit to the sample of pre-LP images. The estimated coefficients for ICP were used to test the hypotheses of relationships between each parameter and ICP. Intercept-only GEE models of the change of each parameters (pre- to post-LP) with eye as the within-subject variable were fit. The estimated intercepts were used to test the hypotheses of change in shape parameters following acute ICP lowering.
Results
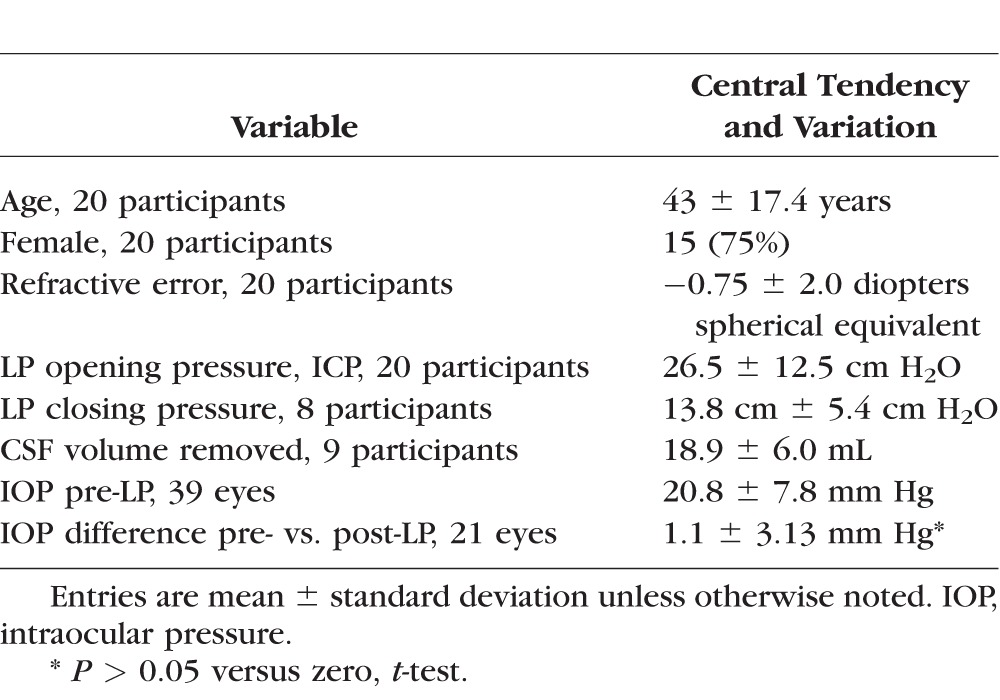
A total of 34 participants agreed to participate. LP was unsuccessful in seven participants, opening pressure was not measured in one participant, and imaging was incomplete in six participants. Thus 20 participants completed the study (Table). One eye of one participant was excluded for poor image quality, and therefore 39 eyes were included in the analysis. Refractive error ranged from −6.0 to + 3.0 diopters (spherical equivalent). The reasons for LP were dementia (4 participants), inflammation (3 participants), and headache with concern for elevated ICP (13 participants). In this latter group, nine had elevated ICP (≥ 25 cm H2O, mean 36, range 26–55) with papilledema, one had elevated ICP without papilledema, two had borderline ICP (20 ≤ ICP < 25 cm H2O) with papilledema, and one had normal ICP (< 20 cm H2O) without papilledema. All of the patients with LP performed for dementia or inflammation had normal opening pressure, and none had papilledema. Thus there were eight participants with normal ICP without papilledema (opening pressure [OP] range 10-20 cm H2O). A total of 19 LPs were performed in the lateral decubitus position, and 1 was performed in the prone position (OP = 23 cm H2O).
Table.
Description of 20 Participants Undergoing LP With OCT Imaging Completed Within 1 Hour Before and After Procedure
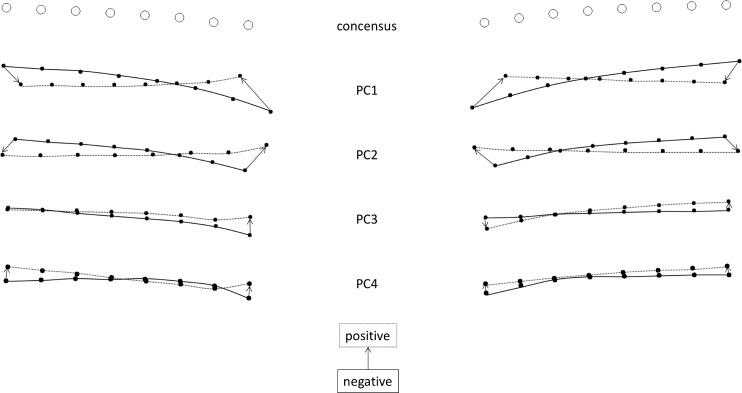
Geometric morphometric analysis of 16 semi-landmarks defining each of 78 images calculated 28 independent PCs with which all shapes could be defined according to their scalar variables. The deformations corresponding to the first four PCs of shape accounted for 70.1%, 20.9%, 3.8%, and 2.5% of the variation between images, respectively (Fig. 2). The remaining 2.2% of variation was accounted for by the remaining 24 PCs. Shape differences were detected as a function of ICP (P = 0.03, Goodall's F-test) in a between-subject comparison of right eye shape pre-LP. Shape differences were not detected pre- versus post-LP within participants (right eyes only) for the entire data set (P = 0.14, Goodall's F-test), or for the set of participants not meeting pseudotumor cerebrii criteria (n = 11, P = 0.97, Goodall's F-test), but were detected for the subset of participants with definite pseudotumor cerebrii (n = 9, P = 0.01, Goodall's F-test).
Figure 2.
Geometric morphometric analysis consensus shape and PC directions. Open circles are the consensus positions for the semi-landmarks for the 39 images studies. Closed circles are the extreme positions (i.e., the largest scalar parameter observed in the dataset) for the semi-landmarks for each PC with a negative scalar variable (solid line) or positive scalar variable (dashed line).
GEE models estimated a significant linear relationship between ICP and the scalar variable of the first PC (PC1) of shape in pre-LP images (0.94 × 10⁻³; 95% confidence interval [CI] [0.54 × 10⁻³, 1.35 × 10⁻³]; P < 0.0005; Fig. 3), but not the scalar variable of the second (0.05 × 10⁻³; 95% CI [−0.27 × 10⁻³, 0.37 × 10⁻³]; P = 0.76), third (−0.05 × 10⁻³; 95% CI [−0.29 × 10⁻³, 0.19 × 10⁻³]; P = 0.69), or fourth (−0.07 × 10⁻³; 95% CI [−0.25 × 10⁻³, 0.12 × 10⁻³]; P = 0.48) PCs of shape. The relationship between ICP and PC1 corresponds to a flatter pp-BM and wider opening as ICP magnitude increases (Fig. 3 inset). Models accounting for age showed similar results.
Figure 3.
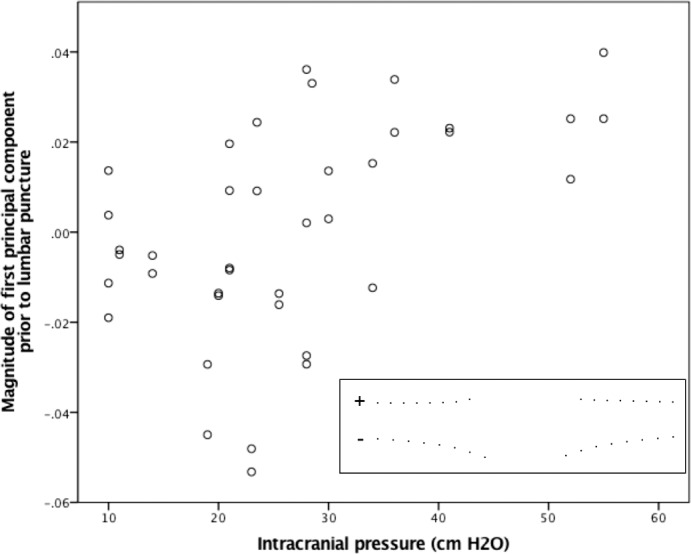
Relationship between chronic ICP level and magnitude of PC1 of pp-BM shape. ICP was measured by LP opening pressure performed less than 1 hour following OCT imaging. PCs were calculated using geomorphometic analysis of pp-BM shape as defined using 16 semi-landmarks on OCT B-scan of each optic nerve. Markers represent 39 eyes in 20 participants. Inset illustrates the first principal shape component, with positive magnitudes representing a flatter shape with a wider opening.
GEE models did not estimate a significant relationship between ICP lowering and change in the scalar variable (pre-LP − post-LP) of the first (intercept 0.72 × 10⁻³; 95% CI [−0.69 × 10⁻³, 2.12 × 10⁻³]; P = 0.32), second (−0.38 × 10⁻³; 95% CI [−1.73 × 10⁻³, 0.98 × 10⁻³], P = 0.58), or third PCs of shape (−0.47 × 10⁻³; 95% CI [−1.47 × 10⁻³, 0.53 × 10⁻³]; P = 0.36). Models estimated a significant nonzero relationship between ICP lowering and change in the scalar variable of the fourth PC (PC4) of shape (0.76 × 10⁻³ [0.26 × 10⁻³, 1.26 × 10⁻³]; P = 0.003; Fig. 4). The positive relationship between ICP change and PC4 change corresponds to posterior displacement of pp-BM following ICP lowering (Fig. 4 inset), which was observed for the whole group of participants and was more consistent in those with higher initial ICP (Fig. 4). Models accounting for age showed similar results.
Figure 4.
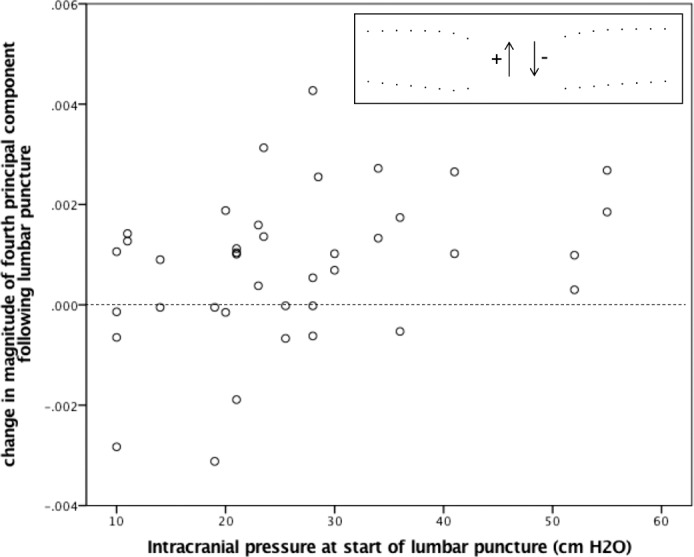
The relationship between chronic ICP level and change in magnitude of the fourth PC of pp-BM shape following ICP lowering via LP. ICP was measured as opening pressure at the start of LP. PCs were calculated using geomorphometic analysis of pp-BM shape as defined using 16 semi-landmarks on OCT B-scans of each optic nerve taken within 1 hour before and after LP. Markers represent 39 eyes in 20 participants. Dashed line highlights line of no change. Inset illustrates the fourth principal shape component, with positive magnitude change representing a posterior movement of BM opening.
Geometric transformations were applied to calculate BM opening width (mean ± SD: 1512 ± 194 μm) and the perpendicular displacement of BM opening semi-landmarks from the secant line drawn between the two lateral markers on each image (temporal displacement [Dt] 113 ± 93 μm; nasal displacement [Dn] 03 ± 89 μm). GEE model estimates demonstrate significant linear relationships between chronic ICP and pp-BM width (6.81 μm/cm H2O; 95% CI [2.54, 11.10]; P = 0.002; Fig. 5), temporal pp-BM displacement (3.41 μm/cm H2O; 95% CI [1.92, 4.91]; P < 0.0005), and nasal pp-BM displacement (3.49 μm/cm H2O; 95% CI [1.31, 5.66] P = 0.002; Fig. 6). More positive (less negative) displacement values indicate that BM margin is more anterior relative to the reference line. Models accounting for age showed similar results.
Figure 5.
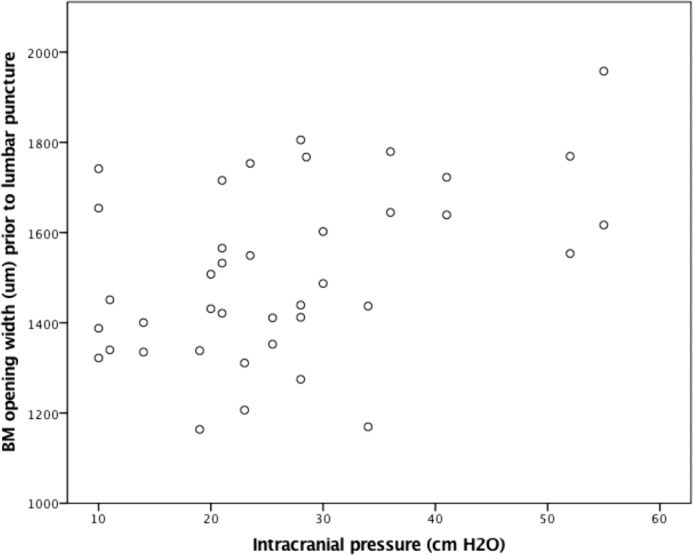
The relationship between chronic ICP and BM opening width. ICP was measured by LP opening pressure performed less than 1 hour following OCT imaging. The pp-BM width was calculated from the OCT B-scan of each optic nerve head. Markers represent 39 eyes in 20 participants.
Figure 6.
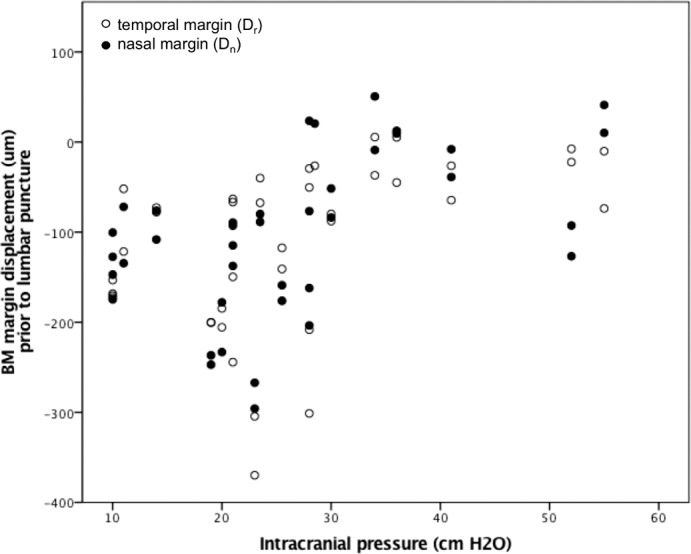
The relationship between chronic ICP and BM margin displacement into the globe. ICP was measured by LP opening pressure performed less than 1 hour following OCT imaging. BM margin displacement was calculated relative to a secant line connecting BM points 1540 μm on either side of the optic nerve head on OCT B-scan of each optic nerve head. Negative values represent location posterior to the reference line. Markers represent temporal (open) and nasal (closed) displacements in 39 eyes in 20 participants.
GEE models did not estimate a significant relationship between ICP lowering and change (pre-LP – post-LP) in the directly calculated image parameters of pp-BM width (intercept 7.48 μm; 95% CI [−8.70, 23.66] P = 0.37), pp-BM temporal displacement (−2.19 μm; 95% CI [−9.35, 4.98]; P = 0.55), or pp-BM nasal displacement (1.98 μm; 95% CI [−3.23, 7.19]; P = 0.46). Models accounting for age showed similar results.
Discussion
In this study of pp-BM shape, characterized using both PCs calculated by geometric morphometric analysis techniques as well as directly calculated parameters, we demonstrate a quantitative relationship between deflection of pp-BM toward the vitreous and chronic ICP magnitude as assessed by LP within 1 hour following ophthalmic imaging acquisition. We also demonstrate a deflection of pp-BM away from the vitreous within 1 hour following ICP lowering by extraction of CSF by LP, although this was captured for overall shape only among participants with high ICP and papilledema, and only in the PC4 of shape among all participants. Novel features of this study include measurement of ICP immediately after imaging, which allows study of a quantitative relationship, and repeat imaging immediately following LP, which allows measure of short-term consequences of ICP lowering. The results build on prior literature showing a relationship between pp-BM shape and categorical chronic ICP states6 (i.e., normal vs. high) as well as changes in pp-BM shape associated with ICP lowering over weeks.4,5 The nature of the first two PCs are qualitatively similar to those calculated in a comparison of nonarteritic optic neuropathy (presumed normal ICP) and pseudotumor cerebrii (confirmed high ICP), with PC1 capturing deflection of pp-BM into the vitreous cavity and widening of the opening and the PC2 capturing deflection of pp-BM into the vitreous cavity and narrowing of the opening.6 The qualitative nature of the PCs calculated in this study are different from those calculated in a study of participants with current or previous high ICP. In this other study, the PC1 captured pp-BM deflection and the PC2 captured change in opening width.5 This reinforces the dependence of PCs on the data set used to create the model.
Limitations of this study include known neurologic disease in participants with low and normal ICP. This resulted from the study design, which sampled from a population of participants who were scheduled to undergo LP for clinical indications to recruit a sample with a range of ICP levels. Given that the hypotheses being investigated were mechanical and no participant had abnormal CSF, it is unlikely that this meaningfully impacted the results. This study design reduced the sample available for high ICP subgroup analysis, in which this study may have been underpowered. We acknowledge that there have been advances in semi-automated landmark definition12 beyond our manual approach. This is unlikely to have meaningfully impacted results given that manual landmark identification has been shown to correlate well with semi-automated approaches.13 The use of a two-dimensional scan to represent shape of a three-dimensional object is based on an assumption of radial symmetry of the optic nerve head. This assumption is in line with assumptions made by other studies of pp-BM shape in papilledema as well as in mathematical models of optic nerve head biomechanics.5,14,15 However, three-dimensional characterizations of ppBM in nonhuman primates and a myopic human demonstrate the pp-BM opening to be ellipsoid rather than circular and to have vertical variations and suggest that this assumption may not be valid.16,17 Comparisons of two-dimensional and three-dimensional derived pp-BM shape factors in participants with papilledema show them to be highly correlated (Wang J-K, et al. IOVS 2016;57:ARVO E-Abstract 6113). Further work is needed to determine if and how these anatomic variations affect the ICP–ppBM shape relationship and the implications for local variations in anatomy. pp-BM as imaged by OCT serves as a surrogate for the flattening of the entire globe because of a pressure gradient involving ICP, and our analysis assumes that other factors affecting pp-BM shape such as changes in choroidal thickness altering the displacement of BM and sclera are negligible. This assumption is supported by the similarity of qualitative observations regarding ICP associations with globe shape based on pp-BM (OCT)6 and peripapillary-sclera (magnetic resonance imaging)3 and the likelihood that changes in choroidal thickness would diffusely alter the sclera-BM relationship to cause an offset rather than cause changes exclusively adjacent to the optic nerve as this and other globe-flattening studies have shown.
The observation of a quantitative relationship between chronic ICP and short-term ICP lowering and pp-BM shape support a model of pp-BM shape resulting from mechanical forces exerted on the posterior globe tissue by CSF pressure in the optic nerve sheath. The results of the subgroup shape analyses, which demonstrate shape change following ICP lowering in participants with pseudotumor cerebrii, but not in those without, suggest that the pp-BM shape response to ICP lowering is dependent on the initial state of the system (i.e., initial geometry and initial load). Individuals with chronic ICP-related globe flattening might be considered to be in a “loaded” state. They demonstrate a rapid response to unloading in the form of ICP lowering, similar to a compressed spring lengthening when compressive force is removed. Individuals without globe flattening might be considered to be in a neutral state. They do not demonstrate a rapid response to a new load in the form of ICP lowering, similar to a spring in neutral position not responding to applied tensile force. Explanations to account for this are differences in the mechanical stability of the system dependent on initial position and/or differences in pp-BM behavior depending on the type and direction of load. We must further refine our model beyond that of a simple spring model (i.e., displacement = force/spring constant) to account for certain observations. There is appearance of a ceiling effect for both PC1 and pp-BM deflection that suggests nonlinear elastic features (i.e., dimensional change becoming increasingly less for given increments of pressure as pressure increases). Such material properties are typical of biological materials. pp-BM shape immediately following ICP lowering did not match that for chronic low ICP states, nor was it as pronounced as observed over longer time periods by Sibony et al.5 Possible explanations might include viscoelastic effects, where the displacement change lags the force change, or tissue remodeling occurring under chronic loading conditions that alter the mechanical properties of the globe tissue. Both explanations could account for the chronic and acute changes being observed in different PCs of shape. The latter explanation would also account for the observation by Sibony et al.,5 that the pp-BM shape of individuals with high ICP returned toward, but did not reach that of control participants, even following prolonged normal ICP.5 Another explanation for the comparatively subtle shape changes seen immediately after ICP lowering may be that optic nerve sheath pressure does not immediately equilibrate with lumbar CSF pressure following lumbar CSF removal. Imaging of the posterior globe at successive time points following ICP lowering would be instructive with regard to these theories. However, the population sampled in this study (i.e., patients undergoing LP) would not be appropriate because of the increasing uncertainty regarding ICP with time after LP as a result of ongoing production of CSF. There would be higher confidence regarding constant ICP in participants undergoing surgical ICP lowering (e.g., by ventriculperitoneal shunt or another procedure).
Directly measured parameters were studied for the practical reason that they can be directly calculated from each image, in contrast to geometric morphometric PCs, which are a function of a given set of images. Quantitative relationships between chronic ICP and pp-BM shape were seen with these parameters, which support their development as clinical markers of chronic ICP levels. However, we did not detect changes immediately following ICP lowering using these parameters. This may be because of the comparatively crude nature of the directly calculated parameters derived from 4 semi-landmarks rather than the 16 used in geometric morphometric analysis. An approach that would leverage the high variance of top PCs would be to calculate PCs using a large data set and map outside images to the PCs for the purposes of shape evaluation.
This study focuses on ICP, which is one important variable with regard to pp-BM shape change, and the one that is of most clinical interest. There are undoubtedly other factors that affect the nature of the ICP–pp-BM shape relationship, including material properties and tissue geometry that govern the extent of the response to a given force input and optic canal geometry that influences equilibration between central ICP and optic nerve sheath pressure. Age, likely to be associated with scleral stiffness, did not impact the results in this study. Other potential covariates were not studied because of the insufficient data to characterize them. Longitudinal studies within individuals could serve to restrict the number of covariates relative to a between-individual study as we have performed. However, longitudinal studies of ICP are practically challenging because of the limited opportunities to measure quantitative ICP in the clinical setting. Computational models of pp-BM biomechanics are a potential tool that could guide identification of the most relevant material properties and geometric dimensions for characterizing individual responses to ICP.14
This study provides insight into the quantitative association between ICP and ophthalmic structure and supports a model of a mechanical etiology for pp-BM shape. The results support the development of BM opening shape parameters as quantitative markers of chronic ICP magnitude and demonstrate that shape changes occur rapidly following ICP lowering. Further study is needed to assess how other factors impact the ICP–pp-BM shape association to develop shape parameters as diagnostic markers for ICP states.
Acknowledgments
Supported by National Institutes of Health K23 EY 024345 (HEM), Illinois Society for the Prevention of Blindness (HEM, GV), Research to Prevent Blindness Sybil Harrington Special Scholar Award (HEM), Research to Prevent Blindness unrestricted grant, and National Institutes of Health P30 EY 01792 to the University of Illinois at Chicago Department of Ophthalmology and Visual Sciences, and Research to Prevent Blindness unrestricted grant to the Stanford Department of Ophthalmology and Visual Sciences.
Disclosure: A. Gampa, None; G. Vangipuram, None; Z. Shirazi, None; H.E. Moss, None
References
- 1. Hayreh MS,, Hayreh SS. Optic disc edema in raised intracranial pressure. I. Evolution and resolution. Arch Ophthalmol. 1977; 95: 1237–1244. [DOI] [PubMed] [Google Scholar]
- 2. Hayreh SS. Pathogenesis of optic disc edema in raised intracranial pressure. Prog Retin Eye Res. 2016; 50: 108–144. [DOI] [PMC free article] [PubMed] [Google Scholar]
- 3. Alperin N,, Bagci AM,, Lam BL,, Sklar E. Automated quantitation of the posterior scleral flattening and optic nerve protrusion by MRI in idiopathic intracranial hypertension. Am J Neuroradiol. 2013; 34: 2354–2359. [DOI] [PMC free article] [PubMed] [Google Scholar]
- 4. Kupersmith MJ,, Sibony P,, Mandel G,, Durbin M,, Kardon RH. Optical coherence tomography of the swollen optic nerve head: deformation of the peripapillary retinal pigment epithelium layer in papilledema. Invest Ophthalmol Vis Sci. 2011; 52: 6558–6564. [DOI] [PMC free article] [PubMed] [Google Scholar]
- 5. Sibony P,, Kupersmith MJ,, Honkanen R,, Rohlf FJ,, Torab-Parhiz A. Effects of lowering cerebrospinal fluid pressure on the shape of the peripapillary retina in intracranial hypertension. Invest Ophthalmol Vis Sci. 2014; 55: 8223–8231. [DOI] [PMC free article] [PubMed] [Google Scholar]
- 6. Sibony P,, Kupersmith MJ,, Rohlf FJ. Shape analysis of the peripapillary RPE layer in papilledema and ischemic optic neuropathy. Invest Ophthalmol Vis Sci. 2011; 52: 7987–7995. [DOI] [PMC free article] [PubMed] [Google Scholar]
- 7. Zelditch ML,, Swiderski DL,, Sheets HD. Geometric Morphometrics for Biologists: A Primer. 2nd ed. New York: Academic Press; 2012. [Google Scholar]
- 8. Jolliffe IT. A note on the use of principal components in regression. Appl Stat. 1982; 31: 300–303. [Google Scholar]
- 9. Friedman DI,, Liu GT,, Digre KB. Revised diagnostic criteria for the pseudotumor cerebri syndrome in adults and children. Neurology. 2013; 81: 1159–1165. [DOI] [PubMed] [Google Scholar]
- 10. Rohlf F. Morphometrics at SUNY Stony Brook. Available at: http://life.bio.sunysb.edu/morph/index.html Accessed January 31, 2017. [Google Scholar]
- 11. Rohlf FJ. Statistical power comparisons among alternative morphometric methods. Am J Phys Anthropol. 2000; 111: 463–478. [DOI] [PubMed] [Google Scholar]
- 12. Wang J-K,, Kardon RH,, Garvin MK. Combined use of high-definition and volumetric optical coherence tomography for the segmentation of neural canal opening in cases of optic nerve edema. SPIE Proceedings. 2015; 9413: 94133V. [Google Scholar]
- 13. Wang J-K,, Sibony PA,, Kardon RH,, Kupersmith MJ,, Garvin MK. Semi-automated 2D Bruch's membrane shape analysis in papilledema using spectral-domain optical coherence tomography. SPIE Proceedings. 2015; 9417: 941721. [Google Scholar]
- 14. Feola AJ,, Myers JG,, Raykin J,, et al. Finite element modeling of factors influencing optic nerve head deformation due to intracranial pressure. Invest Ophthalmol Vis Sci. 2016; 57: 1901–1911. [DOI] [PubMed] [Google Scholar]
- 15. Sigal IA,, Flanagan JG,, Tertinegg I,, Ethier CR. Finite element modeling of optic nerve head biomechanics. Invest Ophthalmol Vis Sci. 2004; 45: 4378–4387. [DOI] [PubMed] [Google Scholar]
- 16. Strouthidis NG,, Yang H,, Fortune B,, Downs JC,, Burgoyne CF. Detection of optic nerve head neural canal opening within histomorphometric and spectral domain optical coherence tomography data sets. Invest Ophthalmol Vis Sci. 2009; 50: 214–223. [DOI] [PMC free article] [PubMed] [Google Scholar]
- 17. Strouthidis NG,, Yang H,, Reynaud JF,, et al. Comparison of clinical and spectral domain optical coherence tomography optic disc margin anatomy. Invest Ophthalmol Vis Sci. 2009; 50: 4709–4718. [DOI] [PMC free article] [PubMed] [Google Scholar]


