Abstract
Background: This article summarizes the European Renal Association – European Dialysis and Transplant Association Registry’s 2014 annual report. It describes the epidemiology of renal replacement therapy (RRT) for end-stage renal disease (ESRD) in 2014 within 35 countries.
Methods: In 2016, the ERA-EDTA Registry received data on patients who in 2014 where undergoing RRT for ESRD, from 51 national or regional renal registries. Thirty-two registries provided individual patient level data and 19 provided aggregated patient level data. The incidence, prevalence and survival probabilities of these patients were determined.
Results: In 2014, 70 953 individuals commenced RRT for ESRD, equating to an overall unadjusted incidence rate of 133 per million population (pmp). The incidence ranged by 10-fold; from 23 pmp in the Ukraine to 237 pmp in Portugal. Of the patients commencing RRT, almost two-thirds were men, over half were aged ≥65 years and a quarter had diabetes mellitus as their primary renal diagnosis. By day 91 of commencing RRT, 81% of patients were receiving haemodialysis. On 31 December 2014, 490 743 individuals were receiving RRT for ESRD, equating to an unadjusted prevalence of 924 pmp. This ranged throughout Europe by more than 10-fold, from 157 pmp in the Ukraine to 1794 pmp in Portugal. In 2014, 19 406 kidney transplantations were performed, equating to an overall unadjusted transplant rate of 36 pmp. Again this varied considerably throughout Europe. For patients commencing RRT during 2005–09, the 5-year-adjusted patient survival probabilities on all RRT modalities was 63.3% (95% confidence interval 63.0–63.6). The expected remaining lifetime of a 20- to 24-year-old patient with ESRD receiving dialysis or living with a kidney transplant was 21.9 and 44.0 years, respectively. This was substantially lower than the 61.8 years of expected remaining lifetime of a 20-year-old patient without ESRD.
Keywords: dialysis, epidemiology, ESRD, kidney transplantation, survival analysis
Introduction
The European Renal Association – European Dialysis and Transplant Association (ERA-EDTA) Registry’s annual report describes the epidemiology of renal replacement therapy (RRT) for end-stage renal disease (ESRD) within Europe and adjacent countries based on data collected via the national and regional renal registries [1]. On an annual basis, we publish a summary of the ERA-EDTA Registry’s annual report that is intended to provide the reader with an overview of the current status of RRT for ESRD in Europe [2–4]. In 2016, we received the 2014 data from 51 national or regional renal registries in 35 countries covering a general population of 531.7 million people. This represented 65.4% of the 2014 European general population. Thirty-two national or regional renal registries from 17 countries provided individual patient data, whereas 19 countries or regions provided aggregated data (see Appendix 1). The proportion of the European population covered by the ERA-EDTA Registry in 2014 was lower than that of 2013 (73.6%) due to the absence of Russia and Slovenia from this year’s annual report.
This summary presents the 2014 incidence and prevalence of patients receiving RRT, kidney transplantation activity and the patient and graft survival in these 35 countries. The methods used to derive the results presented in this overview, along with the full results, can be found in the ERA-EDTA Registry 2014 Annual Report [1].
Incidence of RRT
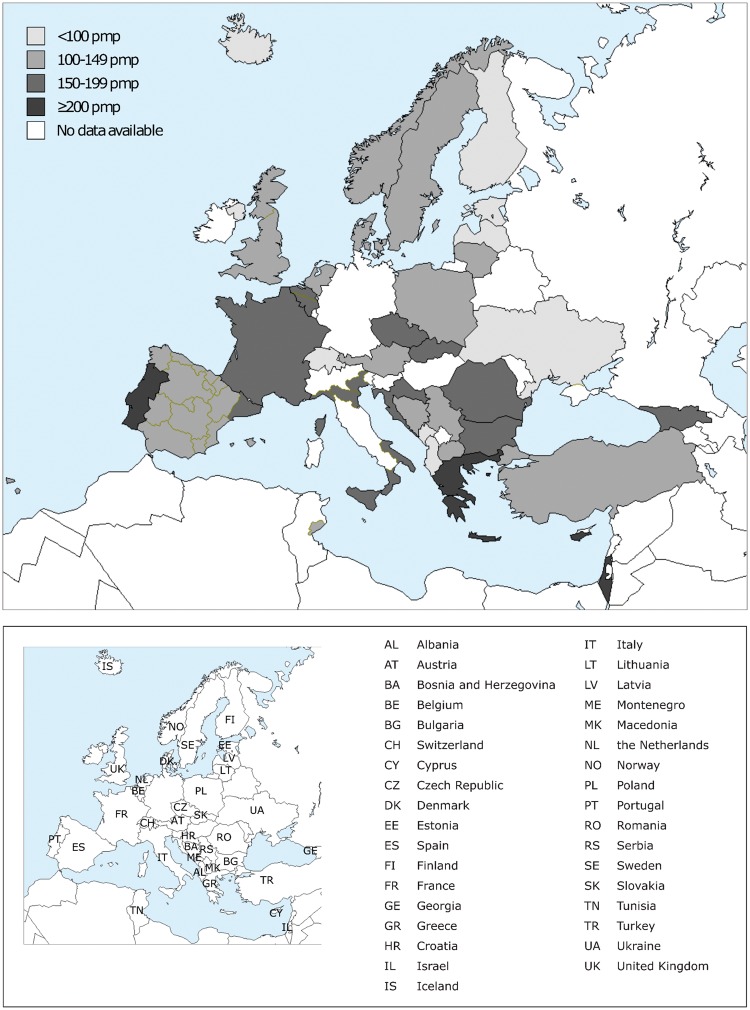
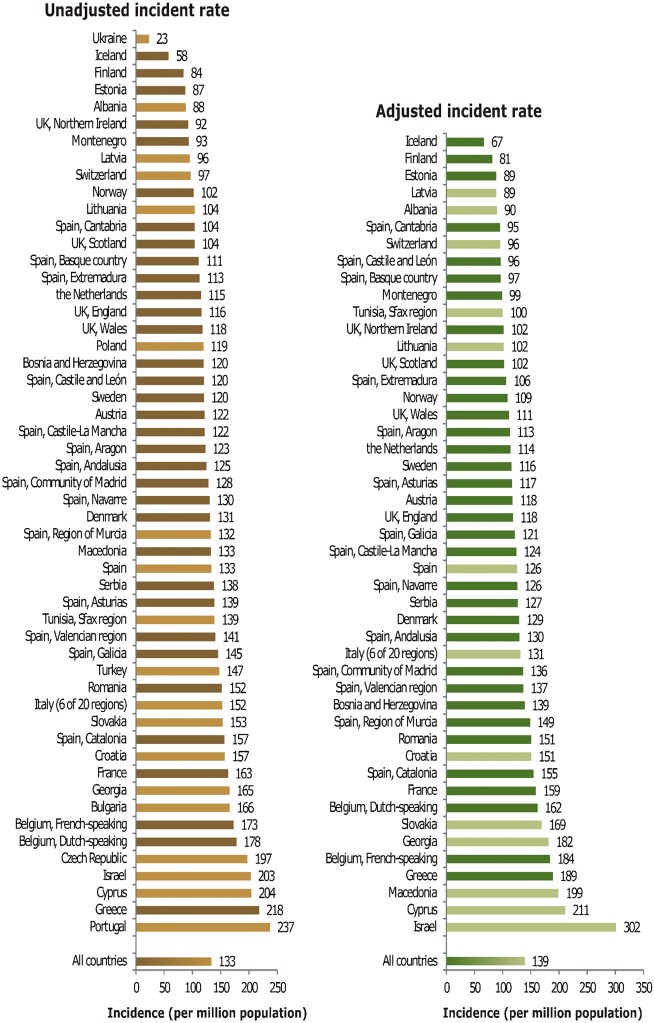
In 2014, 70 953 individuals commenced RRT for ESRD, which equated to an overall unadjusted incidence rate of 133 per million population (pmp, Table 1). The unadjusted incidence rate was highest in Portugal (237 pmp), Greece (218 pmp) and Cyprus (204 pmp), whereas it was lowest in the Ukraine (23 pmp) and Iceland (58 pmp, Table 1 and Figures 1 and 2). Of the patients commencing RRT, the majority were men (63%), over half were aged ≥65 years (55%) and a quarter had diabetes mellitus (26%) as their primary renal diagnosis (Figure 3). The mean age of the patients commencing RRT in all countries and regions combined was 64.6 years (Table 1). However, this ranged from a mean age of 55.1 years in Albania to 70.1 years in Dutch-speaking Belgium. Of the incident patients alive and receiving RRT at day 91 after the start of treatment, the majority were receiving haemodialysis (81%), 13% were receiving peritoneal dialysis and 6% were living with a kidney transplant (Figure 4). However, the modality of RRT at day 91 after the start of treatment varied considerably between age groups; as the age of the patient increased the proportion of patients receiving either peritoneal dialysis or living with a kidney transplant decreased. Furthermore, patients with a primary renal diagnosis of diabetes mellitus were half as likely to have a kidney transplant by day 91 compared with the non-diabetic group (3% versus 7%).
Table 1.
Incidence of RRT in 2014 at day 1, for all primary renal diseases combined and diabetes mellitus types 1 and 2, by count (N) and unadjusted rate per million population, and for all primary renal diseases combined, the mean age at the start of RRT, presented by country/region
| General population covered by the registry in thousands | Incidence in 2014 at day 1 |
|||||
|---|---|---|---|---|---|---|
| Total N | Total pmp | Mean age | DM N | DM pmp | ||
| Albania | 2863 | 252 | 88 | 55.1 | 30 | 11 |
| Austria | 8508 | 1036 | 122 | 64.2 | 259 | 30 |
| Belgium, Dutch-speakinga | 6444 | 1145 | 178 | 70.1 | 207 | 32 |
| Belgium, French-speakinga | 4788 | 828 | 173 | 67.5 | 188 | 39 |
| Bosnia and Herzegovina | 3508 | 421 | 120 | 60.7 | 125 | 36 |
| Bulgariab | 7217 | 1197 | 166 | 281 | 39 | |
| Croatia | 4070 | 640 | 157 | 63.7 | 186 | 46 |
| Cyprus | 847 | 173 | 204 | 64.6 | 58 | 69 |
| Czech Republicb | 10 222 | 2017 | 197 | |||
| Denmark | 5700 | 748 | 131 | 64.2 | 184 | 32 |
| Estonia | 1315 | 115 | 88 | 61.1 | 20 | 15 |
| Finland | 5462 | 461 | 84 | 59.3 | 165 | 30 |
| France | 66 262 | 10 791 | 163 | 67.6 | 2379 | 36 |
| Georgia | 4491 | 743 | 166 | 58.4 | 159 | 35 |
| Greece | 10 892 | 2372 | 218 | 69.7 | 575 | 53 |
| Iceland | 327 | 19 | 58 | 62.0 | 1 | 3 |
| Israel | 8216 | 1668 | 203 | 64.6 | 807 | 98 |
| Italy (6 of 20 regions) | 21 274 | 3243 | 152 | 68.6 | 558 | 26 |
| Latvia | 1590 | 152 | 96 | 63.3 | 23 | 15 |
| Lithuania | 2943 | 306 | 104 | 57.8 | 48 | 16 |
| Macedonia | 2022 | 268 | 133 | 63.2 | 62 | 31 |
| Montenegroa | 622 | 58 | 93 | 56.2 | 20 | 32 |
| Norway | 5137 | 523 | 102 | 62.4 | 90 | 18 |
| Poland | 36 338 | 4341 | 120 | |||
| Portugal | 10 427 | 2473 | 237 | 790 | 76 | |
| Romania | 19 710 | 2997 | 152 | 61.1 | 442 | 22 |
| Serbia | 7131 | 985 | 138 | 61.2 | 250 | 35 |
| Slovakia | 5421 | 831 | 153 | 63.8 | 316 | 58 |
| Spain | 46 771 | 6229 | 133 | 63.0 | 1520 | 33 |
| Spain, Andalusia | 8394 | 1046 | 125 | 62.6 | 270 | 32 |
| Spain, Aragon | 1329 | 163 | 123 | 64.1 | 40 | 30 |
| Spain, Asturias | 1059 | 147 | 139 | 64.5 | 33 | 31 |
| Spain, Basque country | 2166 | 241 | 111 | 65.5 | 39 | 18 |
| Spain, Cantabriaa | 587 | 61 | 104 | 61.4 | 12 | 21 |
| Spain, Castile and Leóna | 2487 | 299 | 120 | 67.6 | 79 | 32 |
| Spain, Castile-La Manchaa | 2069 | 252 | 122 | 63.7 | 62 | 30 |
| Spain, Catalonia | 7519 | 1178 | 157 | 66.0 | 259 | 34 |
| Spain, Extremadura | 1100 | 124 | 113 | 66.0 | 28 | 26 |
| Spain, Galicia | 2741 | 398 | 145 | 65.0 | 114 | 42 |
| Spain, Community of Madrid | 6454 | 828 | 128 | 64.3 | 201 | 31 |
| Spain, Region of Murcia | 1467 | 194 | 132 | 62.9 | 46 | 31 |
| Spain, Navarrea | 636 | 83 | 130 | 65.0 | 14 | 22 |
| Spain, Valencian region | 5005 | 704 | 141 | 65.9 | 156 | 31 |
| Sweden | 9696 | 1168 | 121 | 62.5 | 273 | 28 |
| Switzerlandc | 8230 | 800 | 97 | 64.5 | 157 | 19 |
| The Netherlands | 16 865 | 1941 | 115 | 63.6 | 358 | 21 |
| Tunisia, Sfax region | 1186 | 165 | 139 | 60.1 | 59 | 50 |
| Turkeyd | 77 696 | 11 447 | 147 | 1042 | 13 | |
| Ukraine | 42 903 | 998 | 23 | 196 | 5 | |
| UK, Englanda | 54 317 | 6311 | 116 | 62.3 | 1441 | 27 |
| UK, Northern Irelanda | 1840 | 170 | 92 | 64.6 | 39 | 21 |
| UK, Scotland | 5348 | 557 | 104 | 58.8 | 164 | 31 |
| UK, Walesa | 3092 | 364 | 118 | 65.5 | 94 | 30 |
| All countries | 531 690 | 70 953 | 133 | 64.6 | 13 566 | 32 |
When cells are left empty, the data are unavailable and, therefore, could not be used for the calculation of the summary data.
DM, diabetes mellitus as cause of renal failure.
Patients younger than 20 years of age are not reported. The true incidence counts are, therefore, slightly higher than the counts reported here.
Data on incidence include dialysis patients only.
Data on incidence of cause of renal failure (DM) include dialysis patients only.
Data on incidence of cause of renal failure (DM) are based on 2836 of 11 447 patients (24.8%).
Fig. 1.
Unadjusted incident rates per million population by country/region at day 1 in 2014. The incident rates for Bulgaria and the Czech Republic only include patients receiving dialysis.
Fig. 2.
Unadjusted (left panel) and adjusted (right panel) incident rates per million population by country/region at day 1 in 2014. Registries providing individual patient data are shown as dark bars and registries providing aggregated data as light bars. The incident rate for Bulgaria and the Czech Republic only includes patients receiving dialysis.
Fig. 3.
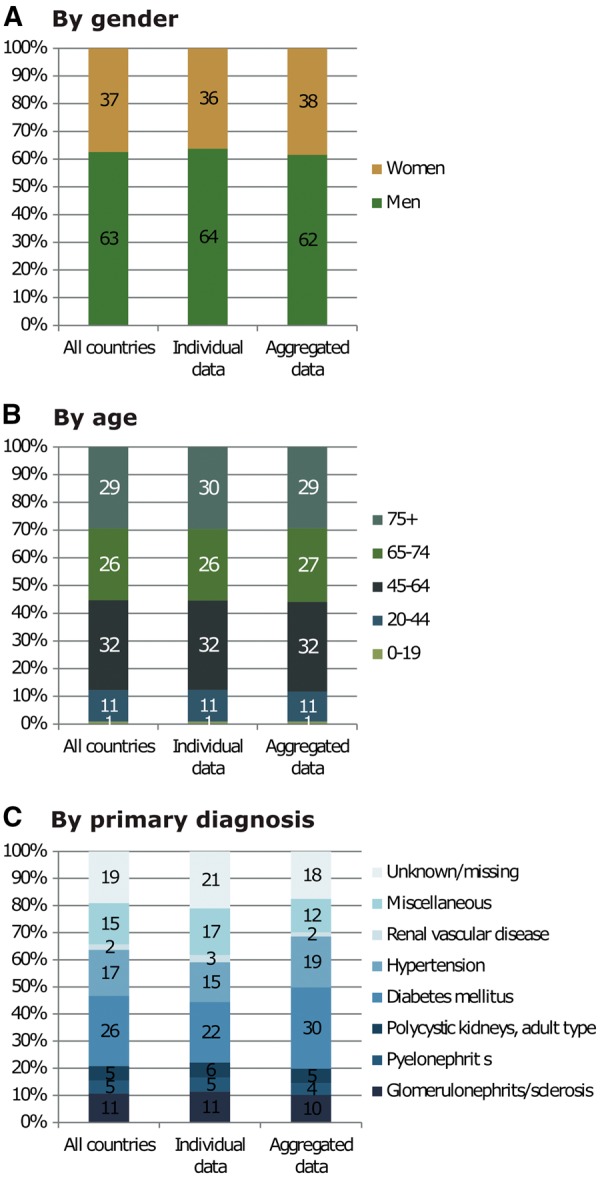
Unadjusted incident percentages by (A) gender, (B) age and (C) primary renal diagnosis at day 1 in 2014. See Appendix 1 for a list of countries and regions supplying individual patient level or aggregated level data.
Fig. 4.

Unadjusted incident percentages of (A) established therapy overall, and established therapy by (B) gender, (C) age and (D) primary renal diagnosis at day 91 in 2014. (B)–(D) are only based on data from registries providing individual patient data. See Appendix 1 for a list of countries and regions supplying individual patient level or aggregated level data. HD, haemodialysis; PD, peritoneal dialysis; Tx, transplant; DM, diabetes mellitus.
Prevalence of RRT
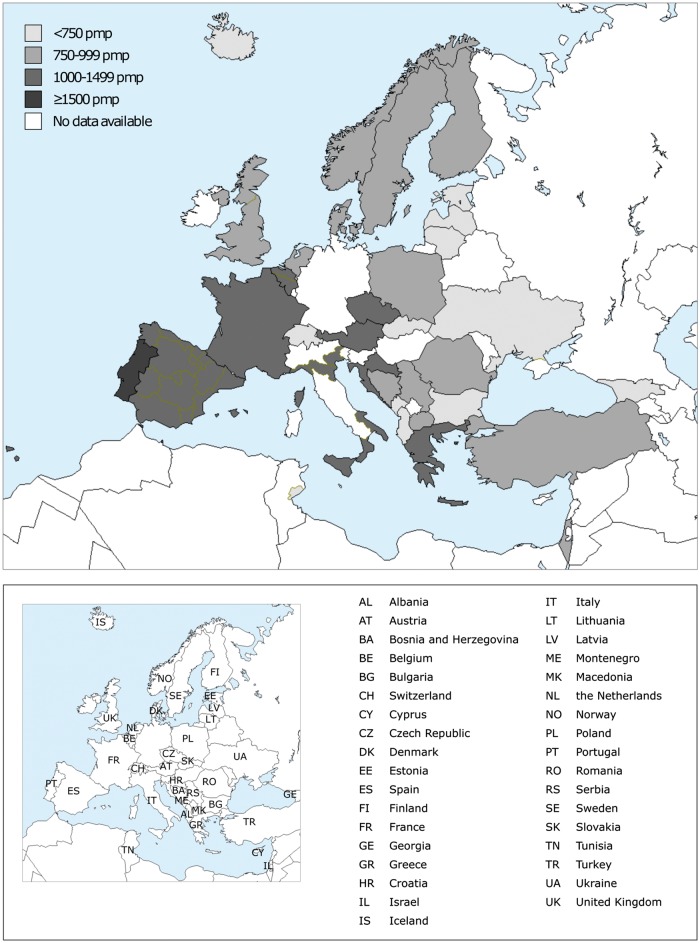
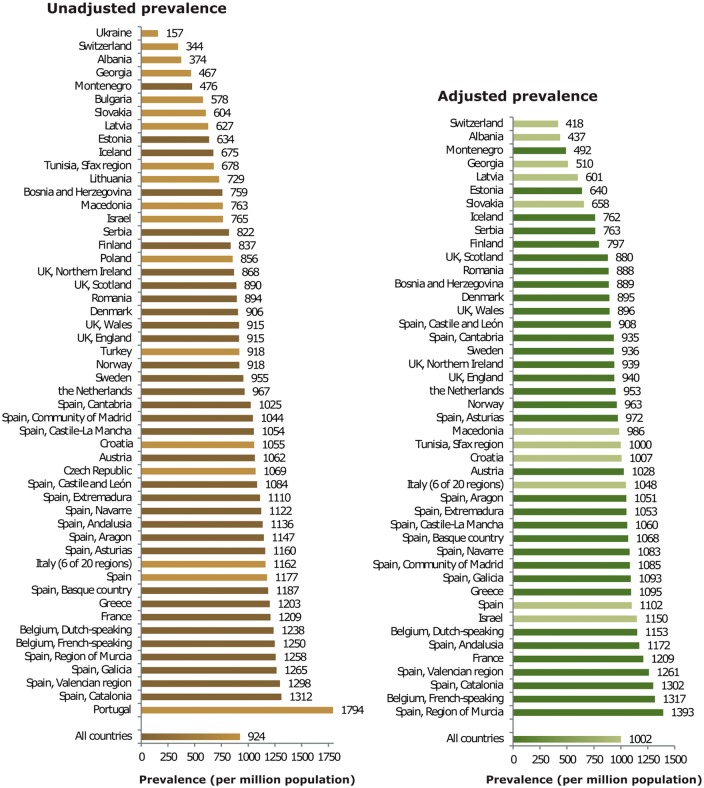
On 31 December 2014, 490 743 individuals were receiving RRT for ESRD (Table 2). This equated to an unadjusted prevalence of 924 pmp. Again there was considerable variation between countries, with the highest unadjusted prevalence rates seen in Portugal (1794 pmp), the Spanish regions of Catalonia (1312 pmp), Valencia (1298 pmp), Galicia (1265 pmp) and Murcia (1258 pmp), and French- and Dutch-speaking Belgium (1250 pmp and 1238 pmp, respectively, Table 2 and Figures 5 and 6). The unadjusted prevalence of RRT was considerably lower in the Ukraine (157 pmp) and Albania (374 pmp). Of the prevalent patients, the majority were men (60%); however, now just under half were aged ≥65 years (44%) and a fifth had diabetes mellitus (19%) as their primary renal diagnosis (Figure 7). The mean age of the prevalent patients receiving RRT in all countries and regions combined was 60.9 years (Table 2). This ranged from a mean age of 51.4 years in Albania to 66.4 years in Portugal. The majority of prevalent patients were receiving haemodialysis (57%), just over a third of patients were living with a kidney transplant (37%) and only 5% were receiving peritoneal dialysis (Figure 8). Once again the modality of RRT varied considerably between age groups; as the age of the prevalent patients increased the proportion living with a kidney transplant decreased. For those aged 20–44 years, 65% were living with a kidney transplant, whereas this was only 40% of patients aged 65–74 years. Again prevalent patients with a primary renal diagnosis of diabetes mellitus were much less likely to be living with a kidney transplant compared with the non-diabetic group (28% versus 49%).
Table 2.
Prevalence of RRT on 31 December 2014, for all primary renal diseases combined and diabetes mellitus types 1 and 2, by count (N) and unadjusted rate per million population, and for all primary renal diseases combined, the mean age of prevalent patients, presented by country/region
| General population covered by the registry in thousands | Prevalent patients on RRT in 2014 |
|||||
|---|---|---|---|---|---|---|
| Total N | Total pmp | Mean age | DM N | DM pmp | ||
| Albania | 2863 | 1072 | 374 | 51.4 | 120 | 42 |
| Austria | 8508 | 9038 | 1062 | 60.8 | 1791 | 211 |
| Belgium, Dutch-speakinga | 6444 | 7980 | 1238 | 65.5 | 1379 | 214 |
| Belgium, French-speakinga | 4788 | 5983 | 1250 | 64.6 | 1035 | 216 |
| Bosnia and Herzegovina | 3508 | 2662 | 759 | 59.4 | 501 | 143 |
| Bulgaria | 7217 | 4168 | 578 | |||
| Croatia | 4070 | 4295 | 1055 | 64.6 | 1246 | 306 |
| Cyprus | 847 | |||||
| Czech Republic | 10 222 | 10 931 | 1069 | |||
| Denmark | 5700 | 5164 | 906 | 58.4 | 869 | 153 |
| Estonia | 1315 | 834 | 634 | 57.8 | 155 | 118 |
| Finland | 5462 | 4571 | 837 | 58.8 | 1167 | 214 |
| France | 66 262 | 80 144 | 1210 | 62.2 | 12 604 | 190 |
| Georgia | 4491 | 2096 | 467 | 56.1 | 435 | 97 |
| Greece | 10 892 | 13 101 | 1203 | 63.8 | 2399 | 220 |
| Iceland | 327 | 221 | 675 | 56.0 | 24 | 73 |
| Israelb | 8216 | 6286 | 765 | 60.9 | 2909 | 354 |
| Italy (6 of 20 regions) | 21 274 | 24 721 | 1162 | 61.8 | 2941 | 138 |
| Latvia | 1590 | 996 | 627 | 55.7 | 97 | 61 |
| Lithuania | 2943 | 2146 | 729 | |||
| Macedonia | 2022 | 1543 | 763 | 56.9 | 225 | 111 |
| Montenegroa | 622 | 296 | 476 | 52.4 | 47 | 76 |
| Norway | 5137 | 4716 | 918 | 59.1 | 628 | 122 |
| Poland | 36 338 | 31 106 | 856 | |||
| Portugalc | 10 427 | 18 703 | 1794 | 66.4 | 3332 | 320 |
| Romaniad | 19 710 | 17 620 | 894 | 59.9 | 1897 | 96 |
| Serbia | 7131 | 5860 | 822 | 58.3 | 936 | 131 |
| Slovakiab | 5421 | 3273 | 604 | 62.7 | 1067 | 197 |
| Spain | 46 771 | 55 062 | 1177 | 59.5 | 7630 | 163 |
| Spain, Andalusia | 8394 | 9537 | 1136 | 60.0 | 1427 | 170 |
| Spain, Aragon | 1329 | 1524 | 1147 | 62.5 | 268 | 202 |
| Spain, Asturias | 1059 | 1228 | 1160 | 62.4 | 201 | 190 |
| Spain, Basque country | 2166 | 2571 | 1187 | 61.5 | 264 | 122 |
| Spain, Cantabriaa | 587 | 601 | 1025 | 61.0 | 85 | 145 |
| Spain, Castile and Leóna | 2487 | 2696 | 1084 | 63.8 | 467 | 188 |
| Spain, Castile-La Manchaa | 2069 | 2180 | 1054 | 61.6 | 335 | 162 |
| Spain, Catalonia | 7519 | 9863 | 1312 | 62.3 | 1410 | 188 |
| Spain, Extremadura | 1100 | 1221 | 1110 | 61.4 | 191 | 174 |
| Spain, Galicia | 2741 | 3468 | 1265 | 61.9 | 600 | 219 |
| Spain, Community of Madrid | 6454 | 6739 | 1044 | 61.4 | 1183 | 183 |
| Spain, Region of Murcia | 1467 | 1845 | 1258 | 61.7 | 251 | 171 |
| Spain, Navarrea | 636 | 714 | 1122 | 61.9 | 79 | 124 |
| Spain, Valencian region | 5005 | 6495 | 1298 | 62.7 | 853 | 170 |
| Sweden | 9696 | 9263 | 955 | 59.5 | 1641 | 169 |
| Switzerlandb | 8230 | 2834 | 344 | 68.1 | 540 | 66 |
| The Netherlands | 16 865 | 16 311 | 967 | 59.9 | 1991 | 118 |
| Tunisia, Sfax regionb | 1186 | 806 | 678 | 58.2 | 140 | 118 |
| Turkeye | 77 696 | 71 318 | 918 | 2821 | 36 | |
| Ukraine | 42 903 | 6742 | 157 | 902 | 21 | |
| UK, Englanda | 54 317 | 49 698 | 915 | 58.4 | 8043 | 148 |
| UK, Northern Irelanda | 1840 | 1598 | 868 | 58.2 | 243 | 132 |
| UK, Scotland | 5348 | 4757 | 890 | 56.5 | 724 | 135 |
| UK, Walesa | 3092 | 2828 | 915 | 59.5 | 483 | 156 |
| All countries | 531 690 | 490 743 | 924 | 60.9 | 62 962 | 155 |
When cells are left empty, the data are unavailable and, therefore, could not be used for the calculation of the summary data.
DM, diabetes mellitus as cause of renal failure.
Patients younger than 20 years of age are not reported. The true prevalent counts are, therefore, slightly higher than the counts reported here.
Data on prevalence include dialysis patients only.
Data on prevalence of cause of renal failure (DM) include dialysis patients only.
The overall prevalence of RRT is underestimated by approximately 3% due to an estimated 30% underreporting of patients living on a functioning graft.
Data on the prevalence of cause of renal failure (DM) are based on 8897 of 71 318 patients (12.5%).
Fig. 5.
Unadjusted prevalence per million population by country/region on 31 December 2014. The prevalence rates for Israel, Slovakia, Switzerland and Tunisia (Sfax region) only include patients receiving dialysis. For Romania, the overall prevalence of RRT is underestimated by 3% due to an estimated 30% underreporting of patients living on a functioning graft.
Fig. 6.
Unadjusted (left panel) and adjusted (right panel) prevalence per million population by country/region on 31 December 2014. Registries providing individual patient data are shown as dark bars and registries providing aggregated data as light bars. The prevalence rates for Israel, Slovakia, Switzerland and Tunisia (Sfax region) only include patients receiving dialysis. For Romania, the overall prevalence of RRT is underestimated by 3% due to an estimated 30% underreporting of patients living on a functioning graft.
Fig. 7.
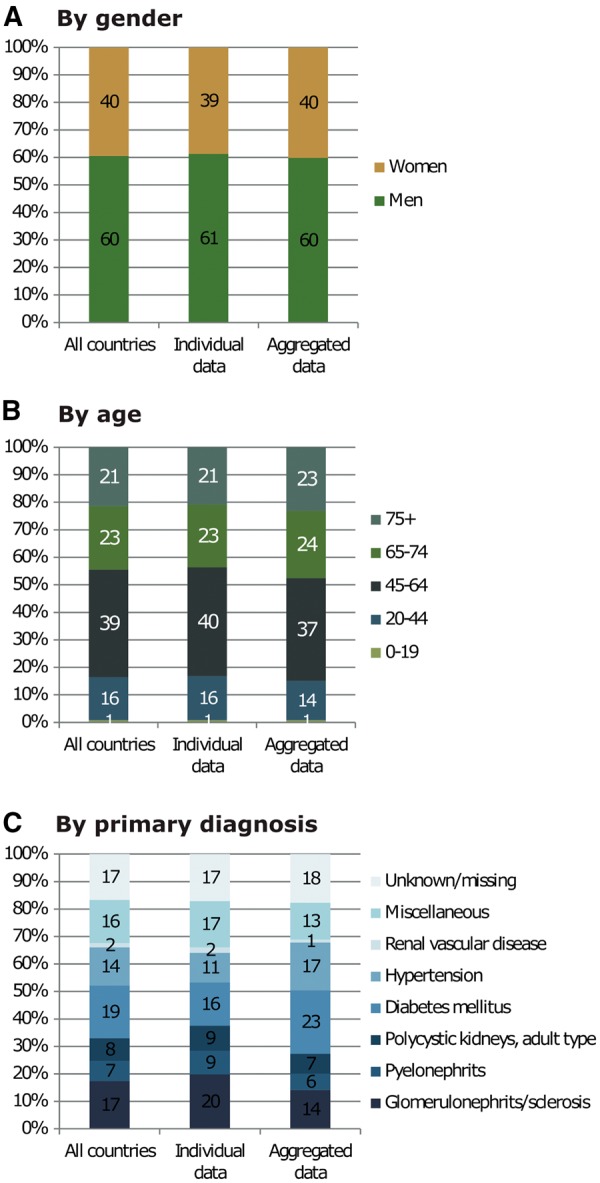
Unadjusted prevalent percentages by (A) gender, (B) age and (C) primary renal diagnosis on 31 December 2014. See Appendix 1 for a list of countries and regions supplying individual patient level or aggregated level data.
Fig. 8.
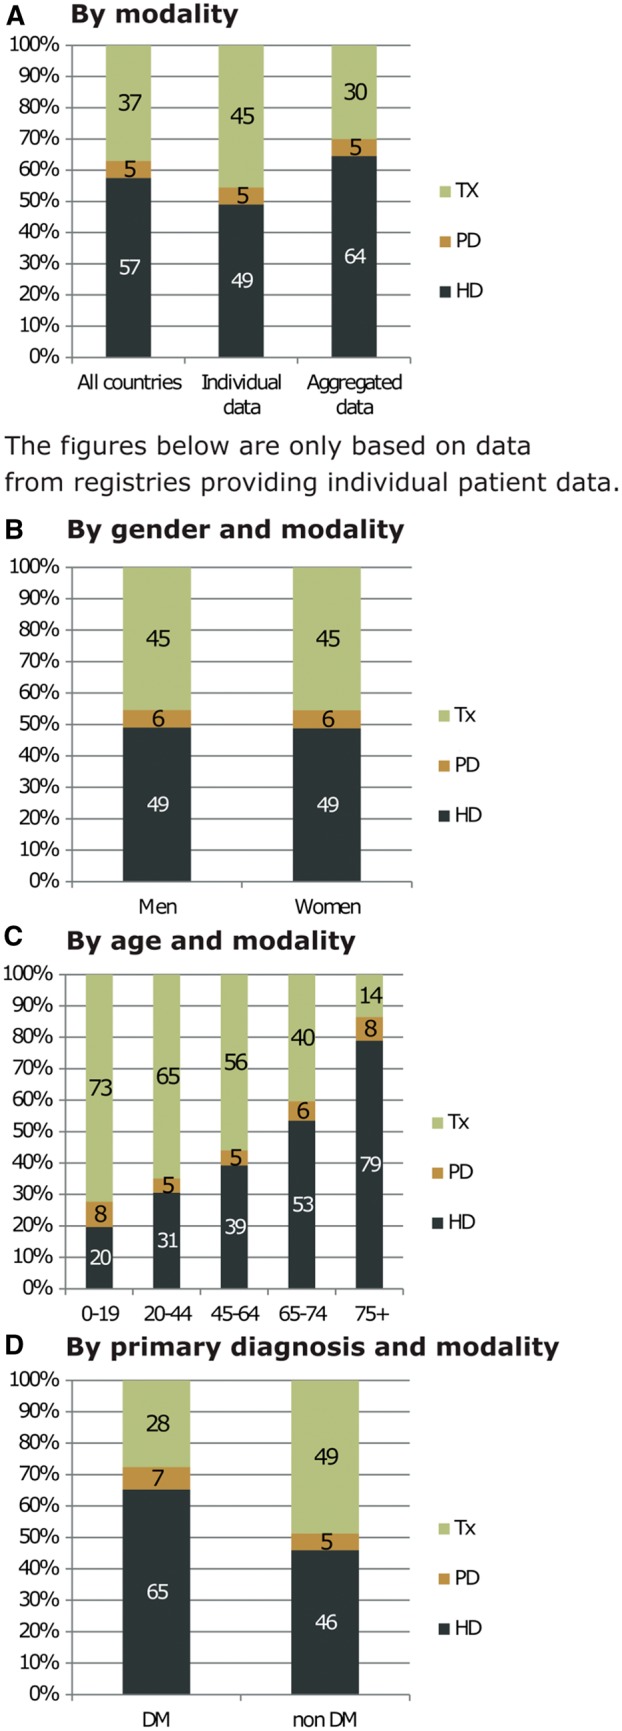
Unadjusted prevalent percentages of (A) established therapy overall, and established therapy by (B) gender, (C) age and (D) primary renal diagnosis on 31 December 2014. (B)–(D) are only based on data from registries providing individual patient data. See Appendix 1 for a list of countries and regions supplying individual patient level or aggregated level data. HD, haemodialysis; PD, peritoneal dialysis; Tx, transplant; DM, diabetes mellitus.
Kidney transplantation
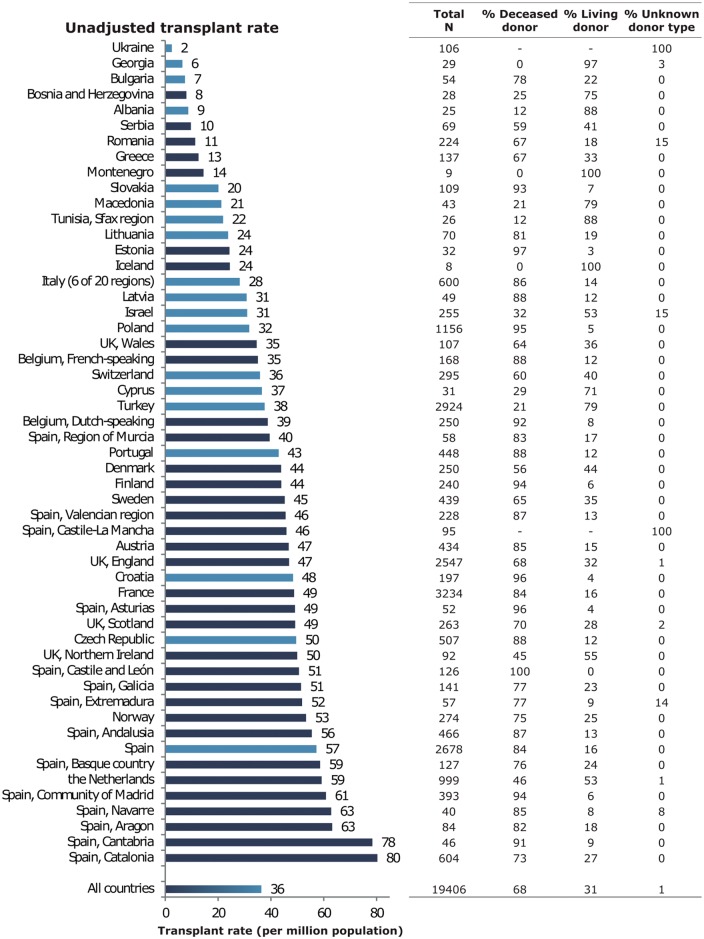
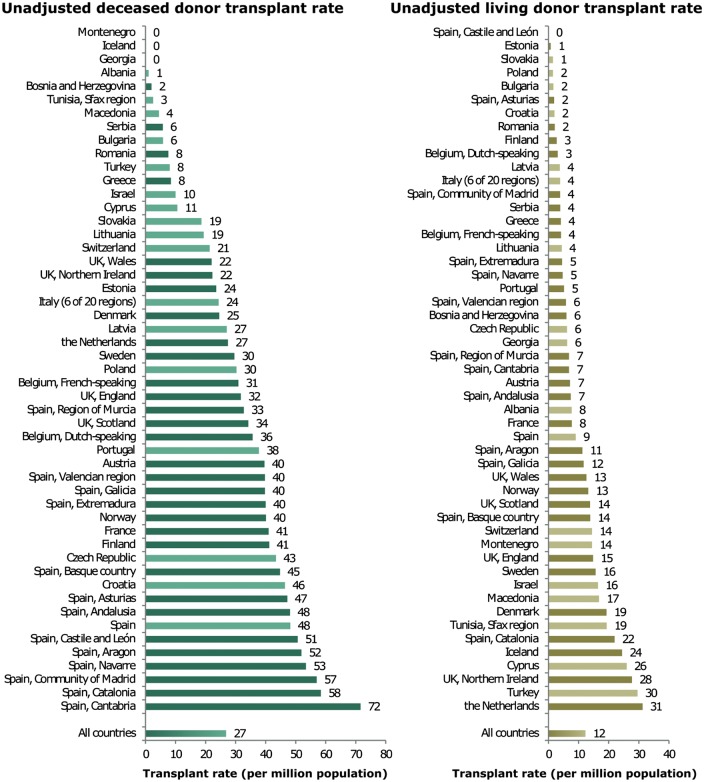
In 2014, 19 406 kidney transplantations were performed that equated to an overall unadjusted transplant rate of 36 pmp (Figure 9). Again this figure varied considerably between countries with the highest unadjusted transplant rates seen in the Netherlands (59 pmp), Spain (57 pmp) and Norway (53 pmp), with some Spanish regions reaching even higher rates. Conversely, the lowest unadjusted transplant rates were reported in the Ukraine (2 pmp), Georgia (6 pmp) and Bulgaria (7 pmp). Overall the unadjusted deceased donor transplant rate was more than double that of the unadjusted living donor transplant rate (27 pmp versus 12 pmp, Figure 10; 68% versus 31%, Figure 11). The highest unadjusted rates of deceased donor transplants were seen in Spain (48 pmp), Croatia (46 pmp) and the Czech Republic (43 pmp, Figure 10), whereas the highest unadjusted rate of living donor transplants were seen in the Netherlands (31 pmp), Turkey (30 pmp) and Northern Ireland (28 pmp, Figure 10).
Fig. 9.
Kidney transplants performed in 2014, as counts and per million population (unadjusted) by country/region. Registries providing individual patient data are shown as dark bars and registries providing aggregated data as light bars. Data based on patients aged ≥20 years in Dutch-speaking Belgium, French-speaking Belgium, Montenegro, the Spanish regions of Cantabria, Castile and León, Castile-La Mancha and Navarre, and the UK: England, Northern Ireland and Wales. The total count for Austria is based on residents and non-residents. For Romania the transplantation activity reflects 70% of the total transplantation activity in the country due to an underreporting of pre-emptive transplantation.
Fig. 10.
Unadjusted deceased donor (left panel) and living donor (right panel) kidney transplants per million population performed in 2014 by country/region. Registries providing individual patient data are shown as dark bars and registries providing aggregated data as light bars. Data based on patients aged ≥20 years in Dutch-speaking Belgium, French-speaking Belgium, Montenegro, the Spanish regions of Cantabria, Castile and León, Castile-La Mancha and Navarre, and the UK: England, Northern Ireland and Wales. The total count for Austria is based on residents and non-residents. For Romania, the transplantation activity reflects 70% of the total transplantation activity in the country due to an underreporting of pre-emptive transplantation.
Fig. 11.
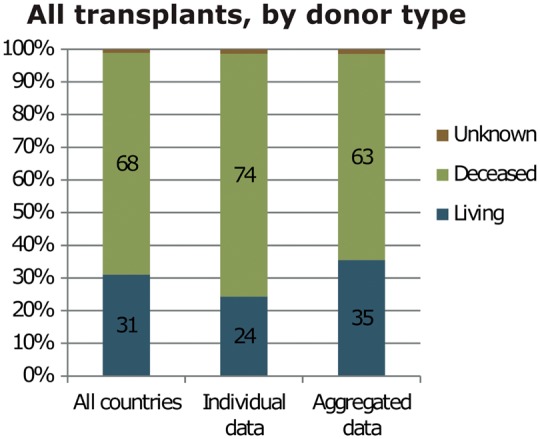
Percentage of kidney transplants performed in 2014 by kidney donor type. See Appendix 1 for a list of countries and regions supplying individual patient level or aggregated level data.
Survival of patients receiving RRT
For patients commencing RRT in the period 2005–09, the 1-, 2- and 5-year-adjusted patient survival probabilities on all RRT modalities were 90.0% [95% confidence interval (CI) 89.9–90.2], 82.8% (95% CI 82.6–83.0) and 63.3% (95% CI 63.0–63.6), respectively (see Appendix 2 and Table 3 for a description of the adjustments made and the countries/regions included in this analysis). For the same cohort of patients commencing dialysis between 2005 and 2009, the 1-, 2- and 5-year-adjusted patient survival probabilities (with kidney transplantation considered as a censored event) were 88.1% (95% CI 87.9–88.2), 79.5% (95% CI 79.2–79.7) and 55.7% (95% CI 55.3–56.1), respectively. Patient survival after a first kidney transplant performed during 2005 and 2009 was much better than for those patients receiving dialysis (Figure 12). For those with a transplant, 5-year-adjusted patient and graft survival remain higher with a living donor transplant compared with a deceased donor transplant [95.7% (95% CI 95.2–96.2) versus 92.3% (95% CI 91.9–92.7) for patient survival and 87.0% (95% CI 86.3–87.8) versus 81.6% (95% CI 81.1–82.2) for graft survival. See Appendix 2 and Table 3 for a description of the adjustments made and the countries/regions included in this analysis.].
Table 3.
The 1-, 2- and 5-year survival probabilities by treatment modality and cohort from day 1 of the start of RRT/dialysis or from the day of transplantation
| Survival probabilities as percentage (95% CI) |
||||||
|---|---|---|---|---|---|---|
| Cohort: 2005–09 |
Cohort: 2008–12 |
|||||
| 1 year | 2 year | 5 year | 1 year | 2 year | ||
| Patient survival on RRT | ||||||
| Unadjusted | 82.7 (82.5–82.8) | 72.0 (71.8–72.1) | 49.4 (49.2–49.5) | 83.8 (83.6–84.0) | 73.7 (73.5–73.9) | |
| Adjusteda | 90.0 (89.9–90.2) | 82.8 (82.6–83.0) | 63.3 (63.0–63.6) | 90.6 (90.4–90.7) | 83.8 (83.6–84.0) | |
| Patient survival on dialysis (with kidney transplantation as a censored observation) | ||||||
| Unadjusted | 81.7 (81.5–81.9) | 69.7 (69.5–69.9) | 41.5 (41.3–41.6) | 82.7 (82.6–82.9) | 71.3 (71.1–71.4) | |
| Adjusteda | 88.1 (87.9–88.2) | 79.5 (79.2–79.7) | 55.7 (55.3–56.1) | 89.0 (88.9–89.2) | 81.1 (80.8–81.3) | |
| Patient survival after first kidney transplantation (deceased donor) | ||||||
| Unadjusted | 96.1 (95.8–96.3) | 94.2 (93.9–94.5) | 87.9 (87.5–88.3) | 96.4 (96.1–96.6) | 94.4 (94.1–94.6) | |
| Adjustedb | 97.6 (97.4–97.8) | 96.4 (96.2–96.6) | 92.3 (91.9–92.7) | 98.0 (97.8–98.1) | 96.8 (96.6–97.0) | |
| Graft survival after first kidney transplantation (deceased donor) | ||||||
| Unadjusted | 90.9 (90.6–91.2) | 88.1 (87.7–88.4) | 79.0 (78.6–79.4) | 91.2 (90.9–91.5) | 88.3 (88.0–88.6) | |
| Adjustedb | 92.2 (91.8–92.5) | 89.7 (89.3–90.1) | 81.6 (81.1–82.2) | 92.7 (92.4–93.0) | 90.2 (89.8–90.6) | |
| Patient survival after first kidney transplantation (living donor) | ||||||
| Unadjusted | 98.4 (98.1–98.7) | 97.5 (97.1–97.8) | 94.2 (93.7–94.7) | 98.8 (98.6–99.0) | 97.9 (97.6–98.2) | |
| Adjustedb | 98.8 (98.6–99.1) | 98.2 (97.9–98.5) | 95.7 (95.2–96.2) | 99.2 (99.0–99.3) | 98.6 (98.3–98.8) | |
| Graft survival after first kidney transplantation (living donor) | ||||||
| Unadjusted | 95.5 (95.0–95.9) | 93.6 (93.0–94.1) | 87.0 (86.4–87.7) | 96.3 (95.9–96.6) | 94.5 (94.1–94.9) | |
| Adjustedb | 95.5 (95.0–96.0) | 93.7 (93.1–94.2) | 87.0 (86.3–87.8) | 96.3 (96.0–96.7) | 94.6 (94.2–95.1) | |
This is based on data from the following registries providing individual patient data: Austria, Belgium (Dutch-speaking), Belgium (French-speaking), Denmark, Finland, France, Greece, Iceland, Norway, Spain (Andalusia), Spain (Aragon), Spain (Asturias), Spain (Basque country), Spain (Cantabria), Spain (Castile and León), Spain (Castile-La Mancha), Spain (Catalonia), Spain (Extremadura), Spain (Galicia), Spain (Valencian region), Sweden, the Netherlands and the UK (all countries).
Analyses were adjusted using fixed values: age (60 years), gender (60% men) and primary renal disease (20% diabetes mellitus, 17% hypertension/renal vascular disease, 15% glomerulonephritis and 48% other causes).
Analyses were adjusted using fixed values: age (45 years), gender (60% men) and primary renal disease (10% diabetes mellitus, 8% hypertension/renal vascular disease, 28% glomerulonephritis and 54% other causes).
Fig. 12.
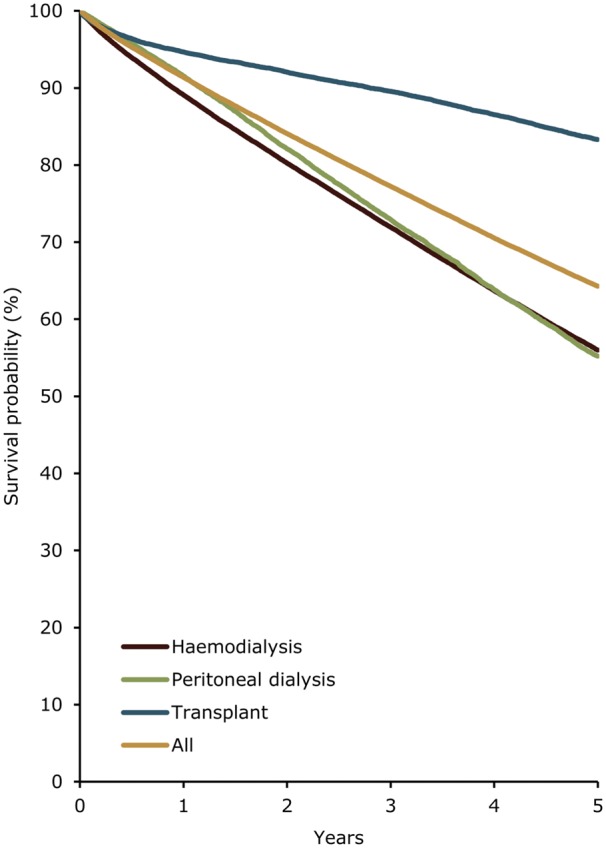
The 5-year adjusted survival probability of incident dialysis patients (commencing RRT between 2005 and 2009) and patients receiving a first transplant (between 2005 and 2009) from day 91 by modality, adjusted for age, gender and primary renal diagnosis. Survival on dialysis was examined using the Cox regression method, with transplantation as a censored event (see the ERA-EDTA 2014 Annual Report for the full methods). Analyses were adjusted using fixed values: age (60 years), gender (60% men) and primary renal diagnosis (20% diabetes mellitus, 17% hypertension/renal vascular disease, 15% glomerulonephritis and 48% other causes). This figure is based on data from the following registries providing individual patient data: Austria, Belgium (Dutch-speaking), Belgium (French-speaking), Denmark, Finland, France, Greece, Iceland, Norway, Spain (Andalusia), Spain (Aragon), Spain (Asturias), Spain (Basque country), Spain (Cantabria), Spain (Castile and León), Spain (Castile-La Mancha), Spain (Catalonia), Spain (Extremadura), Spain (Galicia), Spain (Valencian region), Sweden, the Netherlands and the UK (all countries).
Expected remaining lifetime
There remains a substantial difference in the expected remaining lifetime between the general population and those receiving dialysis (Figure 13). Patients aged 20–45 years old receiving dialysis are expected to live only one-third as long as the age-matched general population. The prospect is even worse for patients aged 55–64 years, as they are expected to live only a quarter as long as their age-matched counterparts in the general population. Patients living with a kidney transplant fare better than their counterparts receiving dialysis. However, for the transplant recipients aged 20–49 years their life expectancy is still approximately one-third less than that of the age-matched general population. As the age of the transplant recipient increases, the disparity in life expectancy with the age-matched general population also increases.
Fig. 13.
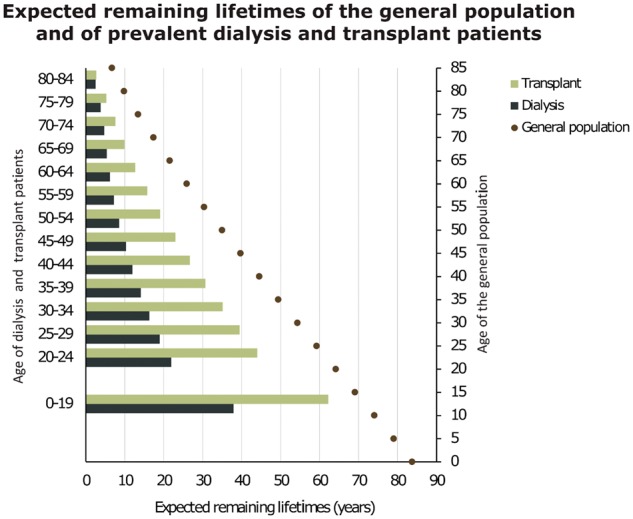
Expected remaining lifetimes of the general population in 2013 and 2014, and of prevalent dialysis and transplant patients in 2013 and 2014 (includes mortality in the first 90 days), by age and gender. This figure is based on data from the following registries providing individual patient data: Austria, Belgium (Dutch-speaking), Belgium (French-speaking), Bosnia and Herzegovina, Denmark, Estonia, Finland, France, Greece, Iceland, Norway, Spain (Andalusia), Spain (Aragon), Spain (Asturias), Spain (Basque country), Spain (Cantabria), Spain (Castille and León), Spain (Castille-La Mancha), Spain (Catalonia), Spain (Extremadura), Spain (Galicia), Spain (Community of Madrid), Spain (Region of Murcia), Spain (Valencian region), Sweden, the Netherlands and the UK (all countries).
Affiliated registries
Albanian Renal Registry (M. Barbullushi, A. Koroshi and all team of Nephrology); Austrian Dialysis and Transplant Registry (OEDTR) (R.K.); Dutch-speaking Belgian Society of Nephrology (NBVN) (B. De Moor, F. Schroven and J. De Meester); French-speaking Belgian Society of Nephrology (GNFB) (J.M.d.G. and F. Collart); Renal Registry Bosnia and Herzegovina (H.R., L. Lukić and S. Corić); Bulgaria (E.S.V., I. Velinova and M. Gitcheva); Croatian Registry of Renal Replacement Therapy (CRRRT) (I.B., S. Rački and N. Janković); Cyprus Renal Registry (K.I. and all of the renal units providing data); Czech Republic: Registry of Dialysis Patients (RDP) (I. Rychlík, J. Potucek and F.L.); Danish Nephrology Registry (DNS) (J.G.H.); Estonian Society of Nephrology (Ü. Pechter, M.R. and K. Lilienthal); Finnish Registry for Kidney Diseases (P.F. and C. Grönhagen-Riska); France: The Epidemiology and Information Network in Nephrology (REIN) (M.L. and C. Couchoud); Georgian Renal Registry (N.K. and Dialysis Nephrology and Transplantation Union of Georgia); Hellenic Renal Registry (N.A.); Icelandic End-Stage Renal Disease Registry (R.P.); Israel National Registry of Renal Replacement Therapy (R. Dichtiar, T. Shohat and E.G.); Italian Registry of Dialysis and Transplantation (RIDT) (M.N., M. Postorino and A. Limido); Latvian Renal Registry (H.C. and V. Kuzema); Lithuanian Renal Registry (V. Kuzminskis, I.A. Bumblytė and E.Ž.); Macedonian Renal Registry (L. Trpenovski, Z. Seljami and O.S.-T.); Montenegrin Renal Registry (M.R., D. Radunovic and V. Prelevic); Norwegian Renal Registry (T. Leivestad, A.V. Reisæter and A.Å.); Polish Renal Registry (B.R., M. Klinger and G. Korejwo); Portuguese Renal Registry (F.M., F. Nolasco and R. Filipe); Romanian Renal Registry (RRR) (G. Mircescu, L.G. and E. Podgoreanu); Renal Registry in Serbia (Working Group of Serbian RRT Registry and all of the Serbian renal units); Slovakian Renal Registry (V.S., I. Lajdová and M. Karolyova); Spanish RRT National Registry at ONT, Spanish Regional Registries and Spanish Society of Nephrology (SEN) and the regional registries of Andalusia (SICATA) (P.C.d.l.N.), Aragon (J.I. Sanchez Miret and J.M. Abad Diez), Asturias (R. A.d.l.T., J.R. Quirós and RERCA Working Group), Basque country (UNIPAR) (Á.M., J. Aranzabal, M. Rodrigo and I. Moina), Cantabria (M. Arias Rodríguez and O. García Ruiz), Castile and León (R.G. and C. Fernández-Renedo), Castile-La Mancha (G. Gutiérrez Ávila and I.M.A.), Catalonia (RMRC) (E. Arcos, J. Comas and J. Tort), Extremadura (J.M. Ramos Aceitero and M.A.G.B.), Galicia (E.B.C. and J. Sánchez-Ibáñez), Community of Madrid (M.I.A.M.), Renal Registry of the Region of Murcia (C.S.d.P. and I. Marín Sánchez), Navarre (M.F.S.R., J. Manrique Escola and J. Arteaga Coloma) and the Valencian region (REMRENAL) (C. Alberich Martí and M.F.A.); Swedish Renal Registry (SNR) (K.G. Prütz, M.E.S., M. Evans, S. Schön, L. Bäckman and M. Segelmark); Swiss Dialysis Registry (P. Ambühl and R. Winzeler); Dutch Renal Registry (RENINE) (M.H.H. and A. Hemke); Tunisia, Sfax region (D. Zalila, S. Toumi and F.J.); Registry of the Nephrology, Dialysis and Transplantation in Turkey (TSNNR) (G. Süleymanlar, N.S. and K. Ateş); Ukrainian Renal Data System (URDS) (M.K., S. Nikolaenko and O. Dubyna); UK Renal Registry (UKRR) (all the staff of the UK Renal Registry and of the renal units submitting data); Scottish Renal Registry (SRR) (all of the Scottish renal units).
ERA-EDTA Registry committee members
A. Więcek, Poland (ERA-EDTA President); Z.M., France (Chairman); F.J.C., UK; C. Couchoud, France; M. Evans, Sweden; P.F., Finland; J.W. Groothoff, the Netherlands; J. Harambat, France; J.G.H., Denmark; F.J., Tunisia; Mar.N., Italy; and I. Rychlik, Czech Republic.
ERA-EDTA Registry office staff
K.J.J. (Managing Director), M.B. (for the paediatric section), R. Cornet, G. Guggenheim, A.K., Mau.N., M.P., V.S.S. and A.J. Weerstra.
Conflict of interest statement
None declared.
Acknowledgements
The ERA-EDTA Registry would like to thank the patients and staff of all the dialysis and transplant units who have contributed data via their national and regional renal registries. In addition, we would like to thank the persons and organizations listed in the paragraph ‘affiliated registries’ for their contribution to the work of the ERA-EDTA Registry. The ERA-EDTA Registry is funded by the European Renal Association – European Dialysis and Transplant Association (ERA-EDTA). This article was written by M.P. et al. on behalf of the ERA-EDTA Registry, which is an official body of the ERA-EDTA.
Appendix 1
Countries or regions providing individual patient level data. Austria, Dutch-speaking Belgium, French-speaking Belgium, Bosnia and Herzegovina, Denmark, Estonia, Finland, France, Greece, Iceland, Montenegro, Norway, Romania, Serbia, the Spanish regions of Andalusia, Aragon, Asturias, Basque country, Cantabria, Castile and León, Castile-La Mancha, Catalonia, Extremadura, Galicia, Community of Madrid, Murcia, Navarre and Valencian region, Sweden, the Netherlands, UK (England/Northern Ireland/Wales) and UK (Scotland).
Countries or regions providing aggregated patient level data. Albania, Bulgaria, Croatia, Cyprus, Czech Republic, Georgia, Israel, Italy, Latvia, Lithuania, Macedonia, Poland, Portugal, Slovakia, Spain, Switzerland, Tunisia (Sfax region), Turkey and Ukraine.
Appendix 2
Analyses for patient survival on RRT and dialysis were adjusted using the following fixed values: age (60 years), gender (60% men) and primary renal diagnosis (20% diabetes mellitus, 17% hypertension/renal vascular disease, 15% glomerulonephritis and 48% other causes).
Analyses for patient and graft survival after a first kidney transplant were adjusted using the following fixed values: age (45 years), gender (60% men) and primary renal diagnosis (10% diabetes mellitus, 8% hypertension/renal vascular disease, 28% glomerulonephritis and 54% other causes).
The survival analyses presented here were based on data from Austria, Dutch- and French-speaking Belgium, Denmark, Finland, France, Greece, Iceland, Norway, the Spanish regions of Andalusia, Aragon, Asturias, Basque country, Cantabria, Castile and León, Castile-La Mancha, Catalonia, Extremadura, Galicia and Valencian region, Sweden, the Netherlands and the UK.
References
- 1. ERA-EDTA Registry. ERA-EDTA Registry Annual Report 2014. Amsterdam, The Netherlands: Academic Medical Center, Department of Medical Informatics, 2016
- 2. Noordzij M, Kramer A, Abad Diez JM. et al. Renal replacement therapy in Europe: a summary of the 2011 ERA-EDTA Registry Annual Report. Clin Kidney J 2014; 7: 227–238 [DOI] [PMC free article] [PubMed] [Google Scholar]
- 3. Pippias M, Stel VS, Abad Diez JM. et al. Renal replacement therapy in Europe: a summary of the 2012 ERA-EDTA Registry Annual Report. Clin Kidney J 2015; 8: 248–261 [DOI] [PMC free article] [PubMed] [Google Scholar]
- 4. Kramer A, Pippias M, Stel VS. et al. Renal replacement therapy in Europe: a summary of the 2013 ERA-EDTA Registry Annual Report with a focus on diabetes mellitus. Clin Kidney J 2016; 9: 457–469 [DOI] [PMC free article] [PubMed] [Google Scholar]


