Abstract
We present findings in an experiment where we obtain stationary ramified transportation networks in a macroscopic nonbiological system. Our purpose here is to introduce the phenomenology of the experiment. We describe the dynamical formation of the network which consists of three growth stages: (I) strand formation, (II) boundary formation, and (III) geometric expansion. We find that the system forms statistically robust network features, like the number of termini and the number of branch points. We also find that the networks are usually trees, meaning that they lack closed loops; indeed, we find that loops are unstable in the network. Finally, we find that the final topology of the network is sensitive to the initial conditions of the particles, in particular to its geometry.
Keywords: pattern formation, self-organization
Pattern formation, loosely speaking, is the study of order in open dissipative systems (1); this includes dynamic self-organization, characteristic of fluid and chemical systems (2), and inhomogeneous growth, characteristic in some physical (3–6) and biological (7–9) systems. Of more recent interest, not generally categorized under pattern formation, is the evolution of complex networks (10). Although this latter study has so far focused on abstract topological issues, it may soon bear important connections with the former studies, especially as it pertains to branched (what we shall refer to as ramified) patterns used for transportation throughout nature. Indeed, several researchers have attempted to include either spatial (11, §) or flow (12) constraints to the study of complex networks. Meanwhile, efficient transportation of resources through real fractal networks was already an important insight into understanding the allometric scaling of all organisms (13, 14).
Another example of a transportation network, this time nonbiological, was studied in experiments on an electromechanical system (15–17), where conducting particles self-organize into dendritic patterns under the influence of an electric field for the purpose of collecting and transporting charge. The authors were concerned with formulating a variational principle concerning the stability of patterns in open dissipative systems. In those studies, the authors concluded that in order for the patterns to be stable, they must be (locally) minimal in dissipation. The experiment has also been studied in simulation with the idea that fractals are generated by a dynamical rule: Particles always move to regions of higher gradient in potential until they stick next to a boundary point (18). All studies simplified the system by dealing only with the two-dimensional Poisson equation, and by assuming the source of charge was independent of both space and time:  , where ϕ is the electric potential, S is the source term, and σoil is the conductivity of the oil medium. The limitations of these approximations are unknown. Moreover, the proof showing that the dissipation is minimal relies on showing that the potential energy is also minimal; calculating the resistance is no less complicated than calculating the potential energy, offering few advantages in predicting the behavior of open dissipative systems. As for fractal measures of the system, the experiments include less than two orders of magnitude between the smallest and largest scale; thus, the notion of a fractal is contentious. Also, all previous studies focused on the steady-state structure of the system, largely neglecting the dynamics of formation. Finally, all studied the formation of the patterns only under random initial conditions.
Here, we study the experimental system with the view that the patterns formed, fractal or not, are better described as ramified in architecture; thus, the key aspect of the system is the topology rather than the dimension. We broaden the scope over past studies by including (i) the dynamics of the system and (ii) studying different initial conditions. We find that for compact initial distributions, the formation of the pattern has three regimes: (I) strand growth, (II) boundary formation, and (III) geometric expansion. Each of the three stages is described below.
The experiment presented in this letter consists of a high-voltage power supply connected to a set of electrodes, the boundary electrode (BE) and the source electrode (SE). The BE lines a glass or acrylic dish (diameter, d, ≈120 mm) that contains dielectric liquid (castor oil) and conducting particles (400–1,200 stainless-steel ball bearings; d ≈ 1.6 mm); diffusion is not prominent in the experiment; the BE for this experiment is circular but can be of arbitrary shape. The SE is needle-shaped and is placed above the center of the dish (h ≈ 50 mm), beyond the point of breakdown at the voltages used for the experiment; for visualization, one can think of the SE as spraying electrons quasi-homogeneously over the surface of the oil, and the particles act as collectors that transport charge through the boundary.
Before running an experiment, the particles are prepared in an initial state; Fig. 1a shows a tightly compact circular distribution (the shape, compactness, and symmetry can be chosen arbitrarily). At time t = 0 sec, a voltage difference of 20 kV is applied between the two electrodes. The experiment runs until the particles form a stationary network.
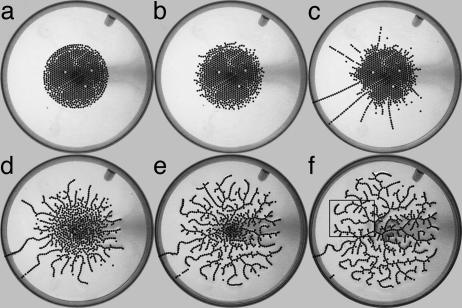
Fig. 1.
Time sequence for single experimental run. The number of particles in the final network is 784. (a) Circular initial condition (t = 0 sec). (b) After the voltage is applied, bumps form along the perimeter of the distribution (t = 10 sec). (c) Bumps self-organize into chains (t = 847 sec). (d) One chain connects, the rest wither and form into outer termini, and interior particles begin to form the inner network (t = 854 sec). (e) Network unfolds from the outside in with little change in network structure (t = 928 sec). (f) Final state of network. The box indicates the area of detail shown in Fig. 3 (t = 4,647 sec).
There are three stages to the growth of the pattern: (I) strand formation, (II) boundary formation, and (III) geometric expansion. We will describe the phenomenology of the three stages below. These stages can be viewed in Movies 1–3, which are published as supporting information on the PNAS web site.
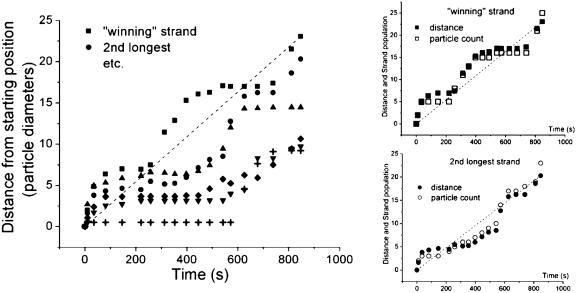
In stage I, the particles move toward connecting to the boundary. This can best be seen in the single-particle-width strands that grow toward the outer electrode, depicted in Fig. 1 b and c. The growth of individual strands vs. time for a typical experiment is shown in Fig. 2. The graph plots the distance that the lead particle of a strand moves from its starting position as a function of time. The Insets show that the distance of the lead particle matches well with the number of particles in a strand, defined as the number of particles that have moved more than one particle radius from their starting positions to join the strand. This means that the lead particle recruits particles behind it as it moves toward the boundary. The first noticeable feature from Fig. 2 is that each strand grows in spurts, with periods of movement and rest. The second, more remarkable feature is that there is some correlation between the spurts; strands tend to move and rest together.
Fig. 2.
The growth of the six largest strands vs. time from a typical experiment; the distance has been scaled to the diameter of a particle. The dashed line is the path of the average speed of the winning strand. The Insets show that the distance that the lead particle moves correlates well with the number of particles in the strand, meaning that a lead particle of a strand moves by recruiting particles in its trail. The dashed lines in the Insets are again the paths of the average speed for each strand.
Stage I ends when one of the strands reaches the BE. The lead particle of the winning strand becomes electrically connected to the boundary and shares the same electrical potential. The second particle of that strand can then connect to the leading particle and so forth. The process by which particles become electrically connected to the boundary is stage II.
In stage II, the particles bind together to form the network and establish its topology. The lead particle of the “winning” strand binds to the boundary. Successive particles bind to neighbors that are already electrically connected to the boundary. The cascade of bindings runs through all of the particles in a short time, on the order of fractions of a second. The key aspect of this binding is that the network topology begins to set during this time: Some particles move toward each other and connect, whereas others break apart from each other. In other words, each particle becomes one of three types: type i is a trunk that connects to only two other particles; type ii is a branching point that connects to three or more particles; and type iii is a terminus that connects to only one other particle (see Fig. 3 for a detailed view of each kind of particle). Each particle that binds to the network chooses its type in stage II depending on how many neighboring particles it binds to, and therefore the topology of the network is largely determined during this stage. Reconfiguration of the topology may occur during stage III, but because the particles are tightly bound within the network, the final structure is mostly determined in stage II.
Fig. 3.
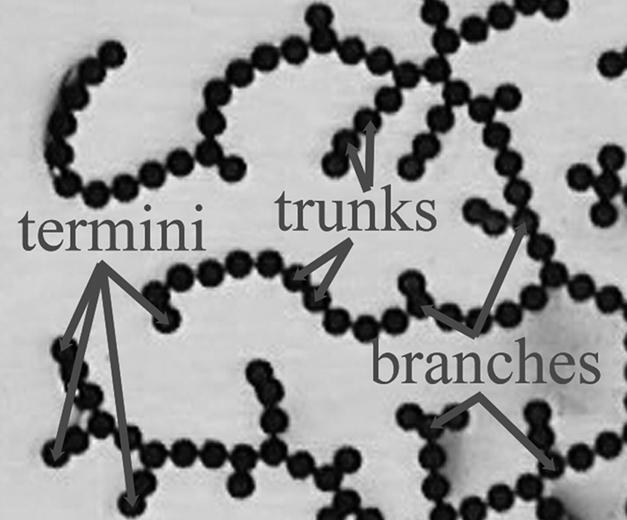
Detail of the final network from Fig. 1f. The network is characterized by the three types of particles shown in the figure. Termini touch only one other particle; trunk particles touch exactly two other particles; and branching points touch three or more particles.
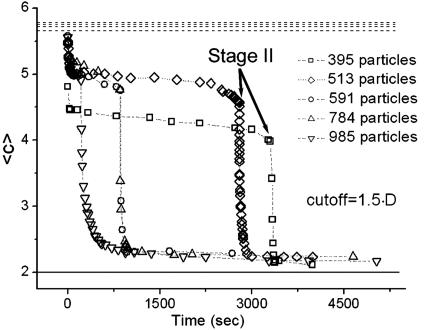
Fig. 4 shows a measure of the connectedness of the particles as a function of time. The graph shows the average number of neighbors that each particle has surrounding it; we refer to this quantity as the average adjacency, 〈c〉, mathematically defined as
 |
where the sums are over the total number of particles, N, and where ci and  are the adjacency and position of particle i, Θ is the Heaviside step function, and lc is a cutoff length that would ideally be set very close to a particle diameter d; lc is set to be 1.5·d in Fig. 4. Stage II is indicated in the plot; note the drastic change in slope of 〈c〉 as a function of time after that point. The top dashed lines are estimates of the initial adjacency by considering the relative number of perimeter particles to volume particles
  . The bottom solid line is the steady-state adjacency given by 2(1 - 1/N).
Fig. 4.
Graph showing the adjacency, 〈c〉, as a function of time for five different experiments. The dashed lines are an approximation to the value of 〈c〉 at t = 0 sec, using geometric considerations. The solid line is the steady-state adjacency, which is ≈2.
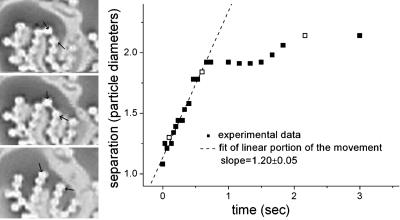
It bears mentioning that the network rarely forms closed loops (every terminus in the network has a distinct path to the boundary). Indeed, loops are unstable in the network. Fig. 5 Left shows a pair of particles artificially placed in a loop; within a few moments the two particles separate from each other. Fig. 5 also shows the separation of the two particles as a function of time.
Fig. 5.
Two particles separate from one another to break an artificial loop. (Left) Three snapshots of two particles (indicated by the two arrows in each photo), which were artificially placed in a loop (Top). After less than a second the two particles separate from one another (Middle). At that point, the particles return to a steady state (Bottom). Bright and dark areas on the photos have been digitally inverted for better visibility. (Right) Graph showing the separation of the two particles (scaled by the size of one particle radius) as a function of time; the unfilled boxes represent the data points depicted by the photos in Left. The dashed line is a linear fit to the initial movement of the particles.
Something also interesting to note is that branching points mostly connect to three other particles. Connecting to four is possible, but much rarer; connecting to five or six never happens; and connecting to more than six is not possible in two dimensions for particles of the same size.
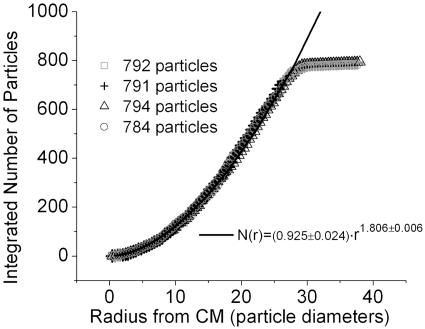
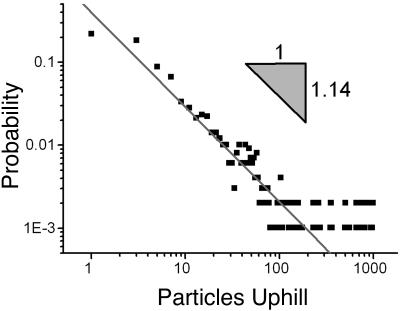
In stage III, the network expands into the available space while maintaining its network topology. Particles located nearest the boundary are the first to spread. The unfolding then proceeds to the inner particles until the entire network spreads to its maximum size. At this point, the network moves only slightly in a slow wobble that neither affects its topology nor its average spatial properties. Fig. 1 d–f depict the unfolding process. Fig. 6 shows how the particles are radially distributed in the steady-state network. The mass dimension, defined as the exponent obtained from Σ ρ(r) = N ∼ rξm, was fitted from the data shown in Fig. 6. The obtained values of the dimension were ξm ≃ 1.74–1.91. Another feature of the network can be seen in the density function P(n), which measures the probability that there are n particles connected “upstream” of a given point, where upstream in this case means toward the termini. Fig. 7 shows P(n) for a typical steady-state network. The density distribution shows a power law behavior for less than two orders of magnitude with an exponent of -1.14. The value of this exponent varies between -1.10 and -1.33 with little dependence on the number of particles in the experiment. This exponent was originally used to characterize river basins (19) and later the internet (20); it offers a measure of comparability between different networks. For river basins, the exponents are similar because regardless of details, they tend to approach a state of minimal energy dissipation (19). The variability of the exponents in our experiments may be due to finite scaling but may also suggest that they may not reach an optimal dissipation state as reported earlier (15–17); this may be due to dynamical effects such as static friction.
Fig. 6.
The integrated number of particles as a function of the radius from the center of mass of the network for several different experiments with a similar number of particles.
Fig. 7.
The density distribution, P(n), of the number of particles that are “upstream” of a given particle. The density distribution follows a power law for less than two orders of magnitude. This plot is for a typical steady-state network. Typical values obtained for the exponent range between -1.10 and -1.33, with little dependence on the total number of particles, N.
The three stages described above are for a typical formation of the network. It should be noted that deviations from this description depend on the initial state of the system. First, if many particles start sufficiently close to the boundary in the initial state, then it is possible that several networks form simultaneously, each competing for ungrounded particles to recruit into itself; the steady-state properties for these conditions are contained in refs. 15–17. Second, the time to complete stage I and stage III depends on three factors: (i) the number of particles in the dish, (ii) how diffuse the particles are in the initial state, and (iii) the geometry of the initial state. Having more particles, more diffuse initial states, and less symmetry decreases the distance of the particles from the boundary and therefore speeds up stage I because of shorter traveling distances and increased induced dipole interactions; these three effects set a lower limit (≈400) to the number of particles that will still produce a network from a centered, circular, and compact (all particles touching) initial state. Having less particles and more diffuse initial states decreases the time for stage III because it is easier to unfold as a network into empty space.
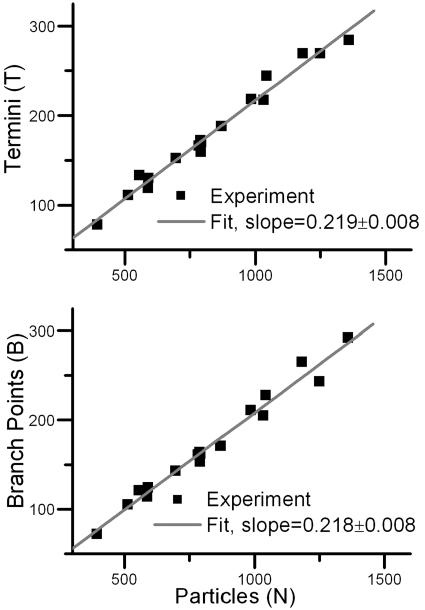
Successive experiments with similar initial conditions produce different networks; however, statistical features of the topology are robust. For example, the number of termini, T, and branching points, B, will be similar between experiments that have similar number of particles in the network, N; moreover, both T and B vary linearly with N. Fig. 8 shows a plot of T (Upper) and B (Lower) as a function of N.
Fig. 8.
The number of termini, T (Upper), and branching points, B (Lower), plotted against the number of particles in the network. Experiments were run with circular initial states, both diffuse and compact.
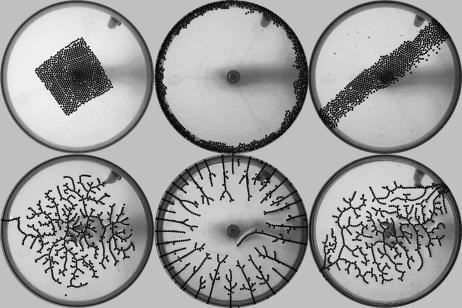
The geometry of the initial state can affect the topology of the network. Because the binding of particles to the boundary is strong, the network does not reconfigure easily; therefore, the way the particles are distributed during stage II largely determines how the particles connect to one another. This constraint sets the relative number of trunks, branches, and termini that the network forms. Fig. 9 shows how different initial states lead to different final networks.
Fig. 9.
Final networks (Lower) that emerge from different initial states (Upper).
In conclusion, we presented phenomenological results on an electromechanical system where stable ramified networks form. We described in detail the dynamical formation of the networks, including the three stages of growth: (I) strand formation, (II) boundary formation, and (III) geometric expansion. Each of these stages is characterized by their associated processes: strand formation by the cooperative movement of particles toward the outer boundary in the form of chains of particles, boundary formation by the rapid connecting of the particles to each other and the boundary, and geometric expansion by the particles filling the available space while maintaining the network topology. We found that despite the many physical factors that can affect growth of the network, the system is topologically robust across experiments with similar initial states; specifically, the statistical properties of each particle type are similar between experiments. If, however, the initial states are geometrically different, the topology of the final state can be radically different; this is in large part due to the rapid freezing of the network during stage II. More work is needed to determine how the time scale of the freezing affects the network topology.
We are aware of the many differences between our experiment and other more “real” complicated systems. Nevertheless, it is our view that it presents an intriguing controlled system unlike other physical ones in that here the flux of charge needs to remain constant after the steady state is reached, a feature more akin to biological systems than to other physical systems like crack propagation or dielectric breakdown where the flux is highly peaked in time. We also are aware of the special considerations due to the discreteness of constituents in the network. Our view on this point is that it allows us the leverage to describe the networks topologically while maintaining a spatial description as well. The combination of topological variation with spatial constraints has already garnered interest in the neurosciences (21, 22).
Supplementary Material
Acknowledgments
J.K.J. thanks C. Strelioff and G. L. Warner for useful discussions and comments on the manuscript. This work was supported by National Science Foundation Grants PHY 01-40179 and DMS 03-25939 ITR.
Author contributions: J.K.J. and A.H.H. designed research; and J.K.J. performed research, analyzed data, and wrote the paper.
This paper was submitted directly (Track II) to the PNAS office.
Footnotes
Gastner, M. T. & Newman, M. E. J. (2004) www.arxiv.org/abs/cond-mat/0407680 (abstr.).
References
- 1.Ball, P. (1999) The Self-Made Tapestry (Oxford Univ. Press, Oxford).
- 2.Swinney, H. L. (1996) in Critical Problems in Physics, eds. Fitch, V. L., Marlow, D. R. & Dementi, M. A. E. (Princeton Univ. Press, Princeton), pp. 51-74.
- 3.Witten, T. A. & Sander, L. M. (1981) Phys. Rev. Lett. 47, 1400-1403. [Google Scholar]
- 4.Niemeyer, L., Pietronero, L. & Wiesmann, H. J. (1984) Phys. Rev. Lett. 52, 1033-1036. [DOI] [PubMed] [Google Scholar]
- 5.Ben-Jacob, E. & Garik, P. (1990) Nature 343, 523-530. [Google Scholar]
- 6.Rinaldo, A., Rodriguez-Iturbe, I., Rigon, R., Ijjasz-Vasquez, E. & Bras, R. L. (1993) Phys. Rev. Lett. 70, 822-825. [DOI] [PubMed] [Google Scholar]
- 7.Matsushita, M. & Fukiwara, H. (1991) in Growth Patterns in Physical Sciences and Biology, eds. Garcia-Ruiz, J. M., Louis, E., Meakin, P. & Sander, L. M. (Plenum, New York), pp. 1-11.
- 8.Tsimring, L., Levine, H., Aranson, I., Ben-Jacob, E., Cohen, I., Shochet, O. & Reynolds, W. N. (1995) Phys. Rev. Lett. 75, 1859-1862. [DOI] [PubMed] [Google Scholar]
- 9.Ben-Jacob, E. (2003) Philos. Trans. R. Soc. London A 361, 1283-1312. [DOI] [PubMed] [Google Scholar]
- 10.Albert, R. & Barabási, A. L. (1995) Rev. Mod. Phys. 74, 47-97. [Google Scholar]
- 11.Yook, S. H., Jeong, H. & Barabási, A. L. (2002) Proc. Natl. Acad. Sci. USA 99, 13382-13386. [DOI] [PMC free article] [PubMed] [Google Scholar]
- 12.Toroczkai, Z. & Bassler, K. E. (2004) Nature 428, 716. [DOI] [PubMed] [Google Scholar]
- 13.West, G. B., Brown, J. H. & Enquist, B. J. (1997) Science 276, 122-126. [DOI] [PubMed] [Google Scholar]
- 14.Banavar, J. R., Maritan, A. & Rinaldo, A. (1999) Nature 399, 130-132. [DOI] [PubMed] [Google Scholar]
- 15.Merté, B., Gaitzsch, P., Fritzenwanger, M., Kropf, W., Hübler, A. & Lüscher, E. (1988) Helv. Phys. Acta 61, 76-79. [Google Scholar]
- 16.Hadwich, G., Merté, B., Hübler, A. & Lüscher, E. (1990) Helv. Phys. Acta 63, 487-488. [Google Scholar]
- 17.Dueweke, M. J. (1997) Ph.D. thesis (Univ. of Illinois at Urbana–Champaign, Urbana).
- 18.Marani, M., Banavar, J. R., Caldarelli, G., Maritan, A. & Rinaldo, A. (1998) J. Phys. A 31, L337-L343. [Google Scholar]
- 19.Caldarelli, G., Giacometti, A., Maritan, A., Rinaldo, A. & Rodriguez-Iturbe, I. (1997) Phys. Rev. E 55, R4865-R4868. [Google Scholar]
- 20.Caldarelli, G., Marchetti, R. & Pietronero, L. (2000) Europhys. Lett. 52, 386-391. [Google Scholar]
- 21.Ayali, A., Shefi, O. & Ben-Jacob, E. (2002) Neurocomputing 44–46, 635-643. [Google Scholar]
- 22.Klyachko, V. A. & Stevens, C. F. (2003) Neurocomputing 100, 7937-7941. [DOI] [PMC free article] [PubMed] [Google Scholar]
Associated Data
This section collects any data citations, data availability statements, or supplementary materials included in this article.


