

Abstract
Purpose
Epigenetic alterations measured in blood may help guide breast cancer treatment. The multisite prospective study TBCRC 005 was conducted to examine the ability of a novel panel of cell-free DNA methylation markers to predict survival outcomes in metastatic breast cancer (MBC) using a new quantitative multiplex assay (cMethDNA).
Patients and Methods
Ten genes were tested in duplicate serum samples from 141 women at baseline, at week 4, and at first restaging. A cumulative methylation index (CMI) was generated on the basis of six of the 10 genes tested. Methylation cut points were selected to maximize the log-rank statistic, and cross-validation was used to obtain unbiased point estimates. Logistic regression or Cox proportional hazard models were used to test associations between the CMI and progression-free survival (PFS), overall survival (OS), and disease status at first restaging. The added value of the CMI in predicting survival outcomes was evaluated and compared with circulating tumor cells (CellSearch).
Results
Median PFS and OS were significantly shorter in women with a high CMI (PFS, 2.1 months; OS, 12.3 months) versus a low CMI (PFS, 5.8 months; OS, 21.7 months). In multivariable models, among women with MBC, a high versus low CMI at week 4 was independently associated with worse PFS (hazard ratio, 1.79; 95% CI, 1.23 to 2.60; P = .002) and OS (hazard ratio, 1.75; 95% CI, 1.21 to 2.54; P = .003). An increase in the CMI from baseline to week 4 was associated with worse PFS (P < .001) and progressive disease at first restaging (P < .001). Week 4 CMI was a strong predictor of PFS, even in the presence of circulating tumor cells (P = .004).
Conclusion
Methylation of this gene panel is a strong predictor of survival outcomes in MBC and may have clinical usefulness in risk stratification and disease monitoring.
INTRODUCTION
Significant therapeutic advances in the field of breast cancer have resulted in a growing number of treatment options for patients with metastatic breast cancer (MBC), and prioritization of these agents can be challenging. In practice, many months are often needed to determine whether the selected treatment is effective, a decision usually guided by clinical findings and imaging studies. The identification of highly accurate circulating molecular markers in blood that allows earlier evaluation of therapeutic benefit could help significantly in clinical decision making, minimize morbidity from ineffective therapy, reduce costs from additional imaging studies, and improve clinical outcomes.1,2 The current generation of circulating markers offers some prognostic usefulness but these are not predictive for clinical benefit from individual therapies.3
Epigenetic alterations are among the most common molecular abnormalities in human cancers.4 DNA methylation does not change the genomic DNA sequence and is a form of epigenetic alteration that is heritable during DNA replication.5,6 Tumors commonly release aberrant DNA into the bloodstream, and this can now be detected. Our group developed a highly sensitive high-throughput quantitative multiplex methylation-specific polymerase chain reaction assay named cMethDNA to detect circulating cell-free methylated DNA.7 This assay builds on the prior assays we had used to detect methylation in tissue and in cytologic samples.8-11 A few clinical studies have since examined the association between the presence or absence of cell-free methylated DNA in peripheral blood and disease outcomes, but none have quantified the level of methylation.7,12-15 TBCRC 005 is the first biomarker study designed specifically to prospectively test as a primary end point the role of DNA methylation in blood in predicting disease progression and survival in breast cancer.
PATIENTS AND METHODS
Study Design
Eligible participants included female patients ≥ 18 years of age with histologically confirmed MBC and measurable disease and an Eastern Cooperative Oncology Group performance status of 0 to 2, who were starting a new systemic therapy and being treated at one of seven participating US academic medical centers. Measurable/evaluable disease was defined as a lesion ≥ 1 cm on computed tomography scan or magnetic resonance imaging or a superficial/palpable lesion ≥ 2 cm. Patients with a diagnosis of a second cancer in the previous 5 years were excluded, with the exception of those women with basal or squamous cell carcinoma of the skin and/or cervical carcinoma in situ. All patients provided written informed consent. The institutional review board at each study site approved this study.
The study schema is outlined in Appendix Figure A1 (online only). Blood was collected at baseline, at week 4, and at first restaging (which was at the discretion of the treating oncologist). At all three time points, serum samples were processed locally and stored at −80°C within 4 hours of collection. The samples were then batched and shipped to Johns Hopkins, where they were stored at −80°C. Whole blood for analysis of circulating tumor cells (CTCs) was collected at baseline and at week 4 and was sent to the Clinical Laboratory Improvement Amendments–certified Clinical Chemistry Research Laboratory at Johns Hopkins for processing within 72 hours of collection.
Methylation and CTC Assays
The cMethDNA assay was used to measure duplicate samples of a methylation panel from a previously published 10-gene panel in 300 μL of serum.7,16 In addition, a set of identical quality control pooled specimens from approximately 5% of the total samples was inserted into every batch to assess inter- and intrabatch reproducibility. All samples from one individual were run in the same batch to minimize bias from interassay variability. Individual gene methylation (M) was calculated as a methylation index (MI):
The MI of each sample was averaged across duplicates. The cumulative methylation index (CMI) is the sum of the MI for all genes. CTCs in 7.5 mL of whole blood were isolated and enumerated on the basis of the Janssen Diagnostic CellSearch System. Laboratory personnel were blinded to the ordering of samples and to all clinical information.
Statistical Analysis
Methylation data of each gene were log transformed after a small constant (0.1) was added to all values to account for zeros in the data. The inter- and intrabatch variation was evaluated using the coefficient of variation (CV) for all 10 genes and the CMI. Genes were selected for inclusion in the final analysis on the basis of CV, without reference to performance. Median progression-free survival (PFS) and overall survival (OS) with 95% CIs were estimated using the Kaplan-Meier method. Survival distributions were compared between patients with high and low CMIs at week 4 using the Gehan test, which gives more weight to early differences. Landmark analyses of PFS and OS were performed with the a priori defined time set at 4 weeks after treatment initiation. Patients who experienced disease progression or death before week 4 were excluded. Hazard ratios (HRs) and 95% CIs were estimated using the Cox proportional hazards models, controlling for age, ethnicity, prior therapy, phenotype, and disease burden. For classification of subjects into risk groups by CMI, a cut point was determined using an outcome-oriented approach for PFS and OS with a selection procedure that was based on the maximal log-rank statistic.17 A two-fold cross-validation approach18 was applied to confirm the significance of the cut point and to obtain almost unbiased estimates of the HR. The variability of the estimated HR using this approach was assessed by repeating the cross-validation 500 times with different choices of 1:1 random splits of the original data set.
Likelihood ratio tests were used in nested Cox models to assess the added value of each biomarker (CMI or CTCs at baseline or week 4) in predicting PFS and OS beyond established risk factors. The proportionality assumption was met by graphically assessing plots of log (−log [survival]) versus log of survival time. Because of the limited sample size, interaction terms (eg, potentially different effects of the biomarkers on outcomes by hormone receptor status) were examined using the Wald test but were not retained in the final models. The prognostic impact of the CMI according to each biologic subtype (hormone receptor and human epidermal growth factor receptor 2 status) was explored. Baseline and week 4 CMI, as well as change from baseline, were also evaluated as continuous markers with respect to outcomes. Disease status at first restaging was classified into one of three categories, progressive disease (PD), stable disease, or responsive disease (partial response/complete response) determined at approximately 8 to 12 weeks after the treatment started. The nonparametric Jonckheere-Terpstra trend test was used to assess whether week 4 CMI levels or reduction at week 4 from baseline differed among ordered disease status at first restaging. Association analyses of PD at first restaging (PD v non-PD) were performed using logistic regression.
All tests were two-sided and considered statistically significant at P < .05 and were performed using SAS 9.4 (SAS Institute, Cary, NC) and R version 3.1.0 (available at http://www.r-project.org).
RESULTS
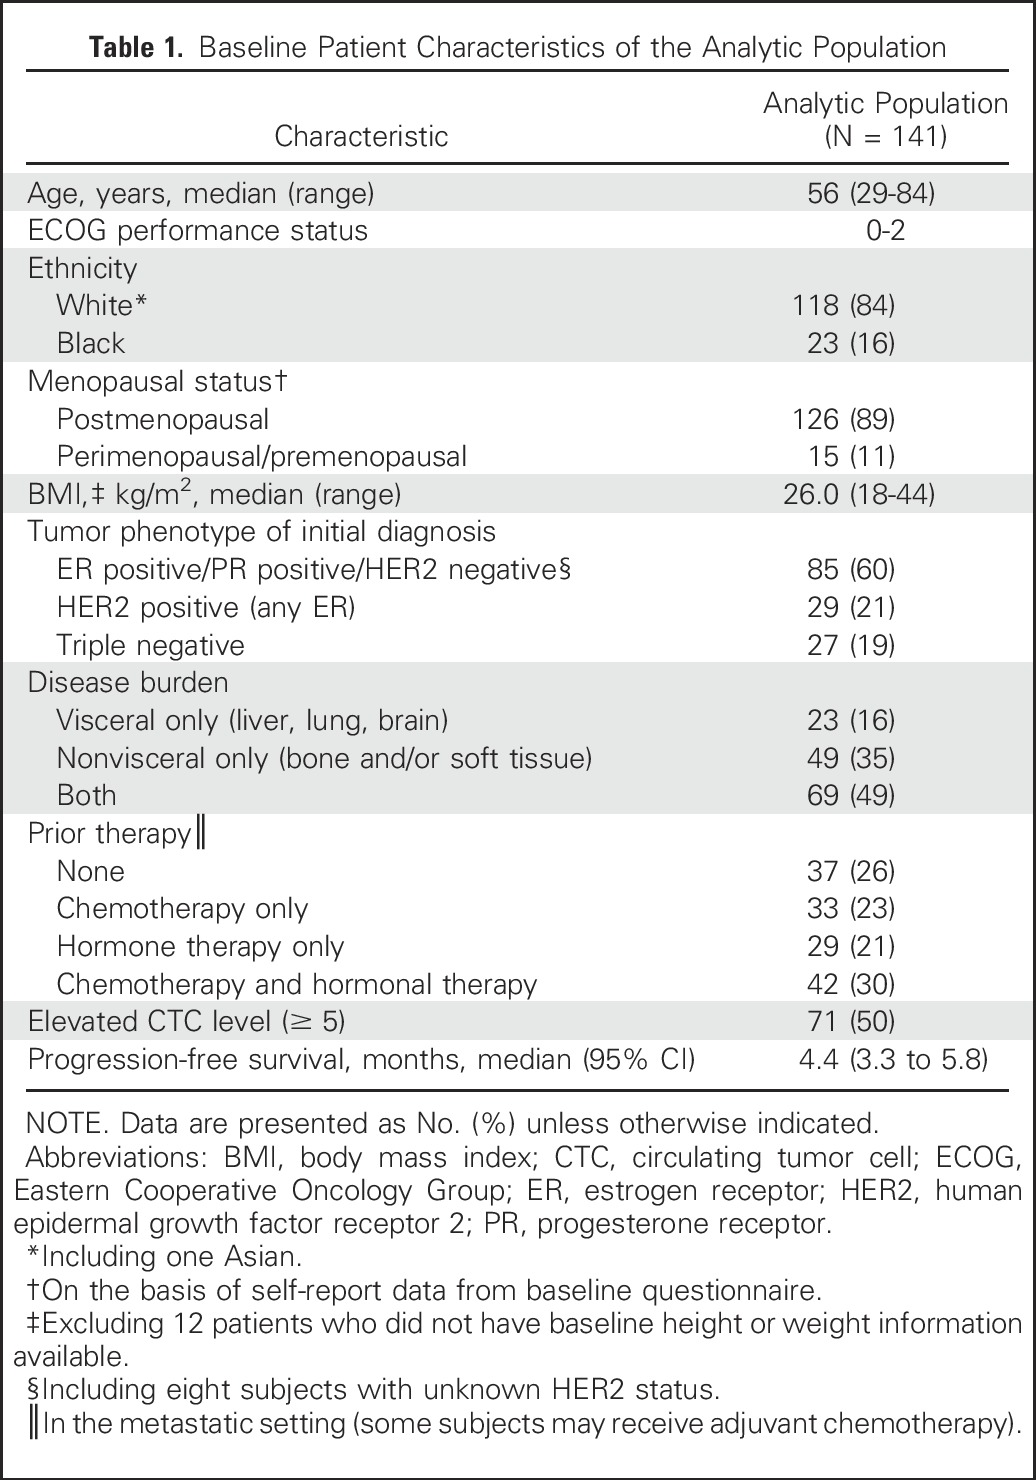
A total of 182 women were enrolled in the study. Serum samples from the first 33 patients (taken before the start of sample collection for the CTC assay) were used for analytical validation of the cMethDNA assay,7 leaving 149 women with available samples for this study. Of the 149 women, eight were excluded subsequently (Appendix Fig A2), resulting in an analytic population of 141. Table 1 describes the patient characteristics of our analytic population. Serum was available to evaluate the CMI in duplicates at two time points (at baseline and at week 4) in 129 women, and at a third time point for 112 of the 129 women. Information on CTCs was available at baseline and at week 4 for 96 women. Median follow-up for the cohort was 19.5 months (range, 0.8 to 86.3 months).
Table 1.
Baseline Patient Characteristics of the Analytic Population
The MI at baseline was calculated for all 10 genes (Appendix Fig A3), and the results were highly correlated with one another (Appendix Table A1, online only). Four of the genes (COL6A2, ARHGEF7, TMEFF2, and GXP7) were excluded from analyses because of CVs > 20%. The six genes included were AKR1B1, HOXB4, RASGRF2, RASSF1, HIST1H3C, and TM6SF1. The inter- and intrabatch CVs for any of the genes were < 18% (the majority having a CV < 10%), which is considered acceptable.19 The inter- and intrabatch CVs for the CMI of the six genes were < 2.5%.
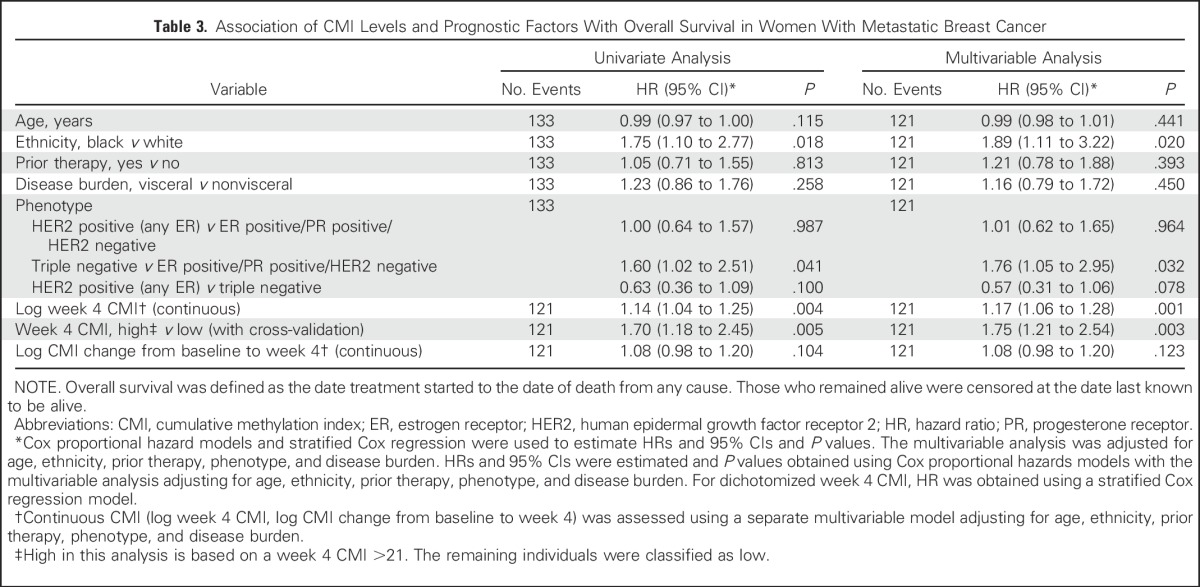
Landmark analyses were performed on the basis of week 4. A cut point of 9 for PFS and 21 for OS were the values selected for the week 4 CMI that maximized the log-rank statistic. One patient who had PD before the landmark time point was excluded. In the multivariable models described in Table 2, patients with a high CMI at week 4 had a significantly worse PFS (HR, 1.79; 95% CI, 1.23 to 2.60; P = .002) after adjusting for age, ethnicity, prior therapy, tumor phenotype, and disease burden. Similar results for OS (HR, 1.75; 95% CI, 1.21 to 2.54; P = .003) are illustrated in Table 3.
Table 2.
Association of CMI Levels and Prognostic Factors With Progression-Free Survival in Women with Metastatic Breast Cancer
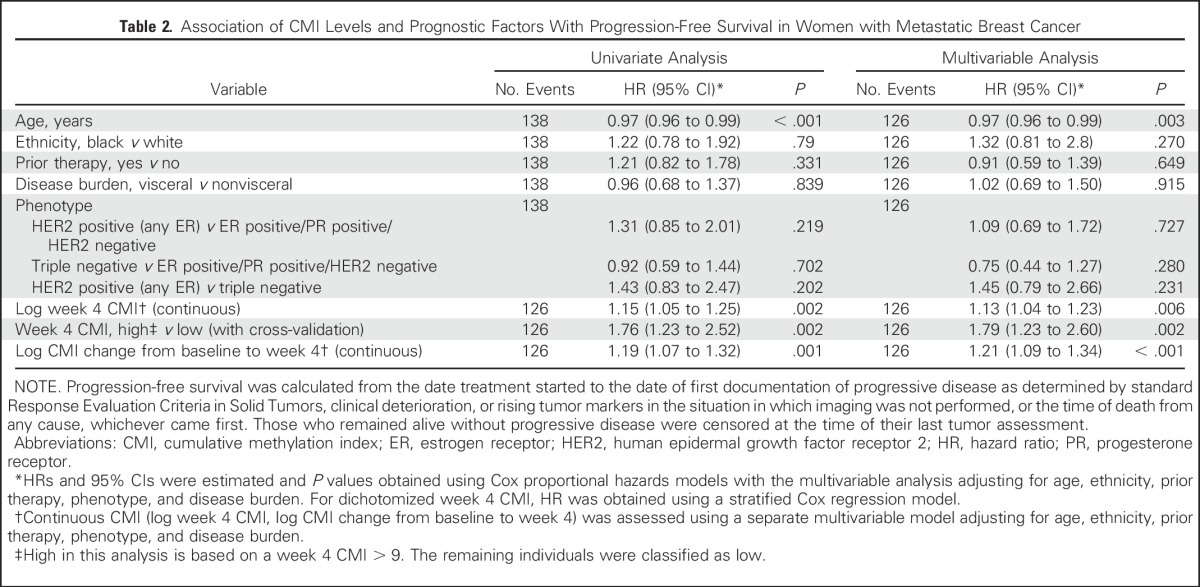
Table 3.
Association of CMI Levels and Prognostic Factors With Overall Survival in Women With Metastatic Breast Cancer
The median PFS among women in the high versus low CMI group was 2.1 months (95% CI, 1.7 to 3.2 months) versus 5.8 months (95%, CI 4.7 to 7.4 months), respectively (Fig 1A). The median OS was almost a year shorter for women in the high (12.3 months; 95% CI, 8.4 to 16.5 months) versus low (21.7 months; 95% CI, 19.3 to 28.3 months) CMI group (Fig 1B). Baseline CMI, modeled continuously, was not associated with PFS but was associated with OS in multivariate analyses (Appendix Fig A4). The prognostic effect of the week 4 CMI was consistent across different biologic subtypes; however, the sample size of some subtypes was small (Appendix Table A2). Sensitivity analyses for factors such as body mass index, study site, and the 10-gene panel did not alter the observed estimates. To evaluate the robustness of the two-fold cross-validation approach, we repeated the two-fold cross-validation procedure 500 times to allow for different choices of the 1:1 random split of the original data set and calculated the corresponding HR. The mean HR for PFS was 1.95 (variance, 0.048), and the mean HR for OS was 1.87 (variance, 0.023), which is considered stable and within the range of our original results.
Fig 1.

Kaplan-Meier curves of (A) progression-free survival and (B) overall survival by CMI at week 4 for women with metastatic breast cancer. Landmark analysis at week 4 excluded patients encountering events before blood draw at week 4. A horizontal line indicates median survival times. Gehan tests were stratified by subset resulting from random split of the data with the two-fold cross-validation. CMI, cumulative methylation index; HR, hazard ratio.
The association between CMI levels at baseline, at week 4, and at first restaging and disease status as early as first restaging, which was most often at week 12, was also examined. Figure 2A illustrates the distributions of log CMI levels at baseline, at week 4, and at first restaging by disease status. A significant trend was observed between an increasing CMI at week 4 and less responsive disease at first restaging (P for trend < .001, Jonckheere-Terpstra test). The median CMI at week 4 was highest in women with PD, lowest in women with responsive disease (partial response/complete response), and intermediate in women with stable disease at first restaging.
Fig 2.

Association of disease status at first restaging with (A) CMI and (B) CTCs across three time points. The length of the box is the interquartile range and represents the middle 50% of the data. The horizontal line inside the box shows the median. The lower and upper edges of the box represent the 25th and 75th percentiles, respectively. The vertical dashed lines extend from the box to the upper and lower 1.5 interquartile values from the upper and lower edges. Jonckheere-Terpstra test for trend in change from baseline among ordered disease status at first restaging. *Significant difference (P < .001) at the given time point compared with baseline using Wilcoxon signed rank test. Natural log transformed CMI and CTC data were graphed and the y-axes were formatted with back-transformation values. CMI, cumulative methylation index; CTCs, circulating tumor cells; PD, progressive disease; PR/CR, partial response/complete response; SD, stable disease.
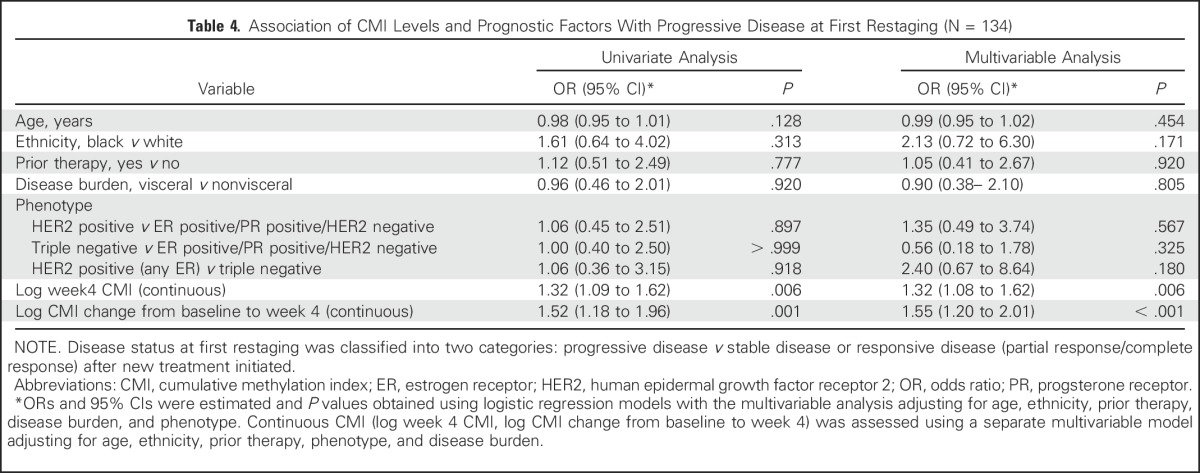
Next, the effect on disease status of a change in CMI levels from baseline to week 4 was examined. Women with responsive (P < .001) or stable (P < .001) disease were more likely to have a reduction in median levels of the CMI from baseline to week 4 (Fig 2A). As illustrated in Tables 2 and 4, a change in log CMI from baseline to week 4 was associated with worse PFS (HR, 1.21; 95% CI, 1.09 to 1.34; P < .001) and PD at first restaging (OR, 1.55; 95% CI, 1.20 to 2.01; P < .001). When a change in the CMI was modeled as a binary variable in multivariable analyses, an increase in the CMI at week 4 was associated with a worse PFS (HR, 2.18; 95% CI, 1.40 to 3.41; P < .001) and a 4.6-fold increase in the risk of PD at first restaging (OR, 4.58; 95% CI, 1.82 to 11.60; P = .001) compared with a reduction or no change in the CMI. In either case, adjusting for the baseline CMI did not alter the point estimates.
Table 4.
Association of CMI Levels and Prognostic Factors With Progressive Disease at First Restaging (N = 134)
In this study, we were also able to evaluate CTCs at baseline and at week 4 in 96 women. The distribution of CTC values is illustrated in Appendix Figure A5. As was the case with the CMI, week 4 CTCs ≥ 5 cells/7.5 mL were significantly associated with worse PFS (HR, 1.46; 95% CI, 1.02 to 2.10; P = .04) and OS (HR, 2.24; 95% CI, 1.54 to 3.26; P < .001). The median OS for ≥ 5 cells/7.5 mL was 8.1 months (95% CI, 4.9 to 18.8 months) and 20.8 months (95% CI, 17.5 to 26.6 months) for < 5 cells/7.5 mL. As was the case with the CMI, CTCs at week 4 were reduced in women with responsive disease (P = .0001; Fig 2B). However, in contrast to CMI, CTC levels were not significantly different by disease status at first restaging (P for trend = .457; Fig 2B). The CMI was more sensitive (78%) in identifying high-risk (progressive) disease than were CTCs (30%). A change in CTCs modeled either as a continuous marker (Appendix Fig A6) or as a binary marker (increase or reduction v no change from baseline; OR, 2.23; 95% CI, 0.77 to 2.47) was not significantly associated with PD at first restaging in multivariable analyses.
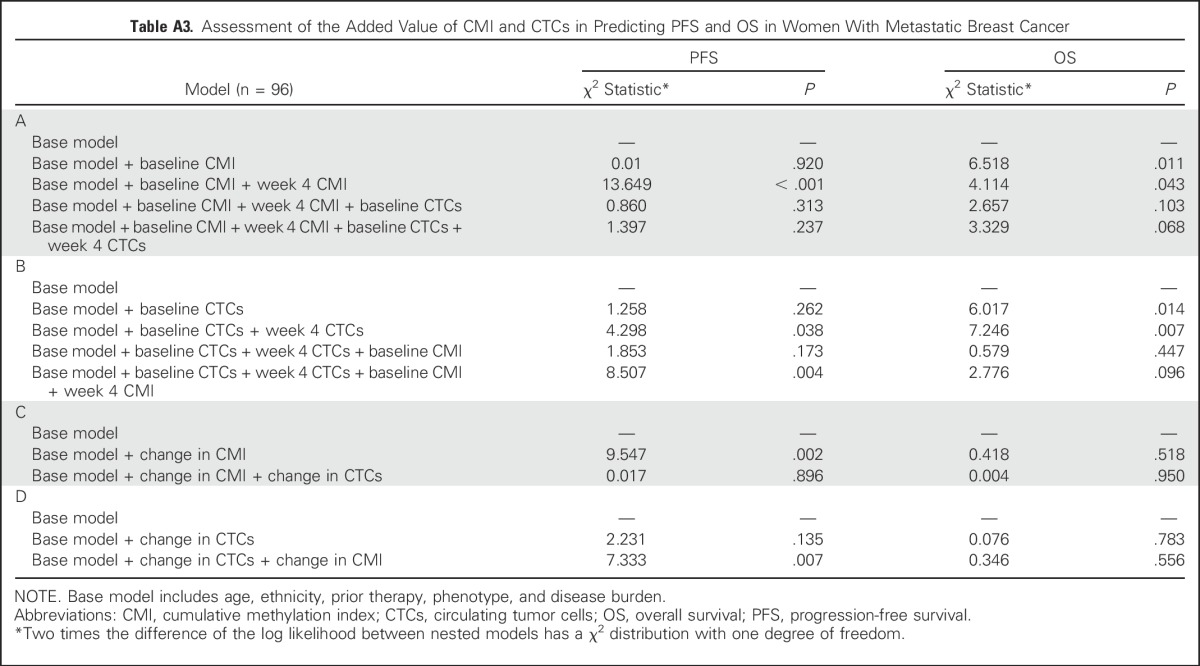
Finally, as an exploratory analysis, we examined the prognostic significance of the CMI and CTCs in 96 women in whom both markers had been measured (Appendix Table A3). Likelihood ratio tests suggest that the addition of either the week 4 CMI or CTCs significantly improved the ability of a model of established risk factors to predict PFS (P < .001and P = .038 for the CMI and CTCs, respectively) and OS (P = .043 and P = .007 for the CMI and CTCs, respectively). Furthermore, the CMI at week 4 seemed to be a significant predictor of PFS and improved the prediction of the base model even in the presence of CTCs (P = .004). In separate models, a change in the CMI in the base model improved PFS (P = .002), but a change in CTC level did not. The improvement with the change in the CMI occurred even in the presence of CTCs (P = .007). The addition of a change in CTC level or in the CMI did not significantly improve the model fit for OS.
DISCUSSION
To our knowledge, this is the first study to demonstrate the promise of early changes in the level of circulating cell-free tumor-specific DNA methylation for clinical application in patients with MBC. Our results suggest that CMI levels of a novel six-gene panel measured 4 weeks after the initiation of a new therapy and a novel quantitative assay known as cMethDNA have clinical usefulness as a predictor of survival outcomes in women with MBC. A high CMI level at week 4 was consistently associated with PFS and OS, as well as PD, as early as first restaging. Furthermore, a change in the CMI within 4 weeks of initiating therapy tracked with PFS and disease response as early as first restaging, supporting the potential prognostic usefulness of measuring CMI levels within weeks of initiating a new therapy. Last, both the CMI at week 4 and a change in the CMI added to the ability of established risk factors, including CTCs, to predict PFS.
The six-gene panel examined in this study is based on the results of a DNA methylation array conducted in breast tumors and sera for patients with both estrogen receptor–positive and estrogen receptor–negative breast cancer.7 Five of the six genes in the six-gene panel were identified by our group as methylated in breast cancer.7 Two genes with some degree of commonality in function were RASGRF1, a RAS guanosine triphosphate hydrolase with nucleotide exchange function,20 and RASSF1, a methylation marker common to many cancers that encodes a protein similar to RAS effector proteins.21 Among the four other novel genes, HIST1H3C interacts with linker DNA between nucleosomes and functions in the compaction of chromatin into higher-order structures,22 the AKR1B1 gene encodes a member of the aldo/keto reductase superfamily and catalyzes the reduction of a number of aldehydes,23 and HOXB4 encodes a transcription factor involved in development and, as with many members of the HOX gene family, is regulated by methylation of dense C-phosphate-G islands.24 There is no literature regarding the function of the newly discovered TM6SF1.7 The cMethDNA assay can measure methylation levels in gene loci coamplified from one 300-µL aliquot of serum. The cMethDNA assay is calibrated against a low fixed physiologic level of recombinant gene-specific reference DNA that is copurified and coamplified with target methylated DNA.7
A few other studies have evaluated the relationship between cell-free tumor DNA in plasma and serum and disease outcome in patients with breast cancer.12-15,25-28 Those studies did not quantify the level of methylation either as a categorical or as a continuous measure, as we report in this article. Most of the studies were based in a single institution, measured a limited number of candidate genes at a single time point, had a small sample size, included limited clinical information, and were not prospective.
In our comparison of the CMI with CTCs, a clinically available biomarker for risk stratification in patients with breast cancer, the CMI and CTCs at week 4 seem to be complementary as prognostic markers, but both the CMI and a change in the CMI were stronger predictors of PFS when contrasted directly with CTCs.29,30 When predicting treatment response at first restaging, CTCs were more specific (85%) in identifying low-risk (stable or responsive) disease compared with the CMI (51%), whereas the CMI was more sensitive (78%) in identifying high-risk (progressive) disease than were CTCs (30%). Of interest, numeric changes in CTC level between baseline and week 4 were not associated with treatment response. Women with a high CTC level at both baseline and week 4 compared with those with a low CTC level had a worse PFS and OS; this finding is consistent with a recent clinical trial in MBC in which change in treatment guided by CTCs did not influence disease outcome.30 Although monitoring for the change in the CMI for treatment response has prognostic usefulness, its clinical usefulness in influencing changes in therapy must now be evaluated formally in randomized clinical trials. Furthermore, whether there is meaningful risk reclassification of patients with the addition of the CMI is worth careful assessment in future larger validation studies.
To our knowledge, this is the first prospective study to demonstrate the potential clinical usefulness of measures of serum methylation to inform clinical care in breast cancer. The CMI of a panel of six genes and change in CMI levels were independent predictors of survival outcomes. Limitations of the study include the lack of central adjudication for outcomes such as PD, although these results seem to align with death, a less subjective outcome. Other limitations include the lack of blood samples before week 4 and the modest sample size. Our findings must be validated to determine the clinical usefulness of the cMethDNA assay for specific treatments and tumor phenotypes in patients with metastatic disease and early-stage breast cancer.
Appendix
Fig A1.

TBCRC-005 study schema. For this study, we had duplicate serum samples from 141 women at baseline. In addition, for 129 of the 141 women, we had duplicate measures at a second time point, and for 112 of the 129 women, duplicate measures at a third time point.
Fig A2.

Flow chart describing study population. Patients were enrolled from the following seven cancer centers: Johns Hopkins Sidney Kimmel Cancer Center, Baltimore, MD; University of Alabama at Birmingham, Birmingham, AL; Indiana University, Bloomington, IN; University of Chicago, Chicago, IL; Dana-Farber Cancer Institute, Boston, MA; University of North Carolina, Chapel Hill, NC; and Mayo Clinic, Rochester, MN. QCs, quality control samples.
Fig A3.

Scatter plot summarizing the MI for each of the 10 genes evaluated. MI = [(No. methylated copies)/(No. methylated + gene standard copies)] × 100. MI for each sample was averaged across duplicates. MI, methylation index.
Fig A4.

Forest plot of the association of CMI and CTCs as a continuous marker with both PFS and OS. Baseline and week 4 CTCs and CMI modeled as a continuous marker and both PFS and OS. All markers were treated as continuous variables and log transformed. The bars represent 95% CIs. The size of the box is indicative of the precision of the point estimate. CMI, cumulative methylation index; CTCs, circulating tumor cells; HR, hazard ratio; LCL, lower confidence limit; OS, overall survival; PFS, progression-free survival; UCL, upper confidence limit.
Fig A5.

Baseline and week 4 distributions of CTCs. CTCs, circulating tumor cells.
Fig A6.

Forest plot of the association of CMI and CTCs as a continuous marker with disease status at first restaging. All markers were treated as continuous variables and were log transformed. The bars represent 95% CIs. The size of the box is indicative of precision of the point estimate. CMI, cumulative methylation index; CTCs, circulating tumor cells; LCL, lower confidence limit; OR, odds ratio; UCL, upper confidence limit.
Table A1.
Correlation Among Baseline Methylation of All 10 Genes With Each Other
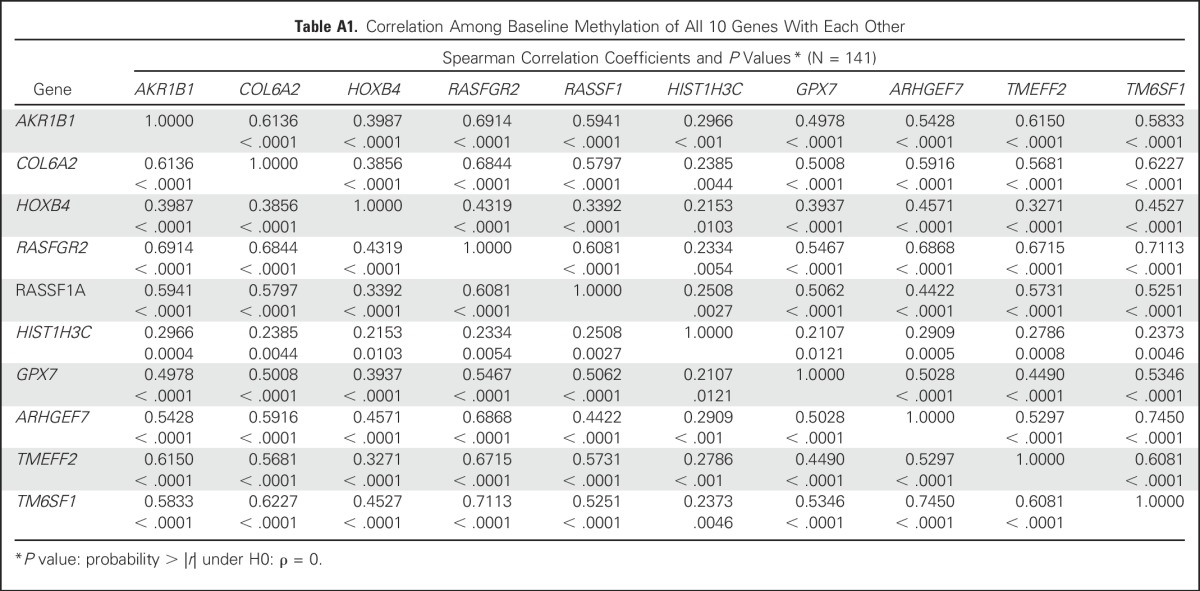
Table A2.
Association of Week 4 CMI by Hormone Receptor and HER2 Status in Univariate Analysis
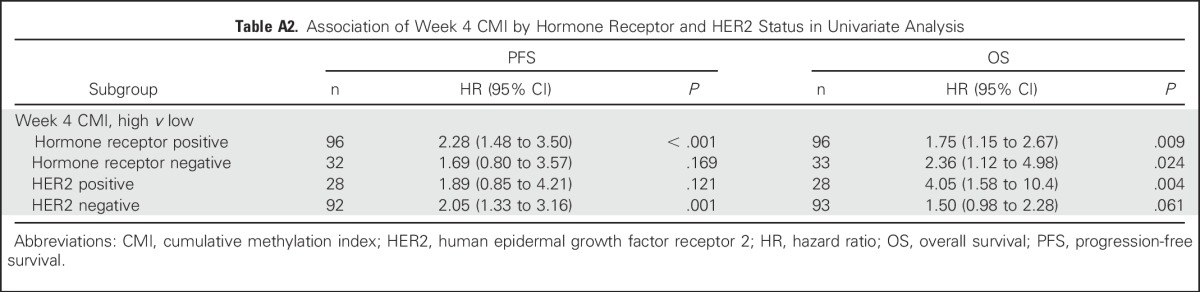
Table A3.
Assessment of the Added Value of CMI and CTCs in Predicting PFS and OS in Women With Metastatic Breast Cancer
Footnotes
Written on behalf of the Translational Breast Cancer Research Consortium.
Supported by the Avon Foundation for Women, the Breast Cancer Research Foundation, Janssen Diagnostics, the Rubenstein Family Fund, the Susan G. Komen Foundation, National Institutes of Health Grants No. NIHP30CA006973 and NIHP30CA58223, and the Susan G. Komen Leadership Grant SAC110053 (A.C.W.).
Presented in part at the ASCO Annual Meeting, May 29-June 2, 2015.
See accompanying article on page 793
AUTHOR CONTRIBUTIONS
Conception and design: Kala Visvanathan, MaryJo S. Fackler, Zhe Zhang, Elizabeth Garrett-Mayer, Saraswati Sukumar, Antonio C. Wolff
Financial support: Lisa A. Carey, Antonio C. Wolff
Administrative support: Stacie C. Jeter, Antonio C. Wolff
Provision of study materials or patients: Kala Visvanathan, MaryJo S. Fackler, Stacie C. Jeter, Andres Forero, Anna M. Storniolo, Rita Nanda, Nancy U. Lin, Lisa A. Carey, James N. Ingle, Antonio C. Wolff
Collection and assembly of data: Kala Visvanathan, MaryJo S. Fackler, Zhe Zhang, Zoila A. Lopez-Bujanda, Stacie C. Jeter, Lori J. Sokoll, Andres Forero, Anna M. Storniolo, Rita Nanda, Nancy U. Lin, Lisa A. Carey, James N. Ingle, Saraswati Sukumar, Antonio C. Wolff
Data analysis and interpretation: Kala Visvanathan, MaryJo S. Fackler, Zhe Zhang, Lori J. Sokoll, Elizabeth Garrett-Mayer, Leslie M. Cope, Christopher B. Umbricht, David M. Euhus, Saraswati Sukumar, Antonio C. Wolff
Manuscript writing: All authors
Final approval of manuscript: All authors
AUTHORS' DISCLOSURES OF POTENTIAL CONFLICTS OF INTEREST
Monitoring of Serum DNA Methylation as an Early Independent Marker of Response and Survival in Metastatic Breast Cancer: TBCRC 005 Prospective Biomarker Study
The following represents disclosure information provided by authors of this manuscript. All relationships are considered compensated. Relationships are self-held unless noted. I = Immediate Family Member, Inst = My Institution. Relationships may not relate to the subject matter of this manuscript. For more information about ASCO's conflict of interest policy, please refer to www.asco.org/rwc or ascopubs.org/jco/site/ifc.
Kala Visvanathan
Patents, Royalties, Other Intellectual Property: Inventor on one or more patents applied for on issues relating to methylation and cancer in the past 2 years and has assigned her rights to her institution, and participates in a royalty-sharing agreement with her institution
MaryJo S. Fackler
Consulting or Advisory Role: Myriad Genetics (I), Cepheid
Research Funding: Cepheid
Patents, Royalties, Other Intellectual Property: Inventor on one or more patents applied for on issues relating to methylation and cancer in the past 2 years and has assigned her rights to her institution, and participates in a royalty-sharing agreement with her institution
Travel, Accommodations, Expenses: Medtronic (I)
Zhe Zhang
Research Funding: Avon Foundation for Women (Inst)
Patents, Royalties, Other Intellectual Property: Inventor on one or more patents applied for on issues relating to methylation and cancer in the past 2 years and has assigned her rights to her institution, and participates in a royalty-sharing agreement with her institution
Zoila A. Lopez-Bujanda
Patents, Royalties, Other Intellectual Property: Inventor on one or more patents applied for on issues relating to methylation and cancer in the past 2 years and has assigned her rights to her institution, and participates in a royalty-sharing agreement with her institution
Stacie C. Jeter
No relationship to disclose
Lori J. Sokoll
Research Funding: Janssen Diagnostics (Veridex) (Inst)
Elizabeth Garrett-Mayer
Stock or Other Ownership: Abbott Laboratories, Abbvie
Consulting or Advisory Role: Tactical Therapeutics, Okava Pharmaceuticals
Research Funding: Genentech (Inst)
Leslie M. Cope
Patents, Royalties, Other Intellectual Property: MDxHealth; Inventor on one or more patents applied for on issues relating to methylation and cancer in the past 2 years and has assigned his rights to his institution, and participates in a royalty-sharing agreement with his institution
Christopher B. Umbricht
Patents, Royalties, Other Intellectual Property: Inventor on one or more patents applied for on issues relating to methylation and cancer in the past 2 years and has assigned his rights to his institution, and participates in a royalty-sharing agreement with his institution
David M. Euhus
No relationship to disclose
Andres Forero
No relationship to disclose
Anna M. Storniolo
Consulting or Advisory Role: Eli Lilly, Novartis/Pfizer
Rita Nanda
No relationship to disclose
Nancy U. Lin
Consulting or Advisory Role: Shionogi Pharma
Research Funding: Genentech, GlaxoSmithKline, Novartis, Array BioPharma, Kadmon
Lisa A. Carey
Research Funding: GlaxoSmithKline, Genentech
James N. Ingle
No relationship to disclose
Saraswati Sukumar
Research Funding: Cepheid
Patents, Royalties, Other Intellectual Property: Inventor on one or more patents applied for on issues relating to methylation and cancer in the past 2 years and has assigned her rights to her institution, and participates in a royalty-sharing agreement with her institution
Antonio C. Wolff
Research Funding: Myriad Genetics
Patents, Royalties, Other Intellectual Property: Inventor on one or more patents applied for on issues relating to methylation and cancer in the past 2 years and has assigned his rights to his institution, and participates in a royalty-sharing agreement with his institution
REFERENCES
- 1.Tie J, Kinde I, Wang Y, et al. Circulating tumor DNA as an early marker of therapeutic response in patients with metastatic colorectal cancer. Ann Oncol. 2015;26:1715–1722. doi: 10.1093/annonc/mdv177. [DOI] [PMC free article] [PubMed] [Google Scholar]
- 2.Smerage JB, Hayes DF. The measurement and therapeutic implications of circulating tumour cells in breast cancer. Br J Cancer. 2006;94:8–12. doi: 10.1038/sj.bjc.6602871. [DOI] [PMC free article] [PubMed] [Google Scholar]
- 3.Van Poznak C, Somerfield MR, Bast RC, et al. Use of biomarkers to guide decisions on systemic therapy for women with metastatic breast cancer: American Society of Clinical Oncology clinical practice guideline. J Clin Oncol. 2015;33:2695–2704. doi: 10.1200/JCO.2015.61.1459. [DOI] [PMC free article] [PubMed] [Google Scholar]
- 4.Egger G, Liang G, Aparicio A, et al. Epigenetics in human disease and prospects for epigenetic therapy. Nature. 2004;429:457–463. doi: 10.1038/nature02625. [DOI] [PubMed] [Google Scholar]
- 5.Baylin S. DNA methylation and epigenetic mechanisms of carcinogenesis. Dev Biol (Basel) 2001;106:85–87, discussion 143-160. [PubMed] [Google Scholar]
- 6.Jones PA. DNA methylation and cancer. Oncogene. 2002;21:5358–5360. doi: 10.1038/sj.onc.1205597. [DOI] [PubMed] [Google Scholar]
- 7.Fackler MJ, Lopez Bujanda Z, Umbricht C, et al. Novel methylated biomarkers and a robust assay to detect circulating tumor DNA in metastatic breast cancer. Cancer Res. 2014;74:2160–2170. doi: 10.1158/0008-5472.CAN-13-3392. [DOI] [PMC free article] [PubMed] [Google Scholar]
- 8.Evron E, Dooley WC, Umbricht CB, et al. Detection of breast cancer cells in ductal lavage fluid by methylation-specific PCR. Lancet. 2001;357:1335–1336. doi: 10.1016/s0140-6736(00)04501-3. [DOI] [PubMed] [Google Scholar]
- 9.Fackler MJ, Malone K, Zhang Z, et al. Quantitative multiplex methylation-specific PCR analysis doubles detection of tumor cells in breast ductal fluid. Clin Cancer Res. 2006;12:3306–3310. doi: 10.1158/1078-0432.CCR-05-2733. [DOI] [PubMed] [Google Scholar]
- 10.Fackler MJ, McVeigh M, Mehrotra J, et al. Quantitative multiplex methylation-specific PCR assay for the detection of promoter hypermethylation in multiple genes in breast cancer. Cancer Res. 2004;64:4442–4452. doi: 10.1158/0008-5472.CAN-03-3341. [DOI] [PubMed] [Google Scholar]
- 11.Fackler MJ, Rivers A, Teo WW, et al. Hypermethylated genes as biomarkers of cancer in women with pathologic nipple discharge. Clin Cancer Res. 2009;15:3802–3811. doi: 10.1158/1078-0432.CCR-08-1981. [DOI] [PubMed] [Google Scholar]
- 12.Fiegl H, Millinger S, Mueller-Holzner E, et al. Circulating tumor-specific DNA: A marker for monitoring efficacy of adjuvant therapy in cancer patients. Cancer Res. 2005;65:1141–1145. doi: 10.1158/0008-5472.CAN-04-2438. [DOI] [PubMed] [Google Scholar]
- 13.Chimonidou M, Tzitzira A, Strati A, et al. CST6 promoter methylation in circulating cell-free DNA of breast cancer patients. Clin Biochem. 2013;46:235–240. doi: 10.1016/j.clinbiochem.2012.09.015. [DOI] [PubMed] [Google Scholar]
- 14.Fujita N, Kagara N, Yamamoto N, et al. Methylated DNA and high total DNA levels in the serum of patients with breast cancer following neoadjuvant chemotherapy are predictive of a poor prognosis. Oncol Lett. 2014;8:397–403. doi: 10.3892/ol.2014.2068. [DOI] [PMC free article] [PubMed] [Google Scholar]
- 15.Göbel G, Auer D, Gaugg I, et al. Prognostic significance of methylated RASSF1A and PITX2 genes in blood- and bone marrow plasma of breast cancer patients. Breast Cancer Res Treat. 2011;130:109–117. doi: 10.1007/s10549-010-1335-8. [DOI] [PubMed] [Google Scholar]
- 16.Fackler MJ, Umbricht CB, Williams D, et al. Genome-wide methylation analysis identifies genes specific to breast cancer hormone receptor status and risk of recurrence. Cancer Res. 2011;71:6195–6207. doi: 10.1158/0008-5472.CAN-11-1630. [DOI] [PMC free article] [PubMed] [Google Scholar]
- 17.Contal C, O’Quigley J. An application of changepoint methods in studying the effect of age on survival in breast cancer. Comput Stat Data Anal. 1999;30:253–270. [Google Scholar]
- 18.Faraggi D, Simon R. A simulation study of cross-validation for selecting an optimal cutpoint in univariate survival analysis. Stat Med. 1996;15:2203–2213. doi: 10.1002/(SICI)1097-0258(19961030)15:20<2203::AID-SIM357>3.0.CO;2-G. [DOI] [PubMed] [Google Scholar]
- 19.Tworoger SS, Hankinson SE. Use of biomarkers in epidemiologic studies: Minimizing the influence of measurement error in the study design and analysis. Cancer Causes Control. 2006;17:889–899. doi: 10.1007/s10552-006-0035-5. [DOI] [PubMed] [Google Scholar]
- 20.Freedman TS, Sondermann H, Friedland GD, et al. A Ras-induced conformational switch in the Ras activator Son of sevenless. Proc Natl Acad Sci USA. 2006;103:16692–16697. doi: 10.1073/pnas.0608127103. [DOI] [PMC free article] [PubMed] [Google Scholar]
- 21.Gordon M, Baksh S. RASSF1A: Not a prototypical Ras effector. Small GTPases. 2011;2:148–157. doi: 10.4161/sgtp.2.3.16286. [DOI] [PMC free article] [PubMed] [Google Scholar]
- 22.MacAlpine DM, Almouzni G. Chromatin and DNA replication. Cold Spring Harb Perspect Biol. 2013;5:a010207. doi: 10.1101/cshperspect.a010207. [DOI] [PMC free article] [PubMed] [Google Scholar]
- 23.Watanabe K. Recent reports about enzymes related to the synthesis of prostaglandin (PG) F(2) (PGF(2α) and 9α, 11β-PGF(2)) J Biochem. 2011;150:593–596. doi: 10.1093/jb/mvr116. [DOI] [PubMed] [Google Scholar]
- 24.Lin SH, Wang J, Saintigny P, et al. Genes suppressed by DNA methylation in non-small cell lung cancer reveal the epigenetics of epithelial-mesenchymal transition. BMC Genomics. 2014;15:1079. doi: 10.1186/1471-2164-15-1079. [DOI] [PMC free article] [PubMed] [Google Scholar]
- 25.Avraham A, Uhlmann R, Shperber A, et al. Serum DNA methylation for monitoring response to neoadjuvant chemotherapy in breast cancer patients. Int J Cancer. 2012;131:E1166–E1172. doi: 10.1002/ijc.27526. [DOI] [PMC free article] [PubMed] [Google Scholar]
- 26.Van der Auwera I, Elst HJ, Van Laere SJ, et al. The presence of circulating total DNA and methylated genes is associated with circulating tumour cells in blood from breast cancer patients. Br J Cancer. 2009;100:1277–1286. doi: 10.1038/sj.bjc.6605013. [DOI] [PMC free article] [PubMed] [Google Scholar]
- 27.Ahmed SA, Hamed MA, Omar OS. Clinical utility of certain biomarkers as predictors of breast cancer with or without metastasis among Egyptian females. Tumour Biol. 2015;36:815–822. doi: 10.1007/s13277-014-2689-z. [DOI] [PubMed] [Google Scholar]
- 28.Dawson SJ, Rosenfeld N, Caldas C. Circulating tumor DNA to monitor metastatic breast cancer. N Engl J Med. 2013;369:93–94. doi: 10.1056/NEJMc1306040. [DOI] [PubMed] [Google Scholar]
- 29.Cristofanilli M, Budd GT, Ellis MJ, et al. Circulating tumor cells, disease progression, and survival in metastatic breast cancer. N Engl J Med. 2004;351:781–791. doi: 10.1056/NEJMoa040766. [DOI] [PubMed] [Google Scholar]
- 30.Smerage JB, Barlow WE, Hortobagyi GN, et al. Circulating tumor cells and response to chemotherapy in metastatic breast cancer: SWOG S0500. J Clin Oncol. 2014;32:3483–3489. doi: 10.1200/JCO.2014.56.2561. [DOI] [PMC free article] [PubMed] [Google Scholar]