Abstract
A strand-specific DNA sensory method is described based on surface-bound peptide nucleic acids and water-soluble cationic conjugated polymers. The main transduction mechanism operates by taking advantage of the net increase in negative charge at the peptide nucleic acid surface that occurs upon single-stranded DNA hybridization. Electrostatic forces cause the oppositely charged cationic conjugated polymer to bind selectively to the “complementary” surfaces. This approach circumvents the current need to label the probe or target strands. The polymer used in these assays is poly[9,9′-bis(6′′-N,N,N-trimethylammonium)hexyl)fluorene-co-alt-4,7-(2,1,3-benzothiadiazole) dibromide], which was specifically designed and synthesized to be compatible with excitation sources used in commonly used DNA microarray readers. Furthermore, the utility of poly[9,9′-bis(6′′-N,N,N-trimethylammonium)-hexyl)fluorene-co-alt-4,7-(2,1,3-benzothiadiazole) dibromide] has been demonstrated in homogenous and solid-state assays that involve fluorescence resonance energy transfer to a reporter dye (Cy5) and that can benefit from the light harvesting properties observed in water-soluble conjugated polymers.
Keywords: peptide nucleic acid probe, polyelectrolytes, fluorescence energy transfer
Methods for the detection of nucleic acids are highly significant in identifying specific target and in understanding their basic function. Hybridization probe technologies continue to be one of the most essential elements in the study of gene-related biomolecules (1–3). They are useful for a variety of commercial and scientific applications, including the identification of genetic mutations or single-nucleotide polymorphisms (SNPs), medical diagnostics, gene delivery, assessment of gene expression, and drug discovery (4–9). Heterogeneous formats for performing such hybridization probe assays have become increasingly common and powerful with the advancement of gene chip and DNA microarray technologies (10–13). Such systems allow for high-throughput screening of hundreds to thousands of genes in a single experiment.
Homogeneous DNA assays with increased sensitivity, relative to small molecular counterparts, have recently appeared that take advantage of the optical amplification afforded by conjugated polymers (14–17). The emission intensities of acceptor chromophores on hybridization probes are magnified, relative to direct excitation, when the absorption coefficient of the polymer is large and the fluorescence resonance energy transfer (FRET) from the polymer to the acceptor is efficient (18). Conjugated polymers offer other transduction mechanisms, for instance, their optical properties can be modified upon complexation with dsDNA or ssDNA (19–22).
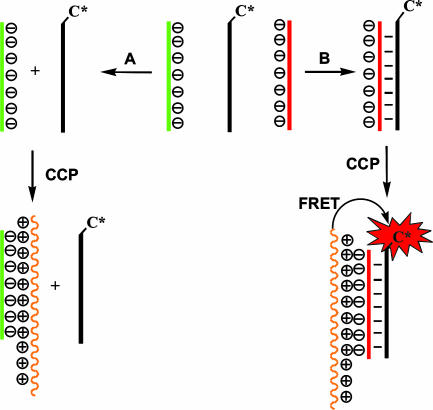
One successful DNA-sensing method involves the use of labeled peptide nucleic acids (PNAs) and cationic conjugated polymers (CCPs). The assay, shown in Scheme 1, takes advantage of electrostatic interactions typical of oppositely charged polyelectrolytes (23). There are three components in the assay: a CCP (in orange), a PNA-C* (in black), where C* is a reporter fluorophore, and the negatively charged target ssDNA, which may be complementary (in red) or noncomplementary (in green) to the PNA sequence. The PNA-C* and the ssDNA are first treated according to hybridization protocols, and the CCP is added to the resulting solution. If the ssDNA does not hybridize, one encounters situation A in Scheme 1, where the ssDNA and the CCP are brought together by nonspecific electrostatic forces. The PNA-C* is not incorporated into the electrostatic complex. Situation B in Scheme 1 shows that when the PNA-C* and the complementary ssDNA hybridize, the CCP binds to the duplex structure. If the optical properties of the CCP and the C* are optimized, then selective excitation of the CCP results in very efficient FRET to C*. One can therefore monitor the presence of specific ssDNA sequences by monitoring the C* emission or the CCP-to-C* emission ratio. Scheme 1 is specific to PNA/DNA interactions; however, other similar assays have appeared that incorporate peptide/RNA, DNA/DNA, and RNA/RNA recognition pairs (24–29).
Scheme 1.
Use of CCPs for the detection of PNA/DNA hybridization. The CCP is orange, the PNA-C* is black, the noncomplementary ssDNA is green, and the complementary ssDNA is red.
Widespread incorporation of Scheme 1 into microarray assays has not been accomplished thus far, primarily because of a lack of CCP structures that can be excited at 488 nm and are strongly emissive in the solid state. This excitation wavelength is commonly used in many instruments that perform programmed changes in temperature for PCRs and in microarray readers. Large fluorescence quantum efficiencies (Φs) are required for increased sensitivity.
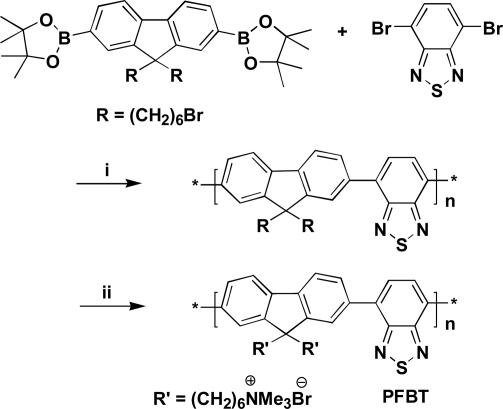
In this contribution, we disclose the design and synthesis of poly[9,9′-bis(6′′-N,N,N-trimethylammonium)hexyl)f luorene-co-alt-4,7-(2,1,3-benzothiadiazole) dibromide] (PFBT) (Scheme 2). This polymer meets the optical requirements stated above. We further demonstrate that the basic recognition and optical properties of Scheme 1 can be extended to solid-state assays. The availability of PFBT also allowed us to create a hybridization test that circumvents the need to label target ssDNA.
Scheme 2.
Reaction conditions. (i) 2M K2CO3, toluene; Pd(PPh3)4. (ii) Trimethylamine, tetrahydrofuran/H2O.
Materials and Methods
General Details. The 1H and 13C NMR spectra were collected on a Varian ASM-100 200 MHz spectrometer. The UV-Vis absorption spectra were recorded on a Shimadzu UV-2401 PC diode array spectrometer. Fluorescence was measured by using a PTI (Lawrenceville, NJ) Quantum Master fluorometer equipped with a xenon lamp excitation source and a Hamamatsu Photonics (Hamamatsu City, Japan) 928 PMT, by using 90° angle detection for solution samples. Fluorescence intensities were determined as the integrated area of the emission spectra and FRET ratios were calculated as the area of the acceptor (Cy5) over the area of the donor (PFBT). Solid-state fluorescence samples were examined either by using a Bio-Rad Molecular Imager FX or a PTI Quantum Master fluorometer. HPLC-purified DNA oligo-nucleotides were obtained from Sigma Genosys, and the concentrations were determined by using 260-nm absorbance measurements in 200-μl quartz cells in a Beckman Coulter DU800 spectrophotometer. The HPLC-purified PNA probes were purchased from Applied Biosystems and used as received. Water used was distilled and deionized by using a Millipore filtration system. All other reagents were obtained from Aldrich (Mil-waukee, WI) and were used as received.
Polymer Synthesis. Poly[9,9′-bis(6′-bromohexyl)fluorene-co-alt-4,7-(2,1,3-benzothiadiazole)] (PFBT precursor). 2,7-Bis[9,9′-bis(6′′-bromohexyl)-fluorenyl]-4,4,5,5-tetramethyl-[1.3.2]dioxaborolane (186 mg, 0.25 mmol), 4,7-dibromo-2,1,3-benzothiadiazole (73.5 mg, 0.25 mmol), Pd(PPh3)4 (5 mg), and potassium carbonate (830 mg, 6 mmol) were placed in a 25-ml round-bottom flask. A mixture of water (3 ml) and toluene (6 ml) was added to the flask and the reaction vessel was degassed. The resulting mixture was heated at 85°C for 20 h and then added to acetone. The polymer was filtered and washed with methanol and acetone and then dried under vacuum for 24 h to afford PFBT precursor (105 mg, 65%) as a bright-yellow powder. 1H NMR (200 MHz, CDCl3): δ 8.07–7.91 (m, 6H), 7.87–7.72 (m, 2H) 3.36–3.29 (t, 6H, J = 6.6 Hz), 2.19 (m, 4H), 1.7 (m, 4H), 1.3–1.2 (m, 8H), 0.9 (m, 4H). 13C NMR (50 MHz, CDCl3): δ 154.5, 151.6, 141.2, 136.8, 133.8, 128.5, 124.3, 120.6, 55.6, 40.4, 34.3, 32.9, 29.3, 27.9, 23.9. GPC (tetrahydrofuran, polystyrene standard), Mw: 20,500 g/mol; Mn: 12,000 g/mol; polydispersity index: 1.7. Elemental analysis calculated: C, 59.43; H, 5.47; N. 4.47; found: C, 60.13; H, 5.29; N, 3.35.
PFBT. Condensed trimethylamine (2 ml) was added dropwise to a solution of the neutral precursor polymer (70 mg) in tetrahydrofuran (10 ml) at -78°C. The mixture was then allowed to warm up to room temperature. The precipitate was redissolved by addition of water (10 ml). After the mixture was cooled down to -78°C, more trimethylamine (2 ml) was added and the mixture was stirred for 24 h at room temperature. After removing most of the solvent, acetone was added to precipitate PFBT (72 mg, 89%) as a light brown powder. 1H NMR (200 MHz, CD3OD): δ 8.3–7.8 (m, 8H), 3.3–3.2 (t, 4H), 3.1 (s, 18H), 2.3 (br, 4H), 1.6 (br, 4H), 1.3 (br, 8H), 0.9 (br, 4H). 13C NMR (50 MHz, CD3OD): δ 155.7, 152.7, 142.7, 138.2, 134.6, 129.9, 125.3, 121.5, 67.8, 56.9, 52.5, 41.4, 30.5, 27.1, 25.2, 23.9.
Protocols for Polymer Amplified Microarray Detection. Slide preparation. Glass slides (72 × 22 mm) (Corning) were cut into 10 × 10 mm2 pieces. The substrates were soaked in 10% NaOH overnight and then rinsed with diionized (DI) water three times. After 5 min of sonication in DI water, the slides were washed with 1% HCl, with water, and finally with methanol. The slides were then transferred into a jar containing a solution of 97% aminopropyl trimethoxysilane (1 ml), DI water (1 ml), and high-purity methanol (24 ml) and sonicated for 30 min. The temperature of water increased from 25°C to 30°C during sonication. The slides were then washed twice with methanol, followed by water, and then dried under a stream of nitrogen. The slides were baked at 135°C for 20 min before activation.
Slide activation. The amine-functionalized glass slides were reacted for 2 h with 50 mg of 1,4-phenylenediisothiocyanate in 25 ml of a 10% solution of anhydrous pyridine in dimethylformamide. The slides were subsequently washed with dimethylformamide and dichloromethane before drying under a stream of nitrogen.
Probe immobilization. The PNA probe was dissolved (1-methyl-pyrrolidinone:H2O = 1:2) and then diluted to a concentration of 5 × 10⁻⁵ M in 50 mM Na2CO3 and NaHCO3 buffer (pH 9.0). Spotting was accomplished by using 1-μl aliquots from a standard micropipette. Binding of amino-functionalized PNA to the surface was performed over a period of 3 h at 37°C inside a humid chamber containing a saturated NaCl solution. After probe immobilization, the arrays can be used immediately or stored under dry, dark conditions at room temperature. The washing steps after immobilization, however, should not be carried out until immediately before hybridization.
Washing and blocking. After spotting, the PNA probes the slides were rinsed with DI water and methanol. The surface was deactivated with a solution made of aminoethanol (0.1 ml), diisopropylethylamine (0.65 ml), and dimethylformamide (25 ml) over a period of 2 h. The slides were subsequently washed with dimethylformamide, acetone, and water, and dried with nitrogen. It was important to ensure the slides did not fully dry between washing steps.
Target hybridization. Target hybridization was performed in commercially available hybridization chambers (arrayit microarray technology) by using [DNA] = 3 × 10⁻⁷ M in buffer (50 mM SSC plus 0.1% SDS) at room temperature for 20 min.
Posthybridization wash. The slides were washed with in 1× SSC plus 0.1% SDS for 5 min at room temperature, followed by 0.1× SSC plus 0.1% SDS for 5 min at room temperature. The slides were rinsed quickly with DI water and then dried with nitrogen.
Polymer loading (for hybridized DNA without a dye modification). The polymer was applied (0.5 μl, 5 × 10⁻⁷ M in repeat units) on top of the immobilized spots, and the slides were then placed in a hybridization chamber for 30 min. The slides were washed with in 1× SSC plus 0.1% SDS for 5 min at room temperature, followed by 0.1× SSC for 1 min at room temperature. The slides were rinsed quickly with DI water and then dried with nitrogen. Fluorescent images were recorded with a molecular imager.
Polymer loading (for hybridized DNA with a dye modification). The fluorescence was first measured by using a molecular imager. The polymer was applied (1 μl, 4 × 10⁻⁶ M in repeat units) on top of the immobilized spots, and the slides were then placed under nitrogen until the polymer drop dried. The fluorescence was then measured by using a standard fluorometer with the detection slit fully open.
Results and Discussion
The synthesis of PFBT is shown in Scheme 2. Suzuki copolymerization of 2,7-bis[9,9′-bis(6′′-bromohexyl)-f luorenyl]-4,4,5,5-tetramethyl-[1.3.2]dioxaborolane and 4,7-dibromo-2,1,3-benzothiadiazole gives poly[9,9′-bis(6′′-bromohexyl)fluorene-co-alt-4,7-(2,1,3-benzothiadiazole)] in 65% yield (30). Elemental analysis and 1H and 13C NMR spectroscopies are consistent with the structure in Scheme 2. Gel permeation chromatography shows a number average molecular mass of 12,000 atomic mass units and a polydispersity index of 1.7, relative to polystyrene standards. In a second step, nucleophilic displacement by using trimethylamine generates the cationic charges on the polymer pendant groups and produces the water-soluble PFBT.
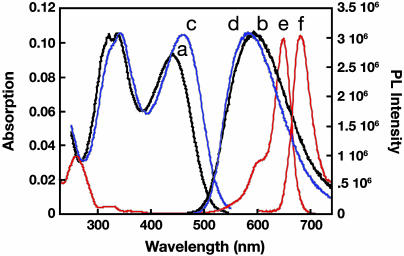
Fig. 1 shows the absorption and emission spectra of PFBT in 25 mM phosphate buffer (pH, 7.4) and as a film obtained by casting the polymer from a methanol solution (0.005 M). The absorption spectra of PFBT, both in solution and in the solid, display two well separated bands. The absorption band centered at 330 nm is attributed to the fluorene segments in the polymer, whereas the absorption at 455 nm corresponds to the contribution from the benzothiadiazole units (31). The photoluminescence spectra for PFBT do not show vibronic structure and display maxima at ≈590 nm (28, 32). PFBT has a quantum yield of 7 ± 1% in water (using fluorescein as a standard). The solid-state quantum yield of PFBT was measured to be 4 ± 1% by using an integrating sphere. Fig. 1 also contains the absorption and emission of a Cy5-labeled PNA (PNAI-Cy5 = 5′-Cy5-CAGTCCAGTGATACG-3′). Examination of the 300- to 700-nm range shows that only PFBT absorbs at 488 nm, and that there is excellent overlap between the emission of PFBT and the absorption of Cy5, a necessary condition for FRET from PFBT to Cy5.
Fig. 1.
Normalized absorption (lines a and c) and photoluminescence (lines b and d) spectra of PFBT in buffer (black) and in films (blue). Absorption (line e) and emission (line f) of PNAI-Cy5 are red. Photoluminescence spectra were obtained by excitation at 460 nm for PFBT and at 645 nm for Cy5. The buffer is 25 mM phosphate buffer (pH, 7.4).
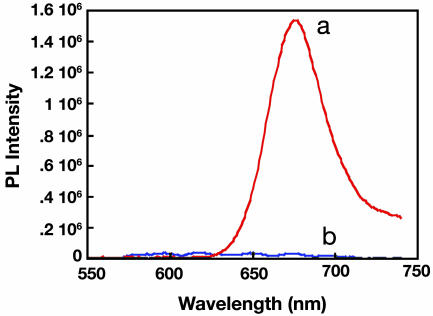
The use of PFBT (3.0 × 10⁻⁷ M in repeat units) and PNAI-Cy5 ([PNAI-Cy5] = 1 × 10⁻⁹ M) in the assay shown in Scheme 1 was tested by using a complementary ssDNA (ssDNAIc = 5′-CGTATCACTGGACTG-3′) and a noncomplementary ssDNA (ssDNAIn = 5′-CAGTCTATCGTCAGT-3′). The experimental conditions chosen include use of a 25 mM phosphate buffer (pH, 7.4) with 5% 1-methyl-pyrrolidinone. The small quantity of organic solvent reduces hydrophobic interactions between PNA and PFBT. As shown in Fig. 2, the addition of PFBT to ssDNAIc/PNAI-Cy5 and excitation at 460 nm results in intense red emission from the Cy5. For the solution containing ssDNAIn/PNAI-Cy5, there is no energy transfer under these experimental conditions.
Fig. 2.
Photoluminescence spectra of PFBT with hybridized PNAI-Cy5/ssDNAIc (line a) and nonhybridized PNAI-Cy5+ssDNAIn (line b) in 25 mM phosphate buffer with 5% 1-methyl-pyrrolidinone (excitation wavelength = 460 nm, [PNAI-Cy5] = 1.0 × 10⁻⁹ M). Residual polymer emission was subtracted for clarity.
To demonstrate that the light-harvesting properties of PFBT could be incorporated into platforms suitable for microarray technologies, we designed a simplified test structure with PNA probes attached to glass or silica surfaces, as shown in Fig. 3. The test surface was prepared by a sequence of steps that begins with treatment using 2-aminopropyltrimethoxysilane and subsequent activation with 1,4-phenylenediisothiocyanate. Amine terminated PNA (PNAII = NH2–O–O–TCCACGGCATCTCA), where O corresponds to a C6H11NO3 linker fragment, was immobilized on the activated surface by taking advantage of well established isothiocyanate/amine-coupling protocols (33).
Fig. 3.
Surface-bound PNA probe structure.
To estimate the ssDNA quantity that the PNA-containing surfaces can capture, they were treated with a dye-labeled ssDNA (ssDNAIIc-Cy5 = 5′-Cy5-TGAGATGCCGTGGA, [ssDNAIIc-Cy5] = 3 × 10⁻⁷ M) solutions for 30 min at room temperature, followed by washing steps (see Materials and Methods). The resulting quantity of ssDNAc was estimated by measuring the Cy5 fluorescence with a FluoroImager. Comparison of the resulting Cy5 emission intensities against the intensities from a known number of chromophores provided an estimate of 1012 strands of hybridized ssDNAIIc-Cy5 per cm2.No Cy5 emission was detected when the surface was treated with the noncomplementary ssDNAIIn-Cy5 (ssDNAIIn-Cy5 = 5′-Cy5-ATCTTGACTGTGTGGGTGCT-3′).
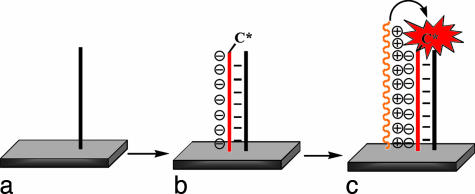
Scheme 3 illustrates the anticipated function of the PNA/CCP assay in the solid state. Treatment of the PNA (in black) containing surface with complementary ssDNA (in red) results in an increase of the surface-negative charge. Addition of the CCP results in binding to the surface. Excitation of the polymer results in FRET to the reporter dye. When noncomplementary DNA is used (data not shown), the reporter dye is not incorporated onto the surface. The purpose of Scheme 3 is to show the molecular components on the surface and the main recognition/electrostatic events in the sensor operation. Scheme 3 should not be used to imply molecular orientations relative to the surface or PNA/CCP stoichiometry.
Scheme 3.
Amplification of a PNA (black)/ssDNA-C* (red) solid-state sensor by polyelectrolytic deposition of the CCP (orange).
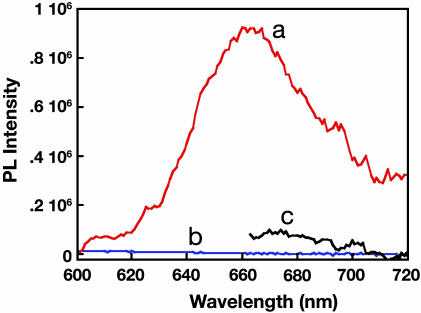
Fig. 4 shows the Cy5 emission measured with a standard fluorometer from posthybridization PNA/DNA substrates after addition of PFBT (1μl, [PFBT] = 4 × 10⁻⁶ M in repeat units). Cy5 emission is clearly detected from the ssDNAIIc-Cy5/PNAII/PFBT surface (a), whereas none is observed from the ssDNAIIn-Cy5/PNAII/PFBT substrate (b). That Cy5 emission is only observed in ssDNAIIc-Cy5/PNAII/PFBT surface reflects PNA/DNA selectivity. The additional sensitivity afforded by the addition of PFBT can be established by excitation of the ssDNAc-Cy5/PNA/PFBT surface at 470 nm (PFBT absorption) and at 645 nm (Cy5 absorption maximum). More than 1 order of magnitude amplification of the dye emission intensity is observed. These results confirm the operation of the sensor as illustrated in Scheme 3.
Fig. 4.
Fluorescence spectra of ssDNAIIc-Cy5/PNAII/PFBT (excitation at 470 nm) (line a), ssDNAIIn-Cy5/PNAII/PFBT (excitation at 470 nm) (line b), and ssDNAIIc-Cy5/PNAII/PFBT (direct excitation of Cy5 at 645 nm) (line c).
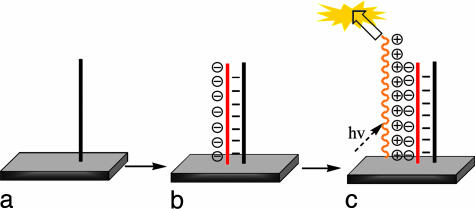
Based on the fact that PFBT can be excited at 488 nm and that its solid-state emission can easily be detected with a commercial FluoroImager, it occurred to us that it could be possible to design a solid-state assay that did not require labeled ssDNA. The overall process is illustrated in Scheme 4. Hybridization of ssDNA to the PNA surface (Scheme 4a) results in a negatively charged surface (Scheme 4b). Because of electrostatic attraction, the addition of the CCP, followed by washing, should result in preferential adsorption on sites containing complementary ssDNA (Scheme 4c). After workup, polymer emission indicates that the ssDNA is complementary to the PNA sequence. The overall selectivity of Scheme 4 relies on the successful removal of CCP from nonhybridized PNA surfaces.
Scheme 4.
Hybridization of PNA (a) with ssDNA results in an increase of negative charge at the surface (b), and electrostatic interactions result in adsorption of the CCP (c).
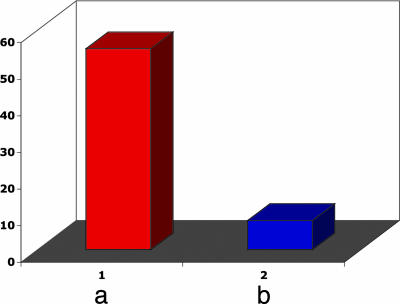
Fig. 5 shows the integrated PFBT emission from 1-mm2 PNAII surfaces treated according to Scheme 4. The polymer was deposited by addition of 0.5 μl of a 5 × 10⁻⁷ M solution and was allowed to stand in a hybridization chamber for 30 min at room temperature. Washing was accomplished by using 1 ×SSC plus 0.1% SDS solution, followed by 0.1× SSC. When placed inside a FluoroImager, one can observe that the PFBT emission from the PNAII/ssDNAIIc surfaces is approximately five times more intense than the emission from the PNAII/ssDNAIIn areas. Exposing the surfaces to more concentrated PFBT solutions results in more intense emission signals but poorer selectivity. The data in Fig. 5 demonstrate that it is possible to detect the presence of 1010 ssDNA strands that are complementary to the surface PNA sequence, without need to label the target species.
Fig. 5.
Comparison of PFBT intensity after 0.5 μl polymer addition to PNAII/ssDNAIIc (a) and PNAII/ssDNAIIn surfaces (b), followed by washing. The initial PFBT concentration is 5 × 10⁻⁷ M.
In summary, the unique structural and optical properties of PFBT have allowed us to extend the PNA/DNA sensory method previously demonstrated for CCPs in solution to solid platforms that can be easily incorporated into widely used DNA microarray readers. The demonstration of label-free detection, by using changes in surface charge upon hybridization, followed by electrostatic adsorption of the CCP, as shown in Scheme 4, may provide for a substantial simplification of DNA detection methods that currently require labeling of either the probe or the target.
Acknowledgments
This work was supported by National Institutes of Health Grant GM62958-01 and the Institute for Collaborative Biotechnologies.
Author contributions: B.L. and G.C.B. designed research; B.L. performed research; B.L. contributed new reagents/analytic tools; B.L. analyzed data; and B.L. and G.C.B. wrote the paper.
Abbreviations: PNA, peptide nucleic acid; CCP, cationic conjugated polymers; PFBT, poly[9,9′-bis(6′′-N,N,N-trimethylammonium)hexyl)fluorene-co-alt-4,7-(2,1,3-benzothiadiazole) dibromide]; DI, diionized.
References
- 1.Gillespie, D. & Spiegelman, S. (1965) J. Mol. Biol. 12, 829-842. [DOI] [PubMed] [Google Scholar]
- 2.Lipshutz, R. J., Fodor, S. P. A., Gingeras, T. R. & Lockart, D. J. (1999) Nat. Genet. 21, 20-24. [DOI] [PubMed] [Google Scholar]
- 3.Wolcott, M. J. (1992) Clin. Microbiol. Rev. 5, 370-386. [DOI] [PMC free article] [PubMed] [Google Scholar]
- 4.Wang, J. (2000) Nucleic Acids Res. 28, 3011-3016. [DOI] [PMC free article] [PubMed] [Google Scholar]
- 5.Umek, R. M., Lin, S. W., Vielmetter, J., Terbrueggen, R. H., Irvine, B., Yu, C. J., Kayyem, J. F., Yowanto, H., Blackburn, G. F., Farkas, D. H. & Chen, Y. P. (2001) J. Mol. Diagn. 3, 74-84. [DOI] [PMC free article] [PubMed] [Google Scholar]
- 6.Schork N. J., Fallin, D. & Lanchbury J. S. (2000) Clin. Genet. 58, 250-264. [DOI] [PubMed] [Google Scholar]
- 7.Balakin, K. V., Korshun, V. A., Mikhalev, I. I., Maleev, G. V., Malakhov A. D., Prokhorenko, I. A. & Berlin, Yu. A. (1998) Biosens. Bioelectron. 13, 771-778. [DOI] [PubMed] [Google Scholar]
- 8.Ranade, K., Chang, M. S., Ting, C. T., Pei, D., Hsiao, C. F., Olivier, M., Pesich, R., Hebert, J., Chen, Y. D., Dzau, V. J., et al. (2001) Genome Res. 11, 1262-1268. [DOI] [PMC free article] [PubMed] [Google Scholar]
- 9.Piatek, A. S., Tyagi, S., Pol, A. C., Telenti, A., Miller, L. P., Kramer, F. R. & Alland, D. (1998) Nat. Biotechnol. 16, 359-363. [DOI] [PubMed] [Google Scholar]
- 10.Service, R. F. (1998) Science 282, 396-399. [DOI] [PubMed] [Google Scholar]
- 11.Southern, E. M. (1996) Trends Genet. 12, 110-115. [DOI] [PubMed] [Google Scholar]
- 12.Ramsay, G. (1998) Nat. Biotechnol. 16, 40-44. [DOI] [PubMed] [Google Scholar]
- 13.Epstein, C. B. & Butow, R. A. (2000) Curr. Opin. Biotechnol. 11, 36-41. [DOI] [PubMed] [Google Scholar]
- 14.Heeger, P. S. & Heeger, A. J. (1999) Proc. Natl. Acad. Sci. USA 96, 12219-12221. [DOI] [PMC free article] [PubMed] [Google Scholar]
- 15.Leclerc, M. (1999) Adv. Mater. 11, 1491-1498. [Google Scholar]
- 16.McQuade, D. T., Pullen, A. E. & Swager, T. M. (2000) Chem. Rev. (Washington, D.C.) 100, 2537-2574. [DOI] [PubMed] [Google Scholar]
- 17.Chen, L., McBranch, D. W., Wang, H. L., Hegelson, R., Wudl, F. & Whitten, D. C. (1999) Proc. Natl. Acad. Sci. USA 96, 12287-12292. [DOI] [PMC free article] [PubMed] [Google Scholar]
- 18.Lakowicz, J. R. (1999) in Principles of Fluorescence Spectroscopy, (Kluwer Academic/Plenum New York), 2nd Ed.
- 19.Ho, H. A., Boissinot, M., Bergeron, M. G., Corbeil, G., Doré, K., Boudreau, D. & Leclerc, M. (2002) Angew. Chem. Int. Ed. 41, 1548-1551. [DOI] [PubMed] [Google Scholar]
- 20.Leclerc, M., Ho, H. A. & Boissinot, M. (2002) World Patent WO 02/081735 A2, 1-46.
- 21.Nilsson, P. K. R. & Inganäs, O. (2003) Nat. Mater. 2, 419-424. [DOI] [PubMed] [Google Scholar]
- 22.Dore, K., Dubus, S., Ho, H. A., Levesque, I., Brunette, M., Corbeil, G., Boissinot, M., Boivin, G., Bergeron, M. G., Boudreau, D. & Leclerc, M. (2004) J. Am. Chem. Soc. 126, 4240-4244. [DOI] [PubMed] [Google Scholar]
- 23.Kabanov, A. V., Felgner, P. & Seymour, L. W., eds. (1998) Self-Assembling Complexes for Gene Delivery: From Laborotary to Clinical Trial (Wiley, Chichester, U.K.).
- 24.Gaylord, B. S., Heeger, A. J. & Bazan G. C. (2002) Proc. Natl. Acad. Sci. USA 99, 10954-10957. [DOI] [PMC free article] [PubMed] [Google Scholar]
- 25.Gaylord, B. S., Heeger A. J. & Bazan G. C. (2003) J. Am. Chem. Soc. 125, 896-900. [DOI] [PubMed] [Google Scholar]
- 26.Wang, S. & Bazan, G. C. (2003) Adv. Mater. 15, 1425-1428. [Google Scholar]
- 27.Liu, B., Wang, S., Bazan, G. C. & Mikhailovsky, A. (2003) J. Am. Chem. Soc. 125, 13306-13307. [DOI] [PubMed] [Google Scholar]
- 28.Liu, B. & Bazan, G. C. (2004) J. Am. Chem. Soc. 126, 1942-1943. [DOI] [PubMed] [Google Scholar]
- 29.Liu, B. & Bazan, G. C. (2004) Chem. Mater. 16, 4467-4476. [Google Scholar]
- 30.Liu, B., Gaylord, B. S., Wang, S. & Bazan G. C. (2003) J. Am. Chem. Soc., 125, 6705-6714. [DOI] [PubMed] [Google Scholar]
- 31.Stevens, M. A., Silva, C., Russell, D. M. & Friend, R. H. (2001) Phys. Rev. B 63, 165213-1-165213-18. [Google Scholar]
- 32.Huang, F., Hou, L. T., Wu, H. B., Wang, X. H., Shen, H. L., Cao, W., Yang, W. & Cao, Y. (2004) J. Am. Chem. Soc. 126, 9845-9853. [DOI] [PubMed] [Google Scholar]
- 33.Beier, M. & Hoheisel, J. D. (1999) Nucleic Acids Res. 27, 1970-1977. [DOI] [PMC free article] [PubMed] [Google Scholar]


