Abstract
Higher ordered structures of nanofibers, including nanofiber-based yarns and cables, have a variety of potential applications, including wearable health monitoring systems, artificial tendons, and medical sutures. In this study, twisted assemblies of polyacrylonitrile (PAN), polyvinylidene fluoride trifluoroethylene (PVDF-TrFE), and polycaprolactone (PCL) nanofibers were fabricated via a modified electrospinning setup, consisting of a rotating cone-shaped copper collector, two syringe pumps, and two high voltage power supplies. The fiber diameters and twist angles varied as a function of the rotary speed of the collector. Mechanical testing of the yarns revealed that PVDF-TrFe and PCL yarns have a higher strain-to-failure than PAN yarns, reaching 307% for PCL nanoyarns. For the first time, the porosity of nanofiber yarns was studied as a function of twist angle, showing that PAN nanoyarns are more porous than PCL yarns.
Keywords: electrospinning, mechanical properties, nanoyarn, porosity
INTRODUCTION
Electrospun nanofibers with both high surface-to-volume ratio and excellent pore inter-connectivity are promising candidates for various applications including tissue scaffolding, filtration, wearable sensing technology, and energy storage.1–5 However, use of nonwoven fiber mats in many of these applications is currently limited by their poor mechanical properties, low production, and random alignment.6–9 In order to translate the superior properties of micro- and nanofibers to materials that can be used in bulk production, considerable effort has been made to assemble these polymeric materials into higher ordered structures.1,6,10 These structures include twisted assemblies of nanofibers, such as nanofiber-based ropes, cables, and yarns.6,11–14 The architecture of interest, nanoyarn, is expected to have superior strength and a higher degree of order than nonwoven mats due to increased cohesive forces between fibers.1,7,15
To our knowledge, few researchers have reported fabrication of continuous twisted nanoyarns via electrospinning.6,7,12,13,16–19 Early papers demonstrated the production of short, twisted nanofiber bundles using multi-step systems, which included twisting post-electrospinning.1,20 However, these processes are not feasible for scale-up production. More recently, researchers have developed modified electrospinning setups that form continuous, twisted nanofiber yarns in one system.6,12,13,21–23 Ali et al. built a modified electrospinning setup in which nanofibers were spun onto a rotary funnel collector, twisted into yarns, and collected onto a yarn winding system.7 The researchers studied the dependences of nanofiber and yarn diameters on several electrospinning parameters, including flow rate and applied voltage. Both the tensile strength and elongation at break increased with twist level, up to a certain threshold. Using a similar setup, Xie et al. fabricated conductive nanofiber yarns by electrospinning polyacrylonitrile (PAN) nanofiber yarns and subsequently performing thermal stabilization and carbonization treatments.23 He et al. fabricated continuous PAN nanofiber yarns using multi-nozzle bubble electrospinning, in which upon injection of air, charged bubbles were stretched into fibers by an electric field and collected onto a funnel collector.17 Next, fibers were drawn into yarns using an insulating rod. The researchers analyzed the mechanical properties of the nanoyarns and determined that both the tensile strength and the elongation at break increased with increasing twist angle. Nanofiber yarn with a twist angle of 49.7° showed a tensile strength of 0.592 cN dex−1, compared to 0.101 cN dex−1 for an untwisted fiber bundle. Dabirian et al. developed an electrospinning process to manufacture continuous PAN nanofiber yarns using two oppositely charged needles and a rotating circular plate.13 This method included drawing and twisting electrospun nanofibers. The tensile strength of the nanofiber yarns increased from 90 to 350 MPa with increasing draw ratios. In addition to increasing the draw ratio of the yarns, researchers have found that other post-treatments of nanofiber yarns may increase their mechanical strength. For example, Liu et al. subsequently submerged nanofiber ropes in methanol to remove residual solvent in individual fibers.14 These post-treated ropes resulted in much-improved mechanical properties because the removal of residual solvent resulted in reduced repulsive interactions due to residual surface charge.
While a number of techniques have been developed recently to produce continuous twisted nanofiber yarns, there is still a need for systematic characterization of these materials. Better control over twist level, yarn uniformity, and fiber morphology will allow greater opportunity to incorporate these architectures into complex systems.
In this study, PAN, PVDF-TrFe, and PCL nanoyarns were fabricated through a modified electrospinning setup. A rotating funnel collector was used to produce aligned, twisted assemblies of nanofiber yarns. The morphology, mechanical properties, and porosity of the nanoyarns were evaluated as a function of the rotary speed of the collector. Yarns produced at higher rotary speeds showed improved mechanical properties, including maximum tensile stress and strain-to-failure, until a threshold was reached. Ultimately, the goal is to create a one-step system for developing continuous and uniform nanostructured polymeric materials, in addition to developing a systematic method for characterizing these novel materials.
EXPERIMENTAL
Materials
Polyacrylonitrile (PAN) (Mw ~150,000 g/mol) and polycaprolactone (PCL) (Mw ~80,000 g/mol) were purchased from Sigma Aldrich. Polyvinylidene fluoride trifluoroethylene (PVDF-TrFe) copolymer with a 65/35% mol ratio was donated by Dr. Mitch Thompson at Measurement Specialties Inc. (Hampton, VA). N,N-Dimethylformamide (DMF) and methyl ethyl ketone (MEK) were purchased from Alfa Aesar (Ward Hill, MA). Chloroform was purchased from EMD Millipore (Gibbstown, NJ) and methanol (MeOH) was purchased from VWR International (Radnor, PA). Deionized water was used throughout the experiments. All polymers/solvents were used as received.
A polymer solution of PAN (15 wt %) in DMF was prepared by dissolving and stirring the mixture on a hotplate at 80 °C for 2 h. PVDF-TrFe spinning solutions were prepared by mixing 10% (vol/vol) of dH2O in MEK and subsequently adding 15 wt % PVDF-TrFe. PCL solutions were prepared by mixing 9 : 1 (vol/vol) of chloroform with MeOH and subsequently adding 10 wt % PCL. Solutions were mixed for 2 h at room temperature.
Electrospinning of Nanoyarns
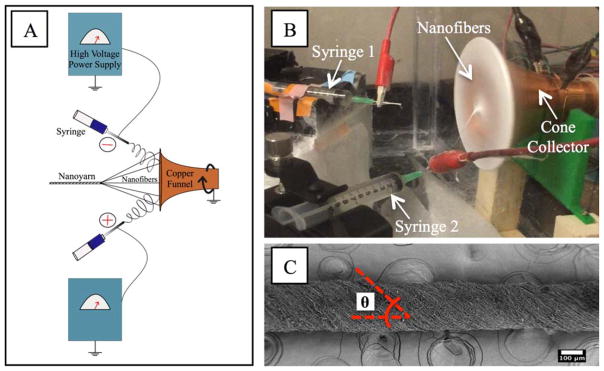
The nanoyarn electrospinning setup was modified from the work by Ali et al.7 Briefly, the electrospinning setup consisted of two high voltage power supplies (Gamma High Voltage Research, Ormond Beach, FL), two syringe pumps (Harvard Apparatus, Plymouth Meeting, PA), and a copper funnel (diameter 120 mm), as shown in Figure 1. Solutions were loaded into two 10 mL Becton Dickinson syringes (BD, Franklin Lakes, NJ) fitted with 21-gauge Precision Glide needles (Becton Dickinson & Co., Franklin Lakes, NJ). The syringe pumps were both set to a rate of 1 mL h−1 and the voltages were set between 10 and 12 kV and 5–8 kV. The syringes were arranged symmetrically to the copper funnel with a distance of 5–6 cm between each needle tip and the collector. The angle between each needle and the funnel was 30°. Two high voltage power supplies were connected to the needle tips using alligator clips. One needle tip was positively charged and the other was negatively charged. The funnel was grounded by connecting the electrodes to a copper wire wrapped around the base of the funnel. The relative humidity in the electrospinning enclosure was ≤ 40%. During electrospinning, fibers collected across the face of the copper funnel, as shown in Figure 1(b), and were drawn into a yarn using an insulating rod. The nanoyarns were fully dried as they were pulled from the copper funnel. Nanoyarns were produced at rotary speeds of 500, 700, 900, and 1100 rpm and were observed under the optical microscope after production to ensure they had a twisted structure (Supporting Information Figure S1).
Figure 1.
Fabrication of nanoyarns. (A) Schematic of nanoyarn electrospinning setup; (B) image of electrospinning setup; (C) SEM image of a PVDF-TrFe nanoyarn. Theta represents the twist angle. [Color figure can be viewed at wileyonlinelibrary.com]
Characterization
Scanning electron microscopy (SEM) imaging was used to analyze the morphology of the nanoyarns. Nanoyarns were sputter coated with platinum/palladium at 40 mA for 35 s (Cressington Scientific 108 Auto, Watford, UK) and then imaged with field emission scanning electron microscopy (FESEM Zeiss VP5 Supra). ImageJ® was used to analyze the fiber and yarn diameters, and yarn twist, measuring up to 50 fibers per sample.
The mechanical properties of the manufactured nanoyarns were analyzed using an Instron 3300 (Model 3365, Instron, Norwood, MA) with a 5 N load cell and crosshead speed of 12 mm min−1. Each yarn was mounted with adhesive tape in paper frames with 2.5 cm openings. At least three samples were mechanically tested for each condition. To convert load into stress, the yarn thickness was measured at 15 points along each sample using an Olympus PMG 3 (Olympus, Center Valley, PA) and the average thickness was recorded. Samples were tested only if they passed the 3-Sigma test and displayed uniform twist.
The porosity of the yarns was calculated from the density of the yarn samples. Three yarn samples were tested for each funnel speed. The density measurements were based on modified ASTM D3800-99 and ASTM D891 standards using a 2 mL glass pycnometer (Corning Inc., Corning, NY) at room temperature with MeOH as the working liquid. Porosity, ε, and relative density, , are correlated as
| (1) |
where ρ is the density of the nanofiber yarn, and ρf is the density of the solid fiber material.24 On average, the mass and volume of PCL nanoyarns were 0.5 mg and 0.003 cm3, respectively. The mass and volume of PAN nanoyarns were 0.4 mg and 0.008 cm3, respectively.
RESULTS AND DISCUSSION
Fiber and Yarn Morphology
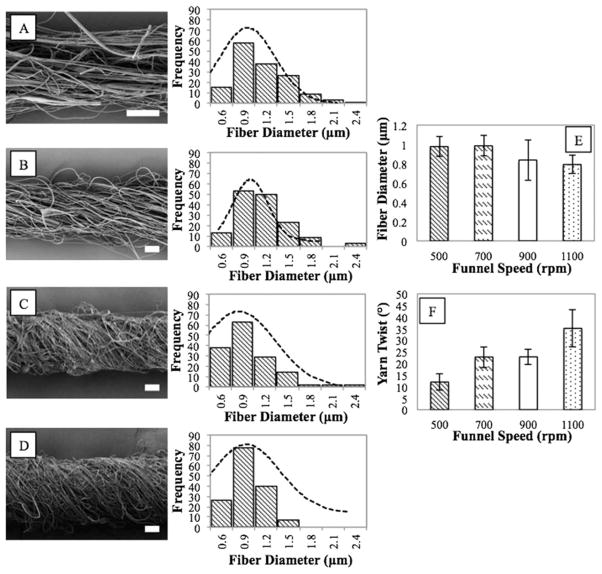
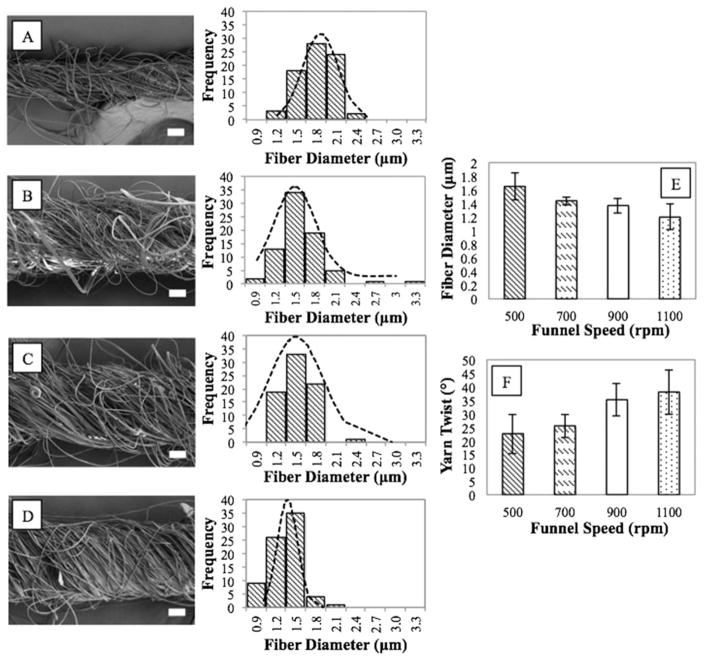
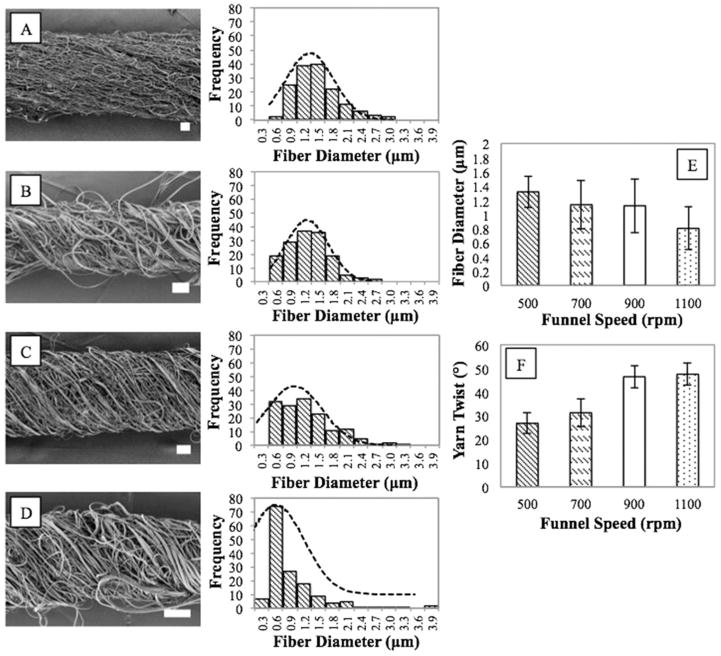
SEM images of PVDF-TrFe, PAN, and PCL nanoyarns are shown in Figures 2(a–d), 3(a–d), and 4(a–d), respectively. During electrospinning, nanofibers collected across the face of the copper funnel. An insulating rod was inserted into the center of the funnel to draw the fibers into a twisted yarn. As demonstrated by Ali et al. a fibrous cone formed after insertion of the insulating rod into the mat of fibers.7 PVDF-TrFe, PAN, and PCL nanofibers were uniform, showing few beads. The effect of rotatory speed on nanofiber diameter and yarn twist was analyzed. The average fiber diameter decreased as a function of rotary speed, as shown in Figures 2(e), 3(e), and 4(e). The average fiber diameter of PVDF-TrFe nanoyarns was 0.97 μm at 500 rpm, compared to 0.79 μm at 1100 rpm. For PAN and PCL nanoyarns, the average fiber diameter decreased from 1.65 μm to 1.20 μm and from 1.32 μm to 0.81 μm, respectively. According to He et al. this can be attributed to the stretching of centrifugal force.17 Moreover, the yarn twist increased as a function of rotary speed, from 11.9° at 500 rpm to 35.1° at 1100 rpm for PVDF-TrFe nanoyarns, 22.6° to 38.1° for PAN nanoyarns, and from 26.9° to 47.6° for PCL nanoyarns, as shown in Figures 2(f), 3(f), and 4(f). The diameter of the nanoyarns varied between yarns produced under the same electrospinning conditions. This can be attributed to variations in electrospinning collection time and the speed at which fibers were wound into a yarn.
Figure 2.
SEM images of PVDF-TrFe nanoyarns electrospun at (A) 500; (B) 700; (C) 900; and (D) 1100 rpm and histograms of individual fiber diameters; (E) individual fiber diameter vs. funnel speed; (F) yarn twist vs. funnel speed. Scale bars represent 20 μm.
Figure 3.
SEM images of PAN nanoyarns electrospun at (A) 500; (B) 700; (C) 900; and (D) 1100 rpm and histograms of individual fiber diameters; (E) individual fiber diameter vs. funnel speed; (F) yarn twist vs. funnel speed. Scale bars represent 20 μm.
Figure 4.
SEM images of PCL nanoyarns electrospun at (A) 500; (B) 700; (C) 900; and (D) 1100 rpm and histograms of individual fiber diameters; (E) individual fiber diameter vs. funnel speed; (F) yarn twist vs. funnel speed. Scale bars represent 20 μm.
Mechanical Properties of Nanoyarns
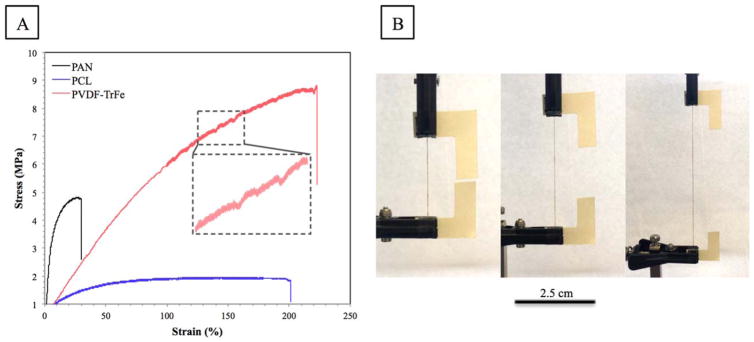
Typical stress–strain curves for nanoyarns prepared at 500 rpm are shown in Figure 5(a) and mechanical properties are listed in Table I. From looking at the point of break (shown in Supporting Information Figure S5), it is clear that individual nanofibers were aligned and pulled during tensile testing. Stress–strain curves reveal a characteristic saw-tooth pattern (shown in Supporting Information Figures S2–S4), which is often found during loading and unloading of proteins. Untwisting of yarns or breakage of individual fibers causes an abrupt drop in the force. As shown in Figure 5, with increasing extension, the force rises again until reaching another peak.25 Figure 5(b) shows digital photographs of a PCL yarn spun at 700 rpm under tension. Results show that PCL and PVDF-TrFe yarns have a significantly higher strain-to-failure than PAN yarns. PCL yarns stretched up to 306.50% at 700 rpm compared with 10.17% for PAN nanoyarns. Similar trends are seen in PCL, PAN, and PVDF-TrFe nonwoven mats. Croisier et al. and Baniasadi et al. found the elongation at break of electrospun PCL and PVDF-TrFe fibers to be 170% and 150%, respectively.26,27 Medeiros et al. produced PAN nonwoven mats with an elongation at break of 26%.28
Figure 5.
Mechanical testing of nanoyarns. (A) Typical stress-strain curves for nanoyarns electrospun at 500 rpm; (B) digital photographs of a PCL nanoyarn during tensile testing. [Color figure can be viewed at wileyonlinelibrary.com]
Table I.
Mechanical Properties of Nanoyarns
| Polymer | Rotary speed (rpm) | Maximum tensile stress (MPa) | Elongation at break (%) |
|---|---|---|---|
| PVDF-TrFe | 500 | 6.64 ± 2.35 | 190.43 ± 37.21 |
| 700 | 4.39 ± 2.41 | 129.65 ± 62.89 | |
| 900 | 10.16 ± 4.29 | 148.64 ± 42.82 | |
| 1100 | 2.81 ± 1.18 | 146.09 ± 23.96 | |
| PAN | 500 | 4.00 ± 1.00 | 17.71 ± 10.92 |
| 700 | 4.25 ± 2.81 | 10.17 ± 4.37 | |
| 900 | 3.88 ± 1.38 | 17.42 ± 8.39 | |
| 1100 | 3.80 ± 1.21 | 7.83 ± 5.43 | |
| PCL | 500 | 1.58 ± 0.42 | 212.74 ± 11.66 |
| 700 | 1.80 ± 0.23 | 306.50 ± 46.02 | |
| 900 | 2.03 ± 0.46 | 241.77 ± 69.49 | |
| 1100 | 1.56 ± 0.13 | 258.72 ± 49.24 |
Maximum tensile strength of PCL and PVDF-TrFe nanoyarns was seen in yarns produced at a rotary speed of 900 rpm. For PAN yarns, maximum tensile strength was seen at 700 rpm. It is expected that optimization of the uptake speed will result in more uniform nanofiber yarns and improved mechanical properties.
Porosity of Nanoyarns
The porosity of PCL and PAN nanoyarns is listed in Table II. The porosity of nanofiber-based architectures is closely related to a number of factors, including fiber diameter, number of fiber–fiber contacts, contact area between fibers, and fiber-to-fiber bond strength.24 The results show that the porosity of nanoyarns is significantly higher than nonwoven mats. The porosity of PCL nanofibers that collected across the face of the collector was 38.83%, compared to 85.16% for nanoyarns spun at 500 rpm. Similarly, the porosity for PAN random fibers and nanoyarns was 45.49% and 92.63%, respectively. Additionally, as expected based on the SEM images, the porosity of PAN nanoyarns is higher than PCL nanoyarns. Thus, for nanofiber yarns, porosity is greatly affected by polymer type, rather than yarn twist angle.
Table II.
Porosity Measurements of Nanoyarns
| Polymer | Rotary speed (rpm) | Porosity (%) |
|---|---|---|
| PAN | 500 | 92.63 ± 3.50 |
| 700 | 97.15 ± 1.91 | |
| 900 | 94.76 ± 3.00 | |
| 1100 | 97.02 ± 1.87 | |
| PCL | 500 | 85.16 ± 4.16 |
| 700 | 80.20 ± 3.98 | |
| 900 | 91.87 ± 4.06 | |
| 1100 | 87.27 ± 3.66 |
Porosity of PAN fibers (%): 45.49 ± 22.12.
Porosity of PCL fibers (%): 38.83 ± 7.06.
CONCLUSIONS
A modified electrospinning setup was developed to produce nanofiber yarns from a variety of polymers, showing the adaptability of this system. Fiber diameter and yarn twist were easily tuned by varying the rotating speed of the cone collector. Furthermore, yarns were produced with high strain-to-failure, which is an important property for integration into textiles to be used in applications such as wearable health monitoring systems. PCL nanofiber yarns showed the highest twist angle, strain-to-failure, and lowest porosity, relative to PAN and PVDF-TrFe nanoyarns.
Supplementary Material
Acknowledgments
The research is supported by the National Science Foundation Partnerships for Innovation: Building Innovation Capacity (PFI:-BIC) subprogram under Grant No. 1430212. Any opinions, findings, and conclusions or recommendations expressed in this material are those of the author(s) and do not necessarily reflect the views of the National Science Foundation. Research reported in this publication was supported by National Institutes of Biomedical Imaging and Bioengineering of the National Institutes of Health under award number U01EB023035. The content is solely the responsibility of the authors and does not necessarily represent the official views of the National Institutes of Health. This work made use of Drexel University’s Centralized Research Facilities. The authors would like to thank Reva M. Street for running the FESEM and all of the members of the Shima Seiki Haute Technology Laboratory and the Natural Polymers and Photonics Group. The authors acknowledge Dr. Mitch Thompson at Measurement Specialties Inc. for donating PVDF-TrFe copolymer.
Footnotes
Additional Supporting Information may be found in the online version of this article.
References
- 1.Shuakat MN, Lin T. J Nanosci Nanotechnol. 2014;14:1389. doi: 10.1166/jnn.2014.9197. [DOI] [PubMed] [Google Scholar]
- 2.Huang T, Wang C, Yu H, Wang H, Zhang Q, Zhu M. Nano Energy. 2015;14:226. [Google Scholar]
- 3.Gheibi A, Latifi M, Merati AA, Bagherzadeh R. J Polym Res. 2014;21:1. [Google Scholar]
- 4.Bolin MH, Svennersten K, Wang X, Chronakis IS, Richter-Dahlfors A, Jager E, Berggren M. Sens Actuators B Chem. 2009;142:451. [Google Scholar]
- 5.Beringer LT, Xu X, Shih W, Shih W, Habas R, Schauer CL. Sens Actuators Phys. 2015;222:293. [Google Scholar]
- 6.He J, Qi K, Zhou Y, Cui S. J Appl Polym Sci. 2014;131:40137. [Google Scholar]
- 7.Ali U, Zhou Y, Wang X, Lin T. J Text Inst. 2012;103:80. [Google Scholar]
- 8.He JX, Wang LD, Zhou Y, Qi K, Cui SZ. Therm Sci. 2015;19:1261. [Google Scholar]
- 9.Bin Y, Hao Y, Meifang Z, Hongzhi W. J Nanosci Nanotechnol. 2016;16:5633. doi: 10.1166/jnn.2016.11721. [DOI] [PubMed] [Google Scholar]
- 10.Abbasipour M, Khajavi R. Adv Polym Technol. 2013;32:21363. [Google Scholar]
- 11.Frank CR, Samuel J. J Appl Polym Sci. 2016;133:43747. [Google Scholar]
- 12.Yan H, Liu L, Zhang Z. Mater Lett. 2011;65:2419. [Google Scholar]
- 13.Dabirian F, Ravandi SAH, Sanatgar RH, Hinestroza JP. Fibers Polym. 2011;12:610. [Google Scholar]
- 14.Liu LQ, Eder M, Burgert I, Tasis D, Prato M, Wagner HD. Appl Phys Lett. 2007;90:083108. [Google Scholar]
- 15.Ko F, Gogotsi Y, Ali A, Naguib N, Ye H, Yang GI, Li C, Willis P. Adv Mater. 2003;15:1161. [Google Scholar]
- 16.Bazbouz MB, Stylios GK. J Appl Polym Sci. 2012;124:195. [Google Scholar]
- 17.He JX, Qi K, Zhou YM, Cui SZ. Polym Int. 2014;63:1288. [Google Scholar]
- 18.Dabirian F, Ravandi SAH, Hinestroza JP, Abuzade RA. Polym Eng Sci. 2012;52:1724. [Google Scholar]
- 19.Chang G, Li A, Xu X, Wang X, Xue G. Ind Eng Chem Res. 2016;55:7048. [Google Scholar]
- 20.Fennessey SF, Farris RJ. Polymer. 2004;45:4217. [Google Scholar]
- 21.Afifi AM, Nakano S, Yamane H, Kimura Y. Macromol Mater Eng. 2010;295:660. [Google Scholar]
- 22.Ali U, Niu H, Abbas A, Shao H, Lin T. RSC Adv. 2016;6:30564. [Google Scholar]
- 23.Xie Z, Niu H, Lin T. RSC Adv. 2015;5:15147. [Google Scholar]
- 24.Donius AE, Kiechel MA, Schauer CL, Wegst UGK. J R Soc Interface. 2013;10:2013. doi: 10.1098/rsif.2012.0946. [DOI] [PMC free article] [PubMed] [Google Scholar]
- 25.Qi HJ, Ortiz C, Boyce MC. J Eng Mater Technol. 2006;128:509. [Google Scholar]
- 26.Croisier F, Duwez AS, Jerome C, Leonard AF, Van der Werf KO, Dijkstra PJ, Bennink ML. Acta Biomater. 2012;8:218. doi: 10.1016/j.actbio.2011.08.015. [DOI] [PubMed] [Google Scholar]
- 27.Baniasadi M, Xu Z, Hong M, Naraghi M, Minary-Jolandan M. ACS Appl Mater Interfaces. 2016;8:2540. doi: 10.1021/acsami.5b10073. [DOI] [PubMed] [Google Scholar]
- 28.Medeiros ES, Mattoso LHC, Ito EN, Gregorski KS, Robertson GH, Offeman RD, Delilah RW, Orts WJ, Imam SH. J Biobased Mater Bioenergy. 2008;2:1. [Google Scholar]
Associated Data
This section collects any data citations, data availability statements, or supplementary materials included in this article.


