Abstract
Purpose
The Affordable Care Act expanded access to health insurance in the United States, but concerns have arisen about access to specialized cancer care within narrow provider networks. To characterize the scope and potential impact of this problem, we assessed rates of inclusion of Commission on Cancer (CoC) –accredited hospitals and National Cancer Institute (NCI) –designated cancer centers within federal exchange networks.
Methods
We downloaded publicly available machine-readable network data and public use files for individual federal exchange plans from the Centers for Medicare and Medicaid Services for the 2016 enrollment year. We linked this information to National Provider Identifier data, identified a set of distinct provider networks, and assessed the rates of inclusion of CoC-accredited hospitals and NCI-designated centers. We measured variation in these rates according to geography, plan type, and metal level.
Results
Of 4,058 unique individual plans, network data were available for 3,637 (90%); hospital information was available for 3,531 (87%). Provider lists for these plans reduced into 295 unique networks for analysis. Ninety-five percent of networks included at least one CoC-accredited hospital, but just 41% of networks included NCI-designated centers. States and counties each varied substantially in the proportion of networks listed that included NCI-designated centers (range, 0% to 100%). The proportion of networks that included NCI-designated centers also varied by plan type (range, 31% for health maintenance organizations to 49% for preferred provider organizations; P = .04) but not by metal level.
Conclusion
A large majority of federal exchange networks contain CoC-accredited hospitals, but most do not contain NCI-designated cancer centers. These results will inform policy regarding access to cancer care, and they reinforce the importance of promoting access to clinical trials and specialized care through community sites.
INTRODUCTION
The Patient Protection and Affordable Care Act (ACA)1 contains several mechanisms designed to increase access to health insurance in the United States, including online exchanges for the purchase of insurance, expansion of Medicaid, prohibitions against excluding patients from coverage on the basis of pre-existing conditions, allowing young adults to remain on parental plans until age 26 years, and prohibitions against charging higher premiums on the basis of pre-existing conditions.2 These provisions have provided health insurance to millions of previously uninsured people.3,4
Nevertheless, concerns have arisen about provider networks offered within public exchange plans.5-8 The ACA requires that these networks include essential community providers for underserved populations, ensure sufficient choice of providers, avoid unreasonable delays, and provide publicly available provider directories.1,9,10 Still, by some measures, up to half of the exchange plan networks are narrow.11 Prior analyses have defined network adequacy on the basis of the proportion of local hospitals11 or physicians12 included in the network, as well as on time and travel distance for care.13 However, even when networks include large proportions of local providers, restrictions on certain categories of physicians or hospitals may pose a specific challenge for individuals with complex, specialized care needs, including patients with cancer.14
In addition, the ACA requires that insurers cover the standard-of-care costs of approved clinical trials, but carriers are not required to provide coverage for costs incurred out-of-network.15 Furthermore, the ACA limits annual out-of-pocket costs for privately insured patients, but that limit does not apply to care obtained through out-of-network providers or hospitals. During a time when less than 5% of patients with cancer participate in clinical trials,16-20 exclusion of accredited cancer centers and clinical trial sites from insurance networks could constitute a barrier to accrual.
The American College of Surgeons Commission on Cancer (CoC) maintains an accreditation program for hospitals that provide cancer care.21 Of the 5,686 registered hospitals in the United States according to the American Hospital Association,22 1,455 reported CoC accreditation in 2014. Approximately 70% of incident cancer cases are treated at CoC hospitals.23 Standards for CoC-accredited hospitals include multidisciplinary cancer committees, oncology nurse leadership, and cancer registry procedures. For most categories of CoC-accredited hospitals, clinical trials must also be available either on site or by referral. However, only the subset of CoC hospitals that are National Cancer Institute (NCI) –designated cancer centers must themselves participate in research. There are currently 62 NCI-designated clinical cancer centers. Recent data indicate that treatment at the subset of these institutions designated as comprehensive cancer centers may be associated with better clinical outcomes.24
Prior assessments of the impact of narrow provider networks on specific patient populations have been conflicting8,25 and have generally focused on a single “metal level,”7 involved small-scale provider surveys, or relied upon manual searches of issuer Web sites.14,26 The objectives of this analysis were to characterize the structure of provider networks for individual federal exchange plans during the 2016 open enrollment period and to use that information to conduct a comprehensive analysis of inclusion of CoC-accredited hospitals and NCI-designated cancer centers within exchange networks.
METHODS
For individual federal exchange plans, Centers for Medicare and Medicaid Services public use files contain data on benefits, cost-sharing, premiums, and other plan features.27 Beginning with the open enrollment period for 2016 plans, the Centers for Medicare and Medicaid Services also requires that federal exchange plans provide up-to-date online provider network information.28 This information is now also available in beta form to individuals shopping on the federal exchange. Data are available for federal marketplace states, as well as those with state partnership marketplaces and those with state marketplaces that use the federal information technology platform (n = 38 states in total).27
Each exchange plan provides access to a provider network and is assigned a metal level (ie, platinum, gold, silver, bronze, or catastrophic); these levels are defined according to the proportion of an average enrollee’s health care costs that would be covered by the plan. Multiple health plans can share one provider network and therefore vary only in price and cost-sharing; this occurs, for example, when one carrier offers a plan in gold, silver, and bronze versions. For every in-network provider, health plans list a network tier. These tiers vary by carrier but include terms such as “in-network” and “tier one.”
We downloaded all provider network files for the 2016 enrollment year available as of December 2015 and parsed them to create a list of providers and in-network facilities for each health plan. To facilitate comparisons among any plans that contained the same providers but grouped them into different network tiers, we created a list of every combination of National Provider Identifier (NPI) number and network tier across health plans. We then defined each plan’s network as its list of such combinations, and the set of provider networks as the set of such lists. In initial analyses, we found that it was common for networks to be highly similar but not identical to each other. Therefore, to avoid representing multiple networks as independent observations if they were essentially the same, we combined groups of networks into one network if the networks were at least 95% identical for subsequent analysis as our primary unit of observation. We also conducted sensitivity analyses in which we varied the required overlap from 80% to 100%; results were similar (Appendix, online only). For analyses focused on variation by state and county, if a network was available in more than one location, it was counted once for each location in which it was offered. Additional technical details are described in the Appendix; data sources are outlined in Appendix Figure A1 (online only).
We identified NPI numbers for CoC-accredited hospitals (n = 1,455) and NCI-designated cancer centers (n = 61); techniques for this process are described in the Appendix. We used these NPI numbers to query the provider network database and determine which networks contained hospitals in each category.
We used descriptive statistics to characterize the proportion of networks containing CoC-accredited hospitals and NCI-designated cancer centers. To measure heterogeneity among counties in rates of inclusion of CoC-accredited hospitals and NCI-designated centers, rates were also calculated among networks offered in each of the 2,595 counties that use the federal exchange and for which network data were available. We also analyzed rates in each county, weighted by the total number of in-county exchange plan selections obtained from the US Department of Health and Human Services, Office of The Assistant Secretary for Planning and Evaluation.29 We assessed for an association between networks describing themselves as “national networks” and inclusion of CoC-accredited hospitals by using Fisher’s exact test and NCI-designated centers by using the χ2 test. Among the 270 networks containing only one plan type (ie, health maintenance organization [HMO], preferred provider organization [PPO], exclusive provider organization [EPO], or point of service [POS]), we also compared rates across plan types of inclusion of CoC hospitals, using a Monte Carlo estimation of Fisher's exact test with 100,000 repetitions, and inclusion of NCI-designated centers, using the χ2 test. We used Fisher’s exact test to assess for associations between inclusion of these hospitals and the metal levels associated with each network; each network could be associated with between 1 and 5 metal levels. Analyses were conducted by using SAS software, version 9.4 (SAS Institute, Cary, NC). Statistical tests were two-sided; P values < .05 were considered statistically significant.
RESULTS
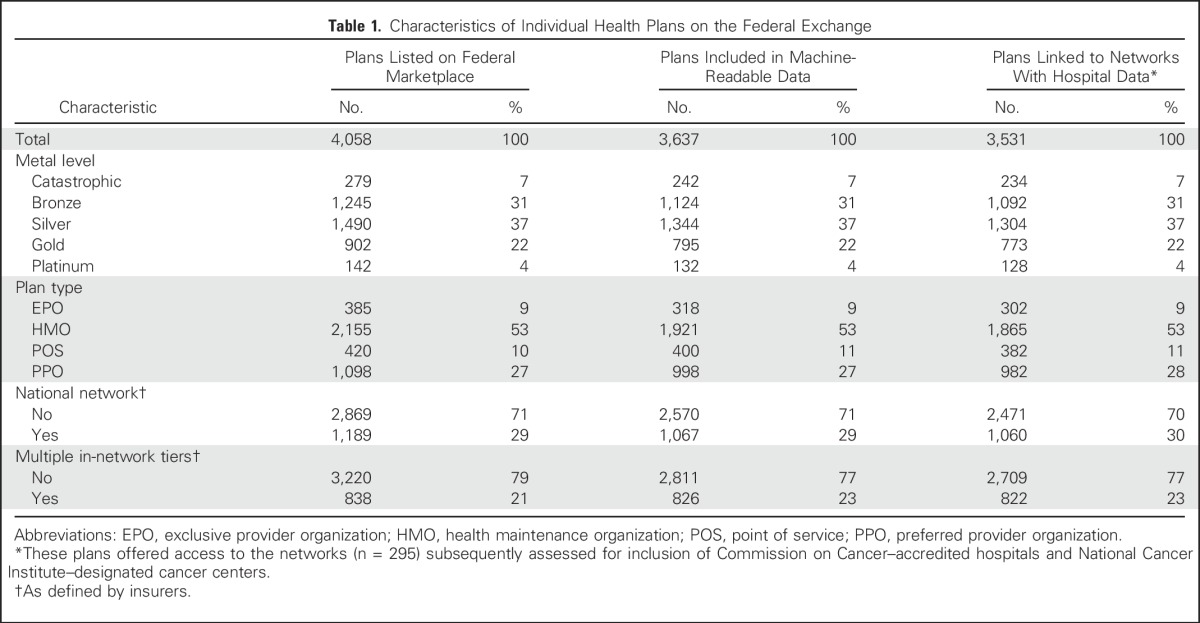
Among 4,058 individual health plans available on the federally facilitated marketplace, network data were available for 3,637 (90%), including plans in 37 of the 38 states relying upon the federal exchange infrastructure (network data were not available for Hawaii plans). The provider lists for these plans reduced to 407 unique networks. We excluded 15 networks that did not contain hospital information. The remaining networks then further reduced into 295 unique clusters in which each subsequent network after the first was at least 95% similar to the first network. These networks were accessible by 3,531 (87%) of the federal exchange plans (Table 1).
Table 1.
Characteristics of Individual Health Plans on the Federal Exchange
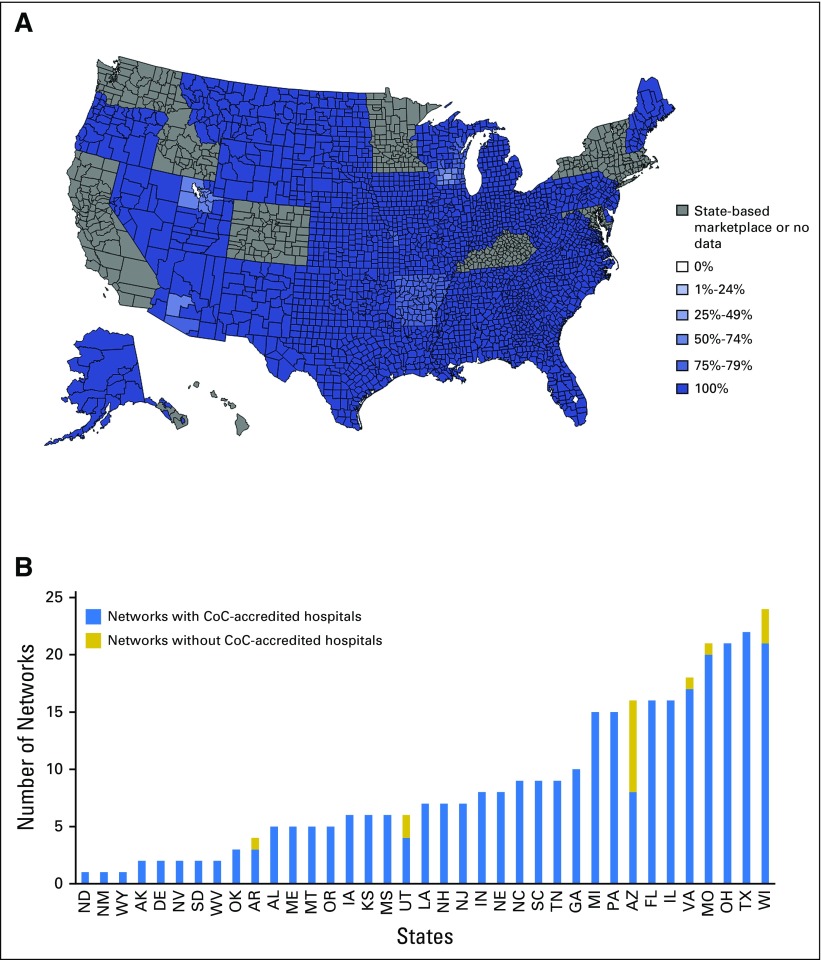
Of the 295 networks analyzed, 95% contained at least one CoC-accredited hospital. In 2,469 (95%) of 2,595 counties and 31 (84%) of 37 states with network data, every listed network contained at least one such hospital (Fig 1). Among counties, the mean proportion of networks containing CoC-accredited hospitals was 99% (98% after weighting by the number of plan selections in each county).
Fig 1.
(A) In-network Commission on Cancer (CoC) –accredited hospitals by county. The color of each county on the map indicates the proportion of networks containing at least one CoC-accredited hospital among all networks offered within that county for which data were uploaded to the Centers for Medicare and Medicaid Services. (B) In-network CoC-accredited hospitals by state (n = 295 networks). When networks were offered in more than one state (n = 21), they were counted once for each state in which they were offered.
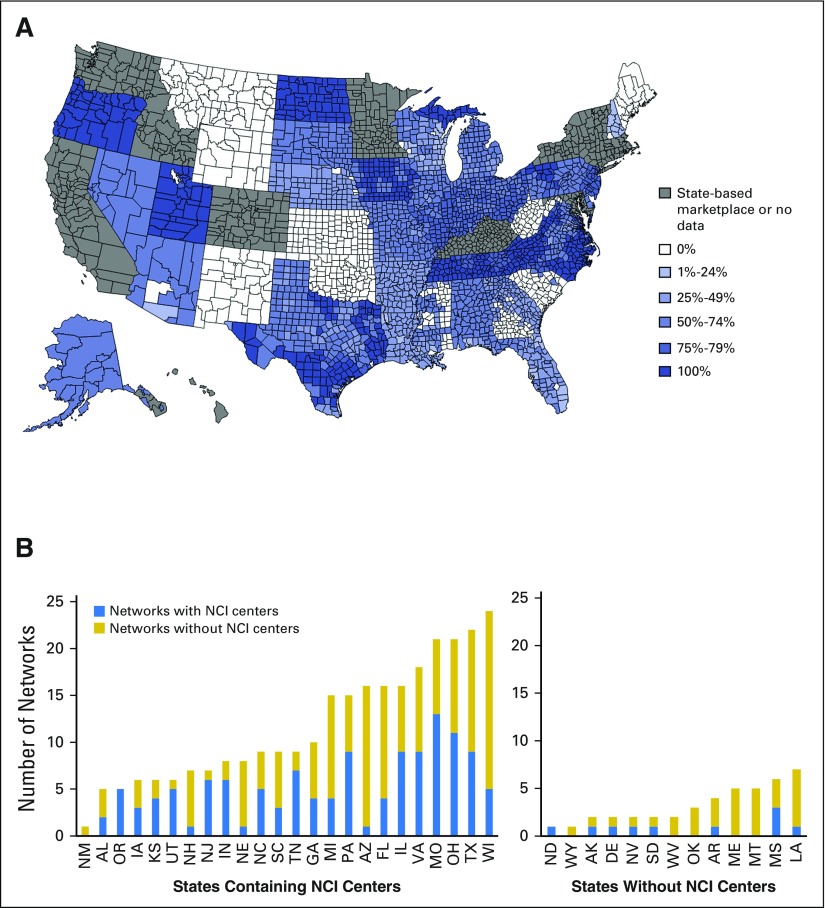
However, only 41% of the 295 networks contained NCI-designated cancer centers. Of the 61 NCI-designated centers assessed, including 37 located in states that use the federal exchange and 24 located in states with state-based exchanges, 45 NCI-designated cancer centers were included in at least one federal exchange network. Within states that use the federal exchange, there was variation across counties and states in the proportion of networks containing NCI-designated centers (range, 0% to 100% among each; Fig 2). In an analysis conducted by county in which networks were counted once for each county in which they were offered, the mean proportion of networks containing NCI-designated cancer centers was 51%. The mean proportion of networks containing NCI-designated cancer centers was 47% after weighting according to the number of plan selections in each county.
Fig 2.
(A) In-network National Cancer Institute (NCI) –designated centers by county. The color of each county on the map indicates the proportion of networks containing at least one NCI-designated center among all networks offered within that county for which data were uploaded to the Centers for Medicare and Medicaid Services. (B) In-network NCI-designated centers by state (n = 295 networks). When networks were offered in more than one state (n = 21), they were counted once for each state in which they were offered.
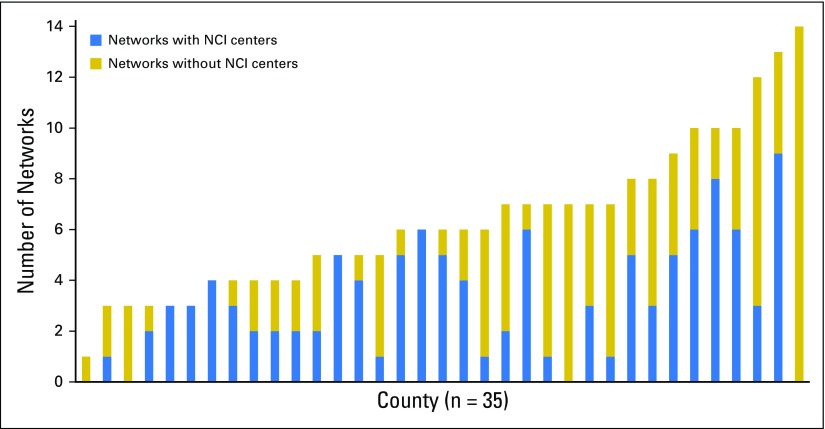
We then assessed rates of in-network access to NCI-designated cancer centers according to proximity to those hospitals, given the possibility that rates would be higher in locations that physically contain an NCI-designated cancer center. Among the 257 federal exchange networks offered in states in which at least one NCI-designated cancer center was located (n = 24 states with network data), 44% contained such a center; among the 38 networks offered only in states in which no NCI-designated cancer centers were physically located, 18% contained NCI-designated cancer centers (P = .003 for the association between networks containing NCI-designated centers and availability in states containing NCI-designated centers). Among the 174 networks offered in at least one county physically containing at least one NCI-designated cancer center (n = 35 counties with network data), 49% of networks contained an NCI-designated cancer center; among the 121 networks not available in any county physically containing an NCI-designated cancer center, 29% of networks contained any NCI-designated cancer centers (P < .001 for the association between networks containing NCI-designated cancer centers and availability in counties containing NCI-designated cancer centers). Among counties containing NCI-designated cancer centers, the proportion of in-county networks with an in-network center is demonstrated graphically in Appendix Figure A2 (online only).
Among 71 networks containing plans advertising a national network, 99% contained a CoC-accredited hospital and 51% contained an NCI-designated cancer center. Among the 224 remaining networks without a national network designation, 93% contained a CoC-accredited hospital, and 38% contained an NCI-designated cancer center (P = .13 for the association between national network designation and inclusion of CoC-accredited hospitals; P = .048 for the association between national network designation and inclusion of NCI-designated cancer centers).
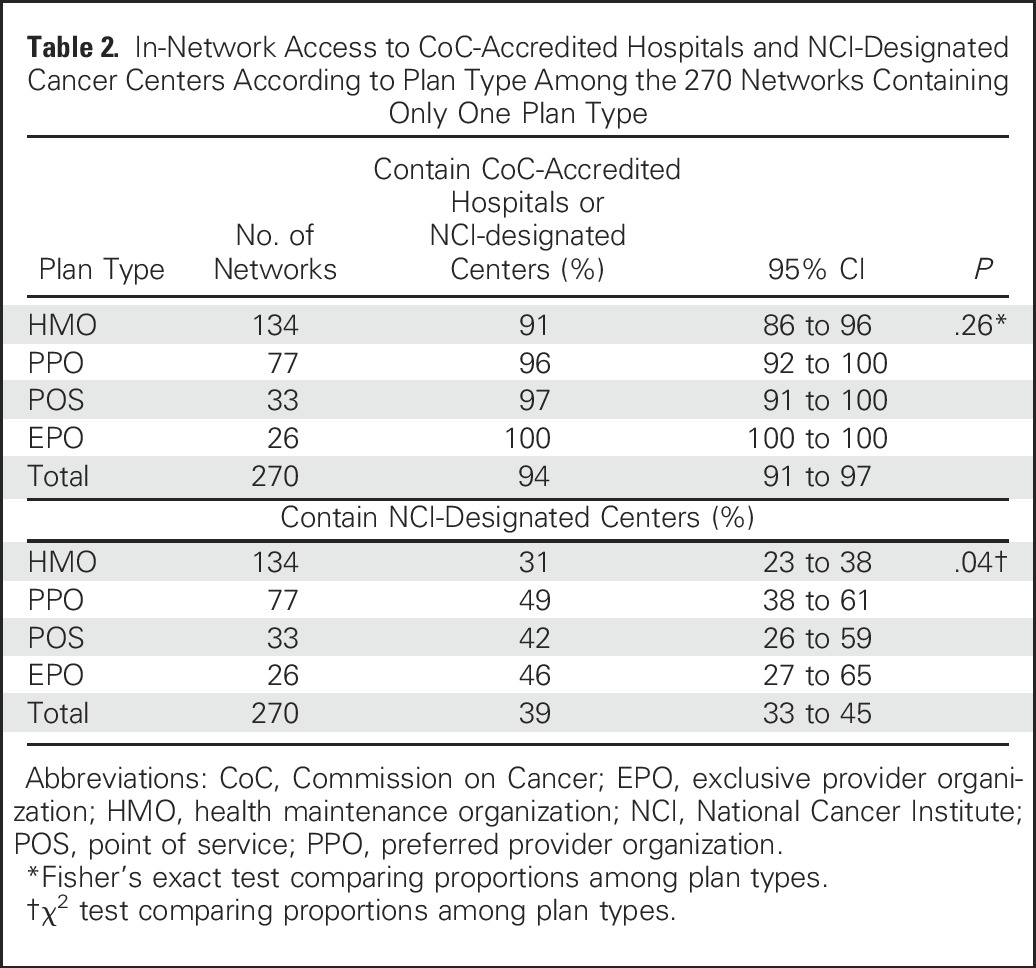
A large majority of networks (270 [92%]) were linked to plans of only one network type (ie, point-of-service, EPO, PPO, or HMO). Among these networks, inclusion of CoC-accredited hospitals ranged from 91% for HMOs to 100% for EPOs (P = .26; Table 2). Inclusion of NCI-designated cancer centers ranged from 31% for HMOs to 49% for PPOs (P = .04; Table 2).
Table 2.
In-Network Access to CoC-Accredited Hospitals and NCI-Designated Cancer Centers According to Plan Type Among the 270 Networks Containing Only One Plan Type
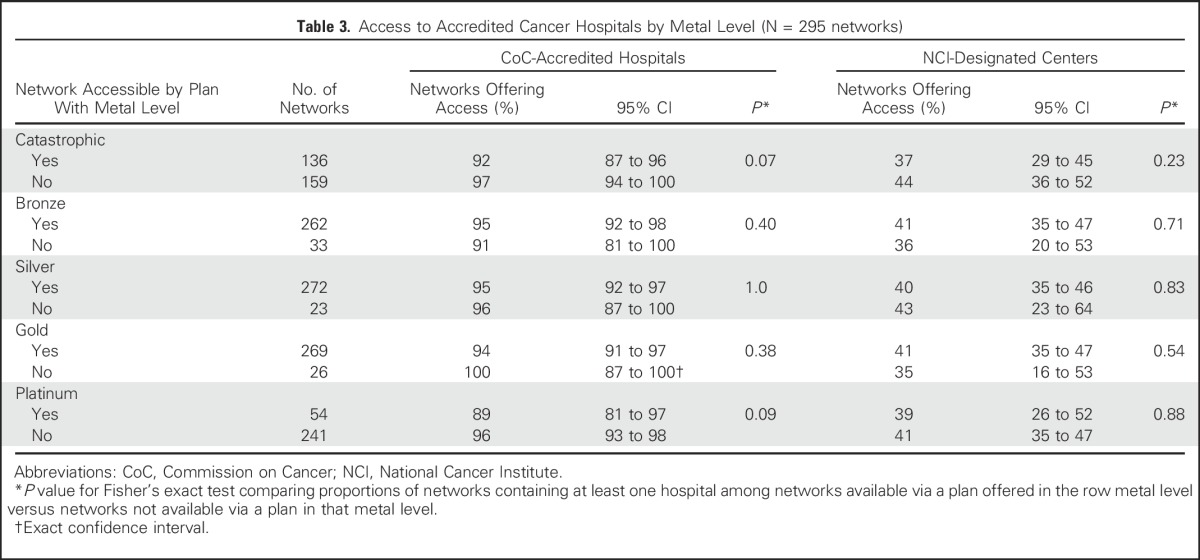
Most networks (92%) were accessible by plans across multiple metal levels; 46% were accessible by at least one catastrophic plan, 89% by at least one bronze plan, 92% by at least one silver plan, 91% by at least one gold plan, and 18% by at least one platinum plan. There was no association between the metal levels of plans offered in each network and inclusion of CoC-accredited hospitals or NCI-designated cancer centers (Table 3).
Table 3.
Access to Accredited Cancer Hospitals by Metal Level (N = 295 networks)
DISCUSSION
In this comprehensive analysis of federal exchange network data, we found that a large majority of networks contained CoC-accredited hospitals, but only 41% contained NCI-designated cancer centers. We also found that, as expected, networks available in states and counties that physically contain NCI-designated cancer centers were more likely to contain such a center; however, even within those geographic locations, only half the networks contained NCI-designated cancer centers. Networks offered by plans advertising national networks were somewhat more likely to contain both CoC-accredited hospitals and NCI-designated cancer centers, and networks offered by HMO plans were less likely to contain NCI-designated cancer centers.
We did not find variation in access to either category of hospitals on the basis of the metal levels of plans through which provider networks were accessible. This result was not surprising because a large majority of networks were linked to plans across more than one metal level, and metal levels are defined according to their cost-sharing structure rather than network or benefit characteristics. However, it serves as an important reminder to exchange customers that a choice of a gold rather than a silver plan largely constitutes a decision regarding cost-sharing and will not necessarily facilitate access to specialized care.
The issue of insurance network breadth is becoming increasingly important in health services and policy research focused on access to care.5-8,14,25,26 The ACA required guaranteed issue of insurance plans and prohibited price discrimination according to health status, such that narrow networks might constitute both a way to control premiums and one remaining mechanism for selection against sicker individuals. However, even a relatively broad network, defined according to the proportion of rating area providers included,11 could functionally restrict access for specific patient populations if it excludes, for example, academic medical centers or specialty hospitals. This issue is particularly relevant for patients with cancer, because other protective ACA provisions, including the requirement that insurance plans cover the standard-of-care costs of clinical trials and a cap on annual out-of-pocket costs, apply only to in-network care. Only the wealthiest of patients could readily afford a full course of out-of-network cancer treatment. Patients who might benefit from highly specialized care but do not have in-network access are therefore likely to be either functionally excluded or subject to the substantial financial toxicity30 of attempting to pay full, nondiscounted, out-of-pocket rates.
The high proportion of networks that contain CoC-accredited hospitals is reassuring with respect to access to cancer care. Nevertheless, the relatively low proportion of networks containing NCI-designated cancer centers is notable. Observational evidence in multiple tumor types, both common and rare, indicates that patients treated at large-volume teaching hospitals, including NCI-designated cancer centers, may have improved outcomes.24,31-34 Although such studies may be vulnerable to referral bias, our results indicate that patients who obtain health insurance through most networks on the federal exchange do not have in-network access to these centers. In an era when fewer than 5% of adults with cancer participate in clinical trials,16-20 these network structures could constitute an important barrier to enrollment at a category of centers that conduct on-site clinical research.
Strengths of our analysis included its novel application of newly available provider network data to the issue of access to cancer care within provider networks available in exchange plans. Nevertheless, there are limitations. Our analysis relied upon accurate and complete data being uploaded by insurers, and 10% of plans did not have network data available; in addition, 4% of unique networks were excluded because of the lack of hospital network information. It is therefore possible that our results could change slightly if all carriers provided complete data. It is also possible that inaccurate listings provided by carriers could affect our results; this limitation could have a direct impact on the use of these data by patients shopping for particular plans on the federal exchange to whom these provider network data are now available in beta form. However, it would be less likely to systematically change our reported proportions in this broad cross-carrier sample. This analysis also represented a snapshot in time at the beginning of the 2016 open enrollment period, and provider networks can be dynamic; indeed, patients who choose a plan because its network includes a specific provider or hospital have no guarantee that the network will continue to do so. Nevertheless, insurers are required to update their machine-readable data at least monthly,35 and these same techniques could be used to follow the provider network landscape over time.
These data also do not address the possibility that patients might be able to appeal to insurers for access to out-of-network care, although the burden of such a process, as well as the likelihood of success, may be highly variable. In addition, these data do not measure how often patients may benefit from the expertise of a specialized center without being seen at that center via mechanisms ranging from informal consultation to affiliations between NCI-designated cancer centers and community sites. Still, such arrangements may vary widely by institution, and patients without in-network access to NCI-designated facilities are still likely to have more difficulty accessing specialized services or clinical trials offered exclusively at such hospitals. These results highlight the importance of efforts to export specialized care and clinical trials to the community when feasible.
This analysis was restricted to networks offered in states that have not established their own independent marketplaces; some of the largest states, including California and New York, have done so. In addition, using the current data set, we could not compare in-network access to cancer hospitals within exchange plans to access within other types of insurance, including employer-sponsored and Medicaid plans. Many states have “any willing provider” laws, which prohibit insurers from excluding providers who are willing to agree to the insurer’s terms for inclusion in-network36; therefore, exclusion of NCI-designated cancer centers from exchange networks may result from a combination of insurers’ cost control efforts and reluctance on behalf of institutions to accept the reimbursement rates offered. A comparison of access to specialized centers across insurance types, including employer-sponsored and publicly funded managed care plans, constitutes an important remaining research question.
Finally, following the ACA, the number of uninsured people in the United States has decreased substantially.4 Without reform, many patients now insured through the exchanges would not have coverage at all, and might be even less able to access cancer care. Still, these results provide insight into the potential impact of residual underinsurance despite health reform.
In conclusion, we found that most federal exchange networks under the ACA contain CoC-accredited cancer care hospitals, but that the majority do not include NCI-designated cancer centers. There is also substantial geographic variation in access to NCI-designated cancer centers, but even in locations that physically contain such institutions, only half the networks offer access. These results may inform subsequent policy around access to cancer care, and given the greater limitations we identified on access to referral centers compared with community-based cancer hospitals, they also reinforce the importance of promoting access to specialized care and clinical trials through community sites.
Appendix
Database structure
Beginning with the 2016 plan enrollment year, insurance carriers selling plans on the federal exchange are required to upload their provider network information in the machine-readable JavaScript Object Notation (JSON) format. These files contain provider and facility names, addresses, National Provider Identifier (NPI) numbers, and issuer-specific network tiers for each health plan. These data are indexed by the Centers for Medicare and Medicaid Services (CMS) machine-readable data public use file available at https://www.cms.gov/cciio/resources/data-resources/marketplace-puf.html.
By using scripts written in the Ruby programming language, we downloaded all provider network JSON files indexed by the CMS public use file. We then parsed each JSON file and combined the contents of all such files into one large comma separated value file. We imported this comma separated value file into SAS version 9.3 and used SAS PROC FREQ to identify all unique combinations of NPI numbers and carrier-specified network tiers.
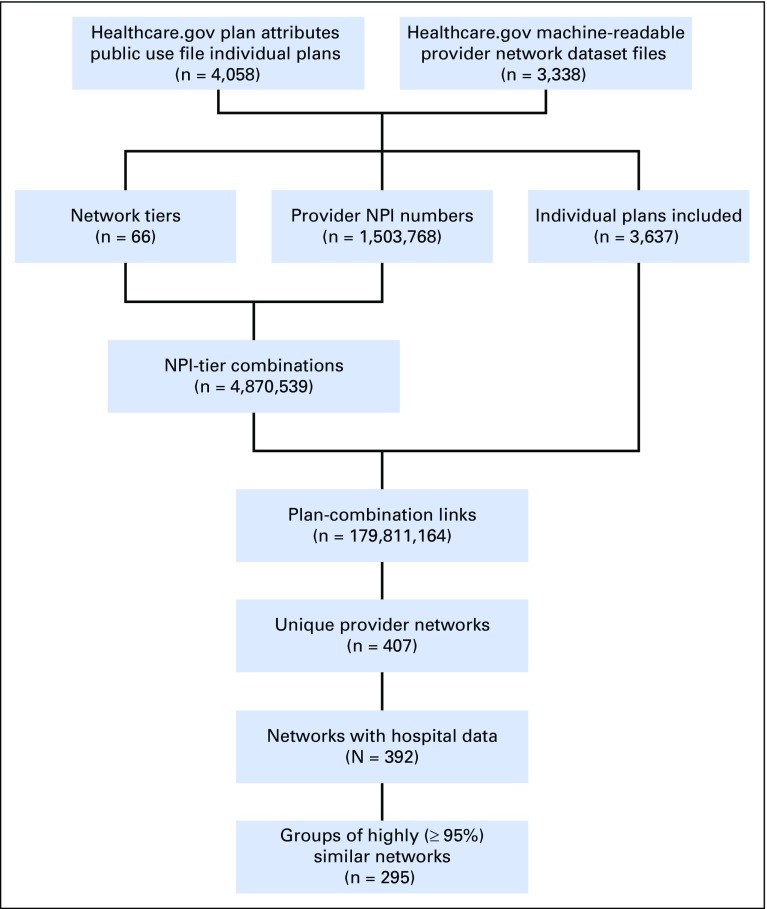
For each health plan with data available (n= 3,637), we then identified its list of provider-tier combinations. We used another Ruby script to compare each plan’s list to each other plan’s list, which allowed us to retain a new list of the unique provider networks (n = 407). We found that 15 of these networks did not contain in-network hospital information, and therefore we excluded those networks. This left the network data for 3,531 plans for further analysis.
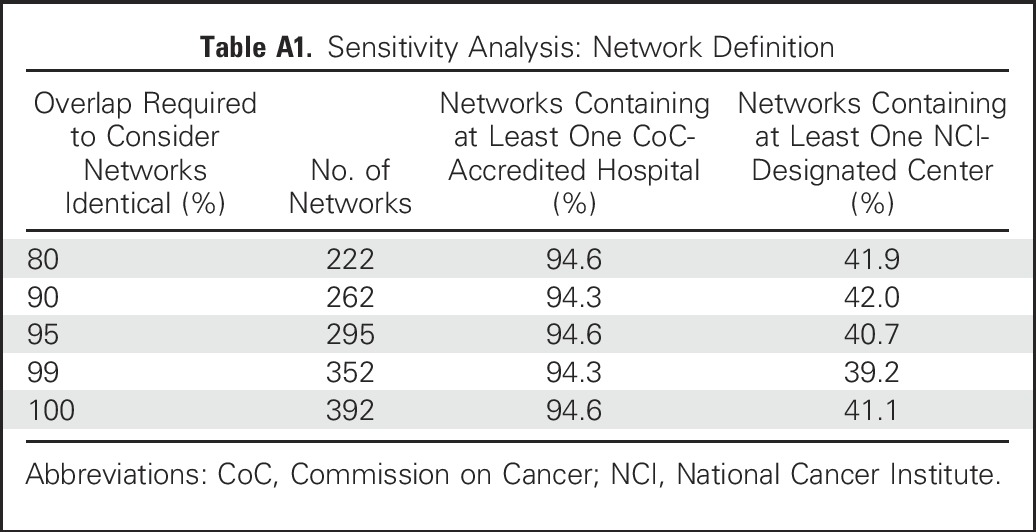
On initial review of the data, it became evident that these unique provider networks were frequently quite similar to each other. We therefore created groups of networks in which the intersection of the first network in each group and each subsequent network comprised at least 95% of each of the two networks. These new networks, each a group of one or more quite similar networks (n = 295), constituted the primary unit of subsequent analysis. We also conducted sensitivity analyses in which the overlap required to consider networks identical varied from 80% to 100%, and end results of analyses were similar (see Appendix Table A1).
Table A1.
Sensitivity Analysis: Network Definition
In addition, we conducted another analysis to determine how often the allowed 5% variation among networks in our principal analysis itself contained a National Cancer Institute (NCI) –designated cancer center. If this occurred frequently, our analyses of the proportion of networks containing NCI-designated cancer centers could have been overestimates, because the entire group of networks would be considered to contain an NCI-designated cancer center if at least one affiliated network did. However, we found only one group of networks at the 95% overlap threshold for which this was the case.
We then exported our provider network data back into SAS and also linked the data to additional plan information contained within the Plan Attributes Public Use File also available from CMS. This allowed us to additionally link the data to county-level plan selection information, as discussed in the article. Our database assembly procedure is illustrated in Figure A1.
Identification of Hospital NPI Numbers
Hospitals reporting Commission on Cancer accreditation were identified by using the 2014 American Hospital Association survey data set (n = 1,455). Their NPI numbers were identified by using a combination of the American Hospital Association survey and automated searches of the NPI registry Web site (https://npiregistry.cms.hhs.gov/). NCI-designated cancer centers (clinical centers and comprehensive cancer centers; n = 61) were identified by using the NCI Web site (http://www.cancer.gov/research/nci-role/cancer-centers/find). Of the 69 total NCI-designated cancer centers, the seven laboratory-only cancer centers were excluded, leaving 62 clinical centers. The University of Hawaii was also excluded because its primary affiliated clinical operations are distributed among several hospitals. The NPI numbers for principal hospitals of each center (n = 67) were similarly identified by using automated searches of the NPI registry. To avoid inappropriate inclusion of NPI numbers that did not represent the corresponding acute care hospital, NPI numbers from the automated search were included only if their primary taxonomy category listings contained “HOSPITAL” or “CLINIC.” NPIs specifically containing taxonomy categories representing pharmacies, laboratories, mental health, radiology, family planning, renal, and physical therapy departments were also excluded. Frequently, multiple NPI numbers were listed for each Commission on Cancer–accredited hospital or NCI-designated cancer center, so networks were queried by using all NPI numbers for each hospital.
Fig A1.
Database components. NPI, national provider identifier.
Fig A2.
In-network National Cancer Institute (NCI) –designated centers within counties containing NCI-designated cancer centers. Each vertical bar represents one of the 35 counties in federal exchange states that contain NCI-designated cancer centers. When networks were available in more than one such county, they were counted once for each county in which they were available.
Footnotes
This manuscript was supported by grant number P30 CA016672.
Presented in part at the 52nd Annual Meeting of the American Society of Clinical Oncology, Chicago, IL, June 3-7, 2016.
Listen to the podcast by Dr Dusetzina at ascopubs.org/jco/podcasts
AUTHOR CONTRIBUTIONS
Conception and design: Kenneth L. Kehl, Trudy M. Krause, Sharon H. Giordano
Collection and assembly of data: Kenneth L. Kehl
Data analysis and interpretation: All authors
Manuscript writing: All authors
Final approval of manuscript: All authors
Accountable for all aspects of the work: All authors
AUTHORS’ DISCLOSURES OF POTENTIAL CONFLICTS OF INTEREST
Access to Accredited Cancer Hospitals Within Federal Exchange Plans Under the Affordable Care Act
The following represents disclosure information provided by authors of this manuscript. All relationships are considered compensated. Relationships are self-held unless noted. I = Immediate Family Member, Inst = My Institution. Relationships may not relate to the subject matter of this manuscript. For more information about ASCO's conflict of interest policy, please refer to www.asco.org/rwc or ascopubs.org/jco/site/ifc.
Kenneth L. Kehl
No relationship to disclose
Kai-Ping Liao
No relationship to disclose
Trudy M. Krause
No relationship to disclose
Sharon H. Giordano
No relationship to disclose
REFERENCES
- 1.Patient Protection and Affordable Care Act, 42 USC § 18001 (2010).
- 2.Department of Health and Human Services Key Features of the Affordable Care Act by Year. http://www.hhs.gov/healthcare/facts/timeline/timeline-text.html
- 3.Sommers BD, Musco T, Finegold K, et al. Health reform and changes in health insurance coverage in 2014. N Engl J Med. 2014;371:867–874. doi: 10.1056/NEJMsr1406753. [DOI] [PubMed] [Google Scholar]
- 4.Sommers BD, Gunja MZ, Finegold K, et al. Changes in self-reported insurance coverage, access to care, and health under the Affordable Care Act. JAMA. 2015;314:366–374. doi: 10.1001/jama.2015.8421. [DOI] [PubMed] [Google Scholar]
- 5.Haeder SF, Weimer DL, Mukamel DB. Narrow networks and the Affordable Care Act. JAMA. 2015;314:669–670. doi: 10.1001/jama.2015.6807. [DOI] [PubMed] [Google Scholar]
- 6.Haeder SF, Weimer DL, Mukamel DB. California hospital networks are narrower in marketplace than in commercial plans, but access and quality are similar. Health Aff (Millwood) 2015;34:741–748. doi: 10.1377/hlthaff.2014.1406. [DOI] [PubMed] [Google Scholar]
- 7.Dorner SC, Jacobs DB, Sommers BD. Adequacy of outpatient specialty care access in marketplace plans under the Affordable Care Act. JAMA. 2015;314:1749–1750. doi: 10.1001/jama.2015.9375. [DOI] [PubMed] [Google Scholar]
- 8.Avalere Health: Exchange Plans Include 34% Fewer Providers than the Average for Commercial Plans. http://avalere.com/expertise/managed-care/insights/exchange-plans-include-34-percent-fewer-providers-than-the-average-for-comm
- 9.The Commonwealth Fund Implementing the Affordable Care Act State Regulation of Marketplace Plan Provider Networks. http://www.commonwealthfund.org/publications/issue-briefs/2015/may/state-regulation-of-marketplace-plan-provider-networks [PubMed]
- 10.Department of Health and Human Services. 45 CFR Parts 155, 156, and 157 [CMS-9989-F] RIN 0938-AQ67 Patient Protection and Affordable Care Act; Establishment of Exchanges and Qualified Health Plans; Exchange Standards for Employers. Federal Register, Volume 77, No. 59, Tuesday, March 27, 2012 [PubMed]
- 11.McKinsey and Company: Hospital networks: Updated national view of configurations on the exchanges. http://healthcare.mckinsey.com/hospital-networks-updated-national-view-configurations-exchanges
- 12.Polsky D, Weiner J: The Skinny on Narrow Networks in Health Insurance Marketplace Plans. Robert Wood Johnson Foundation, 2015
- 13.Center for Medicare and Medicaid Services: CY2016 MA HSD Provider and Facility Specialties and Network Adequacy Criteria Guidance.https://www.cms.gov/Medicare/Medicare-Advantage/MedicareAdvantageApps/Downloads/CY2016_MA_HSD_Network_Criteria_Guidance.pdf
- 14.Schleicher SM, Mullangi S, Feeley TW. Effects of narrow networks on access to high-quality cancer care. JAMA Oncol. 2016;2:427–428. doi: 10.1001/jamaoncol.2015.6125. [DOI] [PubMed] [Google Scholar]
- 15.American Society of Clinical Oncology Summary of the Affordable Care Act Statute Regarding Insurance Coverage for Individuals Participating in Approved Clinical Trials. http://www.asco.org/sites/default/files/aca_summary_clinical_trials.pdf
- 16.Nass SJ, Moses HL, Mendelsohn J (eds): A National Cancer Clinical Trials System for the 21st Century: Reinvigorating the NCI Cooperative Group Program. Committee on Cancer Clinical Trials and the NCI Cooperative Group Program. Washington, DC, Institute of Medicine, National Academies Press, 2010 [PubMed] [Google Scholar]
- 17.Fouad MN, Lee JY, Catalano PJ, et al. Enrollment of patients with lung and colorectal cancers onto clinical trials. J Oncol Pract. 2013;9:e40–e47. doi: 10.1200/JOP.2012.000598. [DOI] [PMC free article] [PubMed] [Google Scholar]
- 18.Stewart JH, Bertoni AG, Staten JL, et al. Participation in surgical oncology clinical trials: Gender-, race/ethnicity-, and age-based disparities. Ann Surg Oncol. 2007;14:3328–3334. doi: 10.1245/s10434-007-9500-y. [DOI] [PubMed] [Google Scholar]
- 19.Kehl KL, Arora NK, Schrag D, et al. Discussions about clinical trials among patients with newly diagnosed lung and colorectal cancer J Natl Cancer Inst 106(10)2014 [DOI] [PMC free article] [PubMed] [Google Scholar]
- 20.Murthy VH, Krumholz HM, Gross CP. Participation in cancer clinical trials: Race-, sex-, and age-based disparities. JAMA. 2004;291:2720–2726. doi: 10.1001/jama.291.22.2720. [DOI] [PubMed] [Google Scholar]
- 21.American College of Surgeons Searching for Cancer Centers. https://www.facs.org/search/cancer-programs
- 22.American Hospital Association Fast Facts on US Hospitals. http://www.aha.org/research/rc/stat-studies/fast-facts.shtml
- 23.Bilimoria KY, Stewart AK, Winchester DP, et al. The National Cancer Data Base: A powerful initiative to improve cancer care in the United States. Ann Surg Oncol. 2008;15:683–690. doi: 10.1245/s10434-007-9747-3. [DOI] [PMC free article] [PubMed] [Google Scholar]
- 24.Wolfson JA, Sun CL, Wyatt LP, et al. Impact of care at comprehensive cancer centers on outcome: Results from a population-based study. Cancer. 2015;121:3885–3893. doi: 10.1002/cncr.29576. [DOI] [PMC free article] [PubMed] [Google Scholar]
- 25.Avalere: Leading Cancer Centers May Be More Widely Included in Exchange Networks than Expected. http://avalere.com/outlook/life-sciences/insights/leading-cancer-centers-may-be-more-widely-included-in-exchange-networks-tha
- 26.Alonso-Zaldivar R: Affordable Care Act Law Raises Concerns About Cancer Centers. The Ledger. http://www.theledger.com/article/20140318/NEWS/140319138
- 27.Center for Medicare and Medicaid Services: Health Insurance Marketplace Public Use Files (Marketplace PUF). www.cms.gov/CCIIO/Resources/Data-Resources/marketplace-puf.html
- 28.Center for Medicare and Medicaid Services https://www.cms.gov/CCIIO/Resources/Regulations-and-Guidance/Downloads/2016-Letter-to-Issuers-2-20-2015-R.pdf Final 2016 Letter to Issuers in the Federally-facilitated Marketplaces.
- 29.Department of Health and Human Service,, Office of The Assistant Secretary for Planning and Evaluation: Plan Selections by ZIP Code and County in the Health Insurance Marketplace: March 2016. https://aspe.hhs.gov/basic-report/plan-selections-zip-code-and-county-health-insurance-marketplace-march-2016
- 30.Zafar SY, Peppercorn JM, Schrag D, et al. The financial toxicity of cancer treatment: A pilot study assessing out-of-pocket expenses and the insured cancer patient’s experience. Oncologist. 2013;18:381–390. doi: 10.1634/theoncologist.2012-0279. [DOI] [PMC free article] [PubMed] [Google Scholar]
- 31.Gutierrez JC, Perez EA, Moffat FL, et al. Should soft tissue sarcomas be treated at high-volume centers? An analysis of 4205 patients. Ann Surg. 2007;245:952–958. doi: 10.1097/01.sla.0000250438.04393.a8. [DOI] [PMC free article] [PubMed] [Google Scholar]
- 32.Cheung MC, Koniaris LG, Perez EA, et al. Impact of hospital volume on surgical outcome for head and neck cancer. Ann Surg Oncol. 2009;16:1001–1009. doi: 10.1245/s10434-008-0191-9. [DOI] [PubMed] [Google Scholar]
- 33.Cheung MC, Hamilton K, Sherman R, et al. Impact of teaching facility status and high-volume centers on outcomes for lung cancer resection: An examination of 13,469 surgical patients. Ann Surg Oncol. 2009;16:3–13. doi: 10.1245/s10434-008-0025-9. [DOI] [PubMed] [Google Scholar]
- 34.Bristow RE, Chang J, Ziogas A, et al. Impact of national cancer institute comprehensive cancer centers on ovarian cancer treatment and survival. J Am Coll Surg. 2015;220:940–950. doi: 10.1016/j.jamcollsurg.2015.01.056. [DOI] [PMC free article] [PubMed] [Google Scholar]
- 35.Center for Medicare and Medicaid Services https://www.cms.gov/CCIIO/Resources/Data-Resources/Downloads/Disclaimer_for_Machine_Readable.pdf CMS Disclaimer for Machine-Readable URL Public Use File (PUF).
- 36.Hellinger FJ. Any-willing-provider and freedom-of-choice laws: An economic assessment. Health Aff (Millwood) 1995;14:297–302. doi: 10.1377/hlthaff.14.4.297. [DOI] [PubMed] [Google Scholar]


