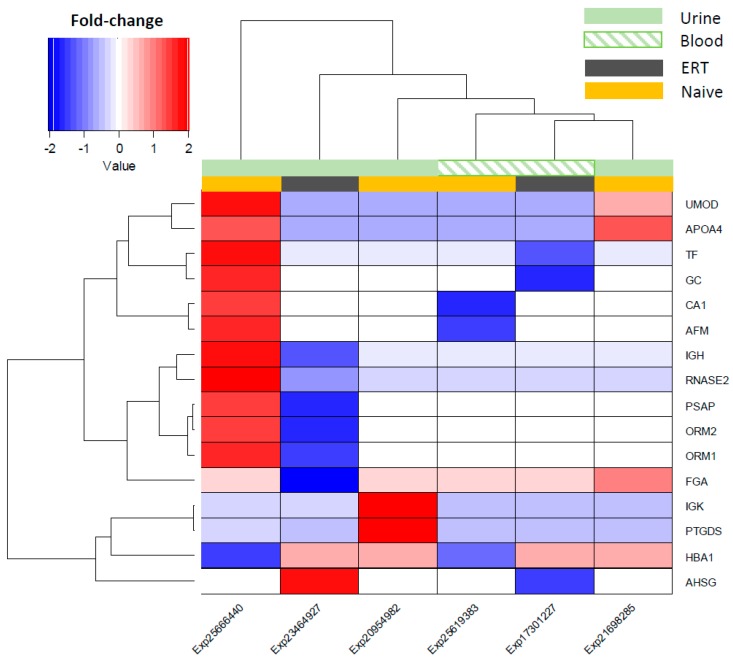
Figure 3.
Hierarchical clustering of the differential molecular expression across Fabry studies and by fluid source. Decreased expression shown in a blue and increased expression by the red colour gradient. Group modulation for the urine fluid source is shown as light green in a block, whereas for the blood it is presented as a light green pattern. Group modulation representing the type of treatment is shown as dark-grey blocks for ERT patients and light-orange blocks for the non-treated patients (naïve group).

