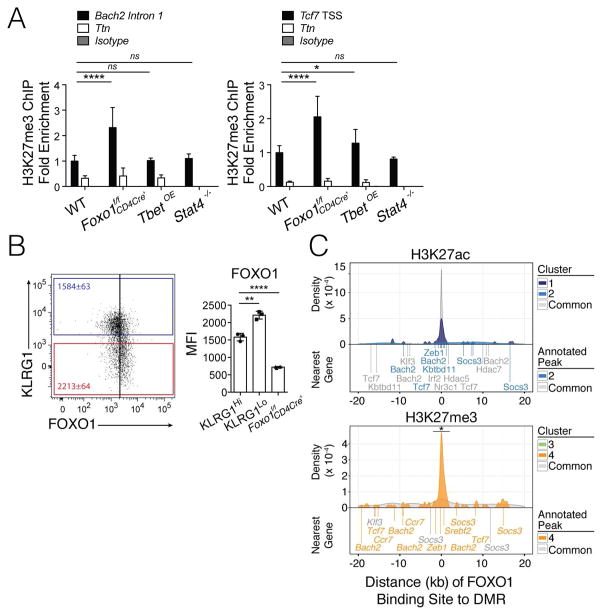
Figure 7. FOXO1 regulates H3K27me3 deposition.
A) WT (control cells infected with empty-vector-GFP retrovirus), Foxo1f/f CD4Cre+, Tbet-overexpressing (TbetOE), and Stat4−/− KLRG1Hi IL7RLo (TE) Thy1.1 P14+ CD8+ T cells were purified by FACS from infected mice from day 10 p.i. and ChIP-qPCR was performed for H3K27me3 using primers to the Tcf7 TSS and Bach2 intron 1 (black). A region within Ttn served as a negative control (white) for H3K27me3 based on genome-wide H3K27me3 ChIP-seq analysis. Data are cumulative from two (Stat4−/−), three (TbetOE), or four (Foxo1f/f CD4Cre+) independent experiments (n=2 [Stat4−/−], 7 [TbetOE], or 11 [Foxo1f/f CD4Cre+] mice/per group) with percentage of input for each sample normalized internally to the percentage of input of WT, thereby calculating fold enrichment relative to WT as plotted.
B) Bar graph shows FOXO1 protein levels in KLRG1Hi and KLRG1Lo WT P14+ CD8+ T cells and Foxo1f/f CD4Cre+ P14+ CD8+ T cells at d10 p.i. with LCMV-Armstrong in vivo.
Data are expressed as mean ± SD. *p<0.05, **p<0.01, ****p<0.0001
C) Significant FOXO1 binding sites (p-value < 10−5) identified by ChIP-seq from naive CD8+ T cells (GSE46943) were annotated to the nearest consensus peak. Density plots were calculated from the distribution of distances from a FOXO1 binding site to the nearest consensus peak and visualized separately for DMRs versus Common regions for H3K27ac (top) and H3K27me3 (bottom). Select genes associated with FOXO1 binding are noted below the density plots, and colored according to Cluster 1–4 or Common. See also Figure S7.

