

Abstract
Purpose
To determine whether adding the multidrug resistance gene-1 (MDR-1) modulator valspodar (PSC 833; Novartis Pharmaceuticals, Hanover, NJ) to chemotherapy provided clinical benefit to patients with poor-risk acute myeloid leukemia (AML) and high-risk myelodysplastic syndrome (MDS).
Patients and Methods
A phase III randomized study was performed using valspodar plus mitoxantrone, etoposide, and cytarabine (PSC-MEC; n = 66) versus MEC (n = 63) to treat patients with relapsed or refractory AML and high-risk MDS.
Results
For the PSC-MEC versus MEC arms, complete response (CR) was achieved in 17% versus 25% of patients, respectively (P = not significant). For patients who had not received prior intensive chemotherapy (ie, with secondary AML or high-risk MDS), the CR rate was increased—35% versus 15% for the remaining patients (P = .018); CR rates did not differ between treatment arms. The median disease-free survival in those achieving CR was similar in the two arms (10 versus 9.3 months) as was the patients’ overall survival (4.6 versus 5.4 months). The CR rates in MDR+ (69% of patients) versus MDR− patients were similar for those receiving either chemotherapy regimen (16% versus 24%). The CR rate for unfavorable cytogenetic patients (45% of patients) was 13% compared to the remainder, 28% (P = .09). Population pharmacokinetic analysis demonstrated that the clearances of mitoxantrone and etoposide were decreased by 59% and 50%, respectively, supporting the empiric dose reductions in the PSC-MEC arm designed in anticipation of drug interactions between valspodar and the chemotherapeutic agents.
Conclusion
CR rates and overall survival were not improved by using PSC-MEC compared to MEC chemotherapy alone in patients with poor-risk AML or high-risk MDS.
INTRODUCTION
Patients with acute myeloid leukemia (AML) who have relapsed or are refractory to conventional chemotherapy, those whose disease develops after antecedent chemotherapy or evolves from a prior myeloid stem-cell disorder, or those with high-risk myelodysplastic syndromes (MDS) have poorer responses and prognoses to chemotherapy compared to those with de novo AML [1–3]. Over-expression of the multidrug resistance (MDR-1) gene product p170-glycoprotein (P-gp) is one of the mechanisms associated with poor responses of these patients [4–7]. A number of adverse prognostic variables such as age, CD34 expression, karyotypic pattern, or secondary leukemia (due to prior cytotoxic therapy or an antecedent myelodysplastic syndrome) have also been linked to P-gp overexpression [8–11].
Cells which over-express MDR-1 are cross-resistant to several important antileukemic drugs including anthracyclines and epipodophyllotoxins (eg, mitoxantrone and etoposide) [4,5]. Cells with the MDR phenotype are characterized by lower intracellular drug accumulation [6,7,12,13] concomitant with reduced sensitivity to these agents [7,8,13]. Several drugs capable of modulating and decreasing MDR-1, such as quinine, tamoxifen, calcium channel blockers, cyclosporine A, and its analog valspodar (PSC 833; Novartis Pharmaceuticals, Hanover, NJ), have been used for treating poor-risk AML [14–17]. Addition of cyclosporine A to an induction and consolidation regimen containing infusional daunorubicin significantly reduced resistance to this drug, prolonged the duration of remission, and improved overall survival in patients with poor-risk AML [15].
Valspodar is a more potent inhibitor of the P-gp efflux pump than cyclosporine, inhibiting efflux of MDR-related cytotoxic chemotherapy without the immunosuppression or renal toxicity of the parent compound [18–21]. A phase II study performed by Eastern Cooperative Oncology Group-(ECOG) affiliated institutions in refractory/relapsed AML with valspodar plus mitoxantrone, etoposide, cytarabine (PSC-MEC) demonstrated pharmacokinetic (PK) interactions of valspodar with these drugs and suggested the potential efficacy, need, and tolerance of substantial dose reduction of mitoxantrone and etoposide in the valspodar-containing arm of this study [17]. These PK interactions of valspodar had previously been demonstrated [22,23]. In another phase I/II study, combined treatment with infused valspodar and daunorubicin was well tolerated and had beneficial activity in patients with poor-risk AML [24]. To test the hypothesis that MDR modulation would improve chemotherapeutic responses in AML patients with a potential high incidence of MDR expression, we performed a phase III randomized trial comparing PSC-MEC to MEC chemotherapy in patients with poor-risk AML and high-risk MDS. We also evaluated the level of P-gp expression by leukemic blast cells, using functional and phenotypic flow cytometric analyses.
PATIENTS AND METHODS
Patients
Eligibility for study entry included a diagnosis of AML or high-risk MDS. Patients were categorized and stratified as: (1) relapse less than 6 months after first complete remission (CR; ie, early first relapse); (2) relapse after allogeneic or autologous bone marrow transplantation; (3) second or greater relapse; (4) refractory to induction chemotherapy; (5) secondary AML, AML evolving from MDS, or myeloproliferative disorder (not chronic myeloid leukemia); and (6) high-risk MDS.
High-risk MDS was defined as MDS patients with refractory anemia with excess blasts in transformation (ie, with 21% to 30% marrow myeloblasts) according to the French-American-British classification and refractory anemia with excess blasts patients with more than 10% marrow blasts plus either poor-risk cytogenetics or bi/pancytopenia [25].
Patients were aged 15 to 70 years, with no history of recent myocardial infarction or significant cardiac arrhythmia, no inter-current organ damage or medical problems that would prohibit therapy, no active or unresolved infection, no past evidence of invasive fungal infection, no hypersensitivity to ingredients of the study medication, including polyoxyethylated castor oil, no chemotherapy or radiotherapy for 4 weeks before study entry except for patients refractory to induction chemotherapy, and ECOG performance status of 0 to 2. All patients reviewed and signed an institutional review board approved consent form.
Treatment Plan
Patients randomly assigned to PSC-MEC received valspodar 2 mg/kg intravenous (IV) loading dose, then 10 mg/kg/d for 5 days; mitoxantrone 4 mg/m2/d IV push for days 1 to 5; etoposide 40 mg/m2/d IV for days 1 to 5 over 30 to 60 minutes; and cytarabine 1 gm/m2/d IV for days 1 to 5 over 1 hour. For the MEC arm, patients received mitoxantrone 8 mg/m2/d, etoposide 100 mg/m2/d, cytarabine 1 gm/m2/d, all within days 1 to 5. This dosing schedule for the valspodar-containing arm was developed based on pharmacokinetic interactions of valspodar with mitoxantrone and etoposide [17].
A maximum of two induction cycles was permitted to achieve bone marrow aplasia. If the disease persisted thereafter, patients were removed from study and their disease was considered to have failed to respond to therapy. Patients who achieved a CR were scheduled to receive an additional cycle of consolidation therapy within 4 to 6 weeks of CR, the same as the chemotherapy arm to which they were initially randomly assigned.
MDR Expression
MDR positivity was defined based on P-gp function as established by the flow cytometric rhodamine123 efflux assay [26–27]. P-gp function was evaluated by establishing maximal CD34+ blast cellular rhodamine123 uptake and monitoring dye efflux during 1-hour cellular incubation at 37°C. The extent of P-gp function was expressed as percent rhodamine mean fluorescence channel shift between baseline and maximal dye efflux at the end of the incubation period. A shift of ≥40% from baseline was used as a threshold to define MDR positivity, as the extent of rhodamine efflux correlated with the degree of inhibitability by valspodar and cyclosporine; rhodamine efflux less than 40% was not inhibitable by these modulators. Inhibition of P-gp function by valspodar and cyclosporine, tested in all patients, was comparable (expressed as percentage of maximal shift). Expression of P-gp on CD34+ -gated cells (percentage of positive blasts) was assessed by surface binding of antibody MRK-16. Binding of MRK-16 to blast cells relative to background was also measured using Kolmogorov-Smirnov statistics, whereby the generated D value reflects the difference between the two binding curves.
Cytogenetics Methods
The ECOG Leukemia Committee’s Cytogenetics Subcommittee reviewed data submitted by institutional cytogenetic laboratories for each patient and based their evaluations on original karyotype preparations. Chromosome studies were considered acceptable for statistical analysis when there was documentation of 20 normal bone marrow metaphases or five or more abnormal blood or bone marrow metaphases. The presence or absence of chromosomally abnormal clones was examined by standard cytogenetics rules for nomenclature [28]. Patients were assigned to cytogenetics risk categories according to Southwest Oncology Group(SWOG)/ECOG guidelines [29].
Pharmacokinetic Studies
Venous blood samples for determination of mitoxantrone and etoposide were drawn on day 5 of treatment at 0, 0.1, 1.1, 2, 6, 8, 12, 24, 48 hours. Mitoxantrone and etoposide values were determined by high-performance liquid chromatography using modifications to previous methods [17,21,30–34]. PK analysis was performed for mitoxantrone and etoposide using NONMEM V (version 1.1, The Regents of the University of California, Berkeley, CA), implemented on PDx-Pop (version 1.1j release 4, Globomax LLC, Hanover, MD) [35,36]. Plasma concentrations of mitoxantrone and etoposide were described using 3- and 2-compartment models, respectively [37,38]. Fifty-four patients (388 etoposide levels and 418 mitoxantrone levels) receiving PSC-MEC and 48 patients (295 etoposide levels and 374 mitoxantrone levels) receiving MEC alone (102 total patients) were included in the PK analysis(79% of the patients assessable for response).Theinfluenceof valspodar was evaluated by curve-fitting analyses, which indicated good fit of the data, with P < .01. Areas under the curve (AUCs) were determined using Bayesian-estimated clearance values.
Statistical Analyses
Fisher’s exact tests [39] were used to analyze the contingency tables. The survival data were analyzed using the method of Kaplan and Meier [40] and the significance was tested by log-rank tests. Wilcoxon rank sum tests were used to compare continuous data between two groups [41]. Logistic regression was used for multivariate analyses. All P values reported were for two-sided tests. This study was designed to detect the improvement in the CR rate from 20% to 40% by addition of valspodar to MEC. In May 1999, the ECOG Data Monitoring Committee reviewed the data for this study at 40% information time, and recommended this study be closed to further patient accrual because of lack of superiority in achieving CR demonstrated in patients treated with PSC-MEC [42], resulting in early termination of the study.
RESULTS
Patient Characteristics
Of the 144 patients accrued, three patients who were randomly assigned to PSC-MEC and four patients randomly assigned to MEC were ineligible (did not meet study eligibility criteria). Of the 137 remaining eligible patients (69 patients in PSC-MEC arm, 68 in the MEC arm), five patients did not receive the therapy and three were considered pathology exclusions (ie, not AML). Therefore, 129 patients (66 in the PSC-MEC arm and 63 in the MEC arm) were considered assessable and included in the response analysis. The distributions of patient characteristics by treatment groups are summarized in Table 1. Patient characteristics were similar between the two treatment groups. The majority of patients were older than 50 years of age (70%), with a median age of 58 years (range, 17 to 71).
Table 1.
Demographic Characteristics of Assessable Patients (N = 129)
| PSC-MEC (n = 66) |
MEC (n = 63) |
|||
|---|---|---|---|---|
| No. of Patients |
% | No. of Patients |
% | |
| Age, years | ||||
| <50 | 20 | 30 | 18 | 29 |
| ≥50 | 46 | 70 | 45 | 71 |
|
| ||||
| Sex | ||||
| Male | 37 | 56 | 31 | 49 |
| Female | 29 | 44 | 32 | 51 |
|
| ||||
| Race | ||||
| White | 57 | 86 | 58 | 92 |
| Black | 4 | 6 | 1 | 2 |
| Other | 5 | 8 | 4 | 6 |
|
| ||||
| FAB classification of AML | ||||
| M1 | 17 | 26 | 21 | 33 |
| M2 | 12 | 18 | 6 | 10 |
| M4 | 5 | 8 | 2 | 3 |
| M5 | 1 | 2 | 3 | 5 |
| M6 | 1 | 2 | 3 | 5 |
| M7 | 0 | 0 | 2 | 3 |
| AML, not subclassified | 30 | 46 | 26 | 41 |
|
| ||||
| Disease status | ||||
| First relapse < 6 months | 14 | 21 | 15 | 24 |
| Relapse after BMT | 8 | 12 | 8 | 13 |
| ≥Two Relapses | 5 | 8 | 3 | 5 |
| Refractory | 19 | 29 | 17 | 27 |
| Secondary AML | 13 | 20 | 11 | 18 |
| High-risk MDS | 7 | 11 | 9 | 14 |
|
| ||||
| Cytogenetic risk category* | ||||
| Favorable | 3 | 5 | 3 | 6 |
| Intermediate | 18 | 32 | 17 | 34 |
| Unfavorable | 26 | 47 | 22 | 44 |
| Unknown | 9 | 16 | 8 | 16 |
|
| ||||
| Performance status | ||||
| 0 | 27 | 43 | 21 | 33 |
| 1 | 22 | 35 | 30 | 48 |
| 2 | 14 | 22 | 12 | 19 |
Abbreviations: PSC-MEC, valspodar plus mitoxantrone, etoposide, and cytarabine; MEC, mitoxantrone, etoposide, and cytarabine; FAB, French-American-British; AML, acute myeloid leukemia; BMT, bone marrow transplantation; MPS, myelodysplastic syndrome.
Reference [31].
Responses
Table 2 summarizes response data by treatment groups for the 129 assessable cases. The CR rate was 17% (11 of 66 patients) in the PSC-MEC arm and 25% (16 of 63 patients) in the MEC arm. There was no significant difference in CR rates or time to CR between the two groups (P = .28). The associations between achieving a CR and prognostic factors (disease status, age, FAB subtype) were also assessed. Within each category of age, sex, race, and FAB subtype (adjusted in a multivariate model), the CR rates were not significantly different between the two treatment groups. The CR rate of the PSC-MEC arm was not significantly different than that of the MEC arm in the group younger than 50 years (15% v 39%; P = .14) or in the group 50 years of age or older (17% v 20%). Disease status was demonstrated to have a marginally significant correlation with achieving a CR (P = .079). This was evident as the CR rate of patients with no prior induction chemotherapy (PIC; ie, secondary and high-risk MDS, 31% of the cases) was higher than the CR rate of the remaining PIC patients (35% v 15%; P = .018; Table 2). Grouping of PIC with other disease subgroups was not found to be a significant predictor of CR.
Table 2.
Response by Disease Status
| PSC-MEC
|
MEC
|
All Patients
|
||||
|---|---|---|---|---|---|---|
| Clinical Subgroup | No. of Patients | CR % | No. of Patients | CR % | No. of Patients | CR % |
| Prior intensive chemotherapy | ||||||
| First relapse < 6 months | 14 | 7 | 15 | 13 | 29 | 10 |
| Relapse after BMT | 8 | 25 | 8 | 25 | 16 | 25 |
| ≥Two relapses | 5 | 20 | 3 | 33 | 8 | 25 |
| Refractory AML | 19 | 5 | 17 | 18 | 36 | 11 |
| Subtotal (69% patients) | 46 | 11 | 43 | 19 | 89 | 15* |
|
| ||||||
| No prior intensive chemotherapy | ||||||
| Secondary AML | 13 | 39 | 11 | 36 | 24 | 38 |
| High-risk MDS | 7 | 14 | 9 | 44 | 16 | 31 |
| Subtotal (31% patients) | 20 | 30 | 20 | 40 | 40 | 35* |
|
| ||||||
| Total | 66 | 17† | 63 | 25† | 129 | 21 |
NOTE. Underlines separate individual categories from the subtotals and totals of each group.
Abbreviations: PSC-MEC, valspodar plus mitoxantrone, etoposide, and cytarabine; MEC, mitoxantrone, etoposide, and cytarabine; CR, complete remission; BMT, bone marrow transplantation; AML, acute myeloid leukemia; MDS, myelodysplastic syndrome.
P = .018 by univariate analysis;
P = .045 by multivariate analysis.
P = not significant.
For PSC-MEC versus MEC patients achieving CR, 91% (10 of 11 patients) and 75% (12 of 16 patients; P = not significant), respectively, did so after one course of chemotherapy; the remainder required two courses. For CRs in the PSC-MEC arm, the median time to CR was 43 days (range, 12 to 56 days). For CRs in the MEC arm, the median time to CR was 40 days (range 11 to 67 days). All disease status subgroups were represented in the CRs from both treatment arms.
Disease-Free and Overall Survival
The median disease-free survival (DFS) for patients achieving CR in the PSC-MEC arm was 10 months (95% CI, 5.5 to 15.1) and 9.3 months (95% CI, 4.1 to 14.1) in the MEC arm. There was no significant difference in distributions of DFS in the two treatment arms (P = .68; Fig 1). Five of the 11 complete responders in the PSC-MEC arm and 12 of the 16 patients in the MEC arm received consolidation chemotherapy.
Fig 1.
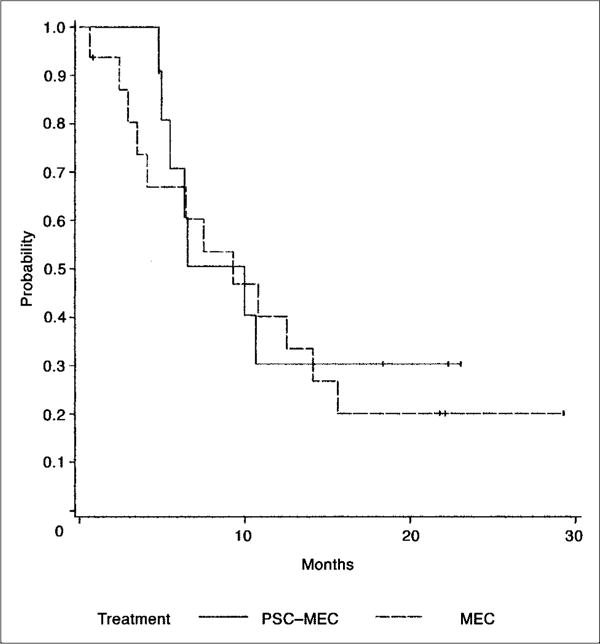
Disease-free survival for 27 patients receiving valspodar plus mitoxantrone, etoposide, and cytarabine (PSC-MEC; n = 11; solid line) versus MEC (n = 16; dashed line) who had achieved complete remission.
A lower incidence of ≥ grade 3 nonhematologic toxicity was found in patients receiving consolidation therapy (P = .014), without significant differences between the two treatment arms. The median overall survival of patients in the PSC-MEC arm was 4.6 months (95% CI, 2.8 to 6.8) and 5.4 months (95% CI, 3.3 to 8.1) in the MEC arm. There was no significant difference in survival distributions of the two treatment groups (P = .18; Fig 2). Comparison of the patients who had received PIC to those who had not indicated that overall survival was decreased in the PIC group (4 v 9 months; P = .001). DFS did not differ significantly between these two patient groups.
Fig 2.
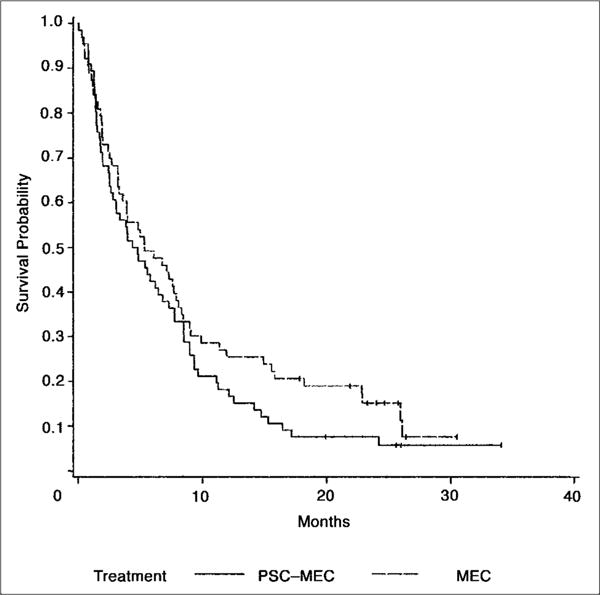
Overall survival for 129 patients receiving valspodar plus mitoxantrone, etoposide, and cytarabine (PSC-MEC; n = 66; solid line) versus MEC (n = 63; dashed line).
Toxicities
Table 3 summarizes induction treatment-related grade 3 or higher toxicities. This analysis was based on 137 patients assigned to receive either arm of therapy (regardless of their receipt of the assigned drugs or pathology exclusions). There were no significant differences in the distributions of grade 3 or higher nonhematologic worst degree toxicity between the two treatment arms. Overall severity and type of toxic incidences were similar between the two treatment groups except for liver toxicity. Liver toxicity of grade 3 or higher was increased in the PSC-MEC arm (60% v 38%; P = .01), mainly reflecting transient and expected hyperbilirubinemia in the PSC-MEC arm. There were 18 patients (14%) who died within 1 month of random assignment (11 in the PSC-MEC arm, seven in the MEC arm). The most common lethal toxicity was infection in both treatment groups.
Table 3.
Severe Toxicities Within the Two Treatment Arms
| PSC-MEC (n = 68) |
MEC (n = 69) |
|||
|---|---|---|---|---|
| Toxicity (grade 3/4) | No. of Patients | % | No. of Patients | % |
| Neurologic | 16 | 24 | 11 | 16 |
|
| ||||
| Hepatic | 41 | 60* | 26 | 38* |
|
| ||||
| Lethal | 11 | 16 | 7 | 10 |
Abbreviations: PSC-MEC, valspodar plus mitoxantrone, etoposide, and cytarabine; MEC, mitoxantrone, etoposide, and cytarabine.
Predominantly transient hyperbilirubinemia.
MDR Data
Of the 144 patients accrued and 129 patients eligible for response analysis, MDR was assessed on gated blast cells from 98 (68%) and 81 (63%) patients, respectively. Of all 98 patients in whom MDR was assessed, 63 (64%) were considered MDR+ (see Patients and Methods), 28 (29%) were MDR−, and seven (7%) had indeterminate MDR status. Table 4 compares P-gp function and protein expression in MDR+ and MDR− patients. The extent of inhibition of rhodamine efflux in vitro by valspodar or cyclosporine was significantly greater in MDR+ than MDR− patients (median, 86% and 88% v 8% and 16%, respectively; P < .001). Furthermore, P-gp expression was significantly higher on blast cells in the MDR+ than the MDR− group, whether represented as percent positive blast cells (65% v 18%, respectively; P < .001), difference in MRK-16 binding relative to background (D = 0.74 v 0.40, respectively; P < .001), or as molecules of equivalent soluble fluorochrome of MRK-16 binding (6,312 v 3,580, respectively; P = .006).
Table 4.
Summary of Multidrug Resistance Data
| Features | MDR+ (n = 63)* | MDR− (n = 28) |
|---|---|---|
| Shift† | ||
| Median | 62 | 24‡ |
| Range | 10–99 | 1–98 |
|
| ||
| PSC§ | ||
| Median | 86 | 16‡ |
| Range | 40–100 | 0–31 |
|
| ||
| Cyclosporine§ | ||
| Median | 88 | 8‡ |
| Range | 17–100 | 0–33 |
|
| ||
| MRK-16‖ | ||
| Median | 65 | 18‡ |
| Range | 2–99 | 1–97 |
|
| ||
| KS/D¶ | ||
| Median | 0.74 | 0.40‡ |
| Range | 0.07–9.8 | 0.05–9.5 |
|
| ||
| MESF# | ||
| Median | 6,312 | 3,580** |
| Range | 1,625–20,007 | 491–12,612 |
Abbreviations: MDR, multidrug resistance; PSC, valspodar; KS/D, Kolmogorov-Smirnov Statistics; MESF, molecules of equivalent soluble fluorochrome; P-gp, P170-glycoprotein.
≥40% in vitro rhodamine efflux from CD34+ blast cells (see Methods).
Rhodamine fluorescence channel shift, reflecting cellular rhodamine efflux, from baseline (maximal dye uptake and retention) that occurred during a 1-hour incubation of cells at 37°C (to induce dye efflux), expressed as percentage of maximal dye retention.
P = .001.
Percentage of inhibition of in vitro rhodamine efflux from blast cells in the presence of these agents.
Percentage of blast cells immuno-stained with anti-P-gp antibody MRK-16.
Binding of MRK-16 to blast cells relative to background using Kolmogorov-Smirnov statistics, whereby the generated D value reflects the difference between the two binding curves.
MESF (MRK-16 immuno-staining), an indicator of P-gp protein density in the cellular membrane of blast cells.
P = .006.
MDR and Response
The distribution of the MDR status was comparable in the two treatment arms, with 65% and 66% of patients being positive in the PSC-MEC and MEC arms, respectively. Among 98 patients with MDR data, 87 were assessable for response analysis. Three patients in each arm had unknown MDR status and were excluded from response analysis. Thus, 81 patients (43 patients in the PSC-MEC arm and 38 patients in the MEC arm) were assessable for both response and MDR status. There was no significant difference in the CR rates between MDR+ and MDR− cases within each treatment arm. In the PSC-MEC arm, the CR rate was 16% in MDR+ cases and 14% in MDR− cases (P = not significant). In the MEC arm, the CR rate was 24% in MDR+ patients and 17% in MDR− patients (P = not significant). Ages were similar among the MDR+ and MDR− patients (75% and 65% were ≥ 50 years old).
Neither the level of P-gp expression nor the extent of P-gp function differed significantly between complete responders and nonresponders. MDR status did not differ by disease state. Similar degrees of MDR positivity were present in blasts from patients who had received PIC (ie, were relapsed or had refractory AML) compared to those who had not (ie, those with secondary AML or high-risk MDS; 62% and 71%, respectively). However, despite this finding, significantly different CR rates were demonstrated (15% v 35%, respectively; P = .018).
Cytogenetics Results
Data were received for all 144 patients, but 38 patients did not have acceptable samples for statistical analysis. Of the 129 patients assessable for response analysis, 23 did not have acceptable samples. Analyses presented in this section are based on the remaining 106 patients.
Among the 106 cases, 77 patients (73%) had an abnormal cytogenetic clone and 29 patients (27%) had no apparent chromosomally abnormal clone. Among the patients with an abnormal clone, 18 patients (23%) had a single chromosome abnormality, 29 (38%) had two abnormalities and 30 (40%) had at least three abnormalities.
Cytogenetic risk categories were classified according to SWOG/ECOG guidelines [29]. These patients’ cytogenetic patterns were thus classified as favorable for 6 cases (6%), intermediate for 35 (33%), unfavorable for 48 (45%), and unknown for 17 (16%). The CR rates were 33%, 23%, 13%, and 35% for favorable, intermediate, unfavorable, and unknown risk groups, respectively (Table 5). The distribution of cytogenetics risk category was not significantly different between complete responders and nonresponders (P = .138). No significant difference in CR rates was observed in each cytogenetics risk group or between the two treatment arms. However, the CR rate for unfavorable cytogenetic patients (in both treatment arms) was 6 of 48 patients (13%) and differed substantially from the combined remainder, 16 of 48 patients (28%; P = .09). An increased proportion of patients who had received no PIC were present in the unfavorable cytogenetic category compared to those who had received PIC—21% (10 of 47 patients) versus 57% (28 of 49 patients; P = .001).
Table 5.
Cytogenetics and Complete Responses Within Treatment Groups
| PSC-MEC
|
MEC
|
||||
|---|---|---|---|---|---|
| Cytogenetic Risk Group* | % of Patients | CR/Total | CR% | CR/Total | CR% |
| Favorable | 6 | 1/3 | 33 | 1/3 | 33 |
|
| |||||
| Intermediate | 33 | 2/18 | 11 | 6/17 | 35 |
|
| |||||
| Unknown | 16 | 4/9 | 44 | 2/8 | 25 |
|
| |||||
| Subtotal | 55 | 7/30 | 23† | 9/28 | 32† |
|
| |||||
| Unfavorable | 45 | 3/26 | 12† | 3/22 | 14† |
|
| |||||
| Total | 10/56 | 18 | 12/50 | 24 | |
Abbreviations: PSC-MEC, valspodar plus mitoxantrone, etoposide, and cytarabine; MEC, mitoxantrone, etoposide, and cytarabine; CR, complete response.
Classified according to Southwest Oncology Group/Eastern Cooperative Oncology Group guidelines [29].
P = .09.
Treatment Comparisons Within Subgroups
There was no significant difference in MDR status related to age and cytogenetics risk group for all patients in each treatment arm. Of 35 patients with unfavorable cytogenetics risk, 69% were MDR+.
In 67 patients, data were available for age, MDR status, response, and cytogenetics risk group. Of these patients, 18 (27%) were older than 50 years, were MDR+, and had unfavorable cytogenetics. The distribution of disease status was different between this extremely poor-risk group versus the remainder of the patients (ie, higher proportion of refractory patients; 50% v 20%), lower proportion in first relapse (11% v 30%; P = .034; Table 6).The CR rate of this extremely poor-risk group versus others was not different—17% versus 18% (P = not significant).
Table 6.
Relation Between Age, MDR, Cytogenetics, and Disease Status
| Age > 50 Years, MDR+, Unfavorable Cytogenetics (n = 18) |
Other (n = 49) |
|||
|---|---|---|---|---|
| Recurrence Status | No. of Patients | % | No. of Patients | % |
| First relapse ≤ 6 months | 2 | 11* | 15 | 31* |
|
| ||||
| Relapse after BMT | 0 | 0 | 10 | 20 |
|
| ||||
| ≥ Two relapses | 1 | 6 | 2 | 4 |
|
| ||||
| Refractory | 9 | 50 | 10 | 20* |
|
| ||||
| Secondary AML | 3 | 17 | 8 | 16 |
|
| ||||
| High-risk MDS | 3 | 17 | 4 | 8 |
Abbreviations: MDR, multidrug resistance; BMT, bone marrow transplant; AML, acute myeloid leukemia; MDS, myelodysplastic syndrome.
P = .034.
Multivariate analysis which included the following covariates in the model—PIC, MDR status, cytogenetics (unfavorable v all others), age, and treatment arm— indicated that PIC was the only significant predictor of CR (P = .038), with lower responses (15% v 35%) in the PIC group (Table 7).
Table 7.
Multivariate Model of Parameters Predicting Complete Remission*
| Covariates | Odds Ratio | 95% CI | P |
|---|---|---|---|
| Treatment | 0.544 | 0.153 to 1.942 | .349 |
| Age | 1.030 | 0.983 to 1.080 | .217 |
| PIC | 4.078 | 1.084 to 15.332 | .038 |
| MDR status | 2.534 | 0.717 to 8.964 | .149 |
| Cytogenetics† | 0.391 | 0.104 to 1.468 | .164 |
Abbreviations: PIC, prior intensive chemotherapy; MDR, multidrug resistance.
Logistic regression.
Unfavorable versus all others.
Pharmacokinetic Data
The pharmacokinetic parameters for mitoxantrone and etoposide are summarized in Table 8. When valspodar was added to the MEC chemotherapy regimen, clearance of mitoxantrone and etoposide decreased by 59% and 50%, respectively (P < .0001). Calculations of each patient’s AUC showed that the empiric dose-reduction strategy of this trial for mitoxantrone (60%) and etoposide (50%) (etoposide, 100 mg/m2 to 40 mg/m2; mitoxantrone, 8 mg/m2 to 4 mg/m2) was justified. With the dose reductions, the drug interactions with valspodar resulted in a higher AUC of mitoxantrone and lower AUC of etoposide in the PSC-MEC versus the MEC arm. Univariate and multivariate logistic regression models with the PK parameters, after adjusting for treatment, showed no prediction for CR.
Table 8.
The Effects of Valspodar on the Clearances and AUC of Plasma Levels of Mitoxantrone and Etoposide
| Parameter | MEC Arm | PSC-MEC Arm | P* |
|---|---|---|---|
| Etoposide | |||
| Volume of distribution | 7.7 ± 1.9 | 5.0 ± 1.7 | < .0001 |
| Clearance, L/h/m2 | 1.2 ± 0.2 | 0.6 ± 0.2 | < .0001 |
| AUC, mcg × h/ml | 84.8 ± 10.1 | 71.3 ± 7.8 | < .0001 |
|
| |||
| Mitoxantrone | |||
| Volume of distribution | 8.4 ± 2.1 | 6.0 ± 2.2 | < .0001 |
| Clearance, L/h/m2 | 19.7 ± 2.9 | 8.1 ± 1.9 | < .0001 |
| AUC, ng × h/ml | 377 ± 48 | 491 ± 45 | < .0001 |
NOTE. The doses of mitoxantrone and etoposide were 8 mg/m2 and 100 mg/m2 in the MEC (control) arm respectively, and 4 mg/m2 and 40 mg/m2 in the PSC-MEC arm.
Abbreviations: AUC, area under the curve; MEC, mitoxantrone, etoposide, and cytarabine; PSC-MEC, valspodar plus mitoxantrone, etoposide, and cytarabine.
Unpaired t-test.
DISCUSSION
Our study, assessing the possible adjunctive value of the MDR modulator valspodar, did not indicate improved response rates or survival in patients randomly assigned to the PSC-MEC arm compared to MEC alone. The relatively low CR rates for the two arms (17% and 25%, respectively) is not unexpected, given the poor-risk features of our patients [43]. These response rates were partially attributable to the fact that a high proportion of our patients had MDR overexpression (64%), were ≥ 50 years old (70%), and had unfavorable cytogenetics (45%), all features associated with relatively poor responsiveness to chemotherapy [3–13,27,29,44,45]. Assessment of MDR using functional analysis (as in our study) appears more relevant than cell surface phenotype in defining MDR status [27,46], although good correlation was demonstrated for these values in our study patients.
A higher proportion of our patients had unfavorable cytogenetics (45%; Table 5) compared to those previously reported in the SWOG/ECOG patients with previously untreated AML, aged less than 56 years (30%) [29]. These differing cytogenetic profiles were attributed to our study consisting of more poor-risk, elderly patients (median age, 57, ranging to 70 years), who had all either received PIC or had secondary AML/high-risk MDS (no PIC). These cytogenetically unfavorable patients had substantially lower CR rates than those without such cytogenetic features (13% v 28%).
When considering patients who had received PIC (AML-type induction), the CR rate was significantly lower (15% v 35% for the remaining patients, ie, those with secondary AML/high-risk MDS). MDR positivity was present similarly and in increased fashion in both patient groups. As subjects with PIC had neither an increased proportion of patients with unfavorable cytogenetics nor increased MDR positivity, additional features (eg, these parameters plus other resistance mechanisms) appear to have contributed to their extremely poor responses. These disparate responses indicated that certain clinical (PIC) and biologic (unfavorable cytogenetics) features were independently associated with a poor-risk phenotype.
Overall the PSC-MEC regimen was well tolerated. There was no significant difference in distributions of severe (grade 3,4) toxicities between the two treatment groups, except for liver toxicity. This related to increased degrees of hyperbilirubinemia, which generally was transient, found in the PSC-MEC treated patients. This was expected, given the known blockade of biliary excretory function by valspodar [24]. Hematologic toxicity based on serious infections, time to recovery of blood counts in responders was similar in the two groups. This likely related to the decreased doses of mitoxantrone and etoposide (for reasons related to PK considerations) [17,22] in the PSC-MEC arm. This pharmacologic interaction with the chemotherapeutic agents led to modification of the chemotherapy doses, which may have altered response potential.
Some, but not all, MDR modulator trials in patients with AML have suggested benefit from this strategy. Initial phase I/II trials suggested that cyclosporine was useful for resistant AML patients [15,17,24]. However, a phase III study from Cancer and Leukemia Group B using valspodar plus chemotherapy versus chemotherapy alone in elderly de novo AML, wherein the chemotherapy drug doses were not modified in the valspodar arm, was closed early as a result of excessive toxicity and did not show improvement in response rates or survival [47]. A recent phase I/II trial using valspodar plus daunorubicin and cytarabine in refractory/relapsed AML also did not show encouraging effectiveness of this drug combination (23% CR rate) [48]. A phase III trial from France using chemotherapy plus quinine as the MDR-1 modulator for treating patients with high-risk MDS showed benefit of the added modulator for treating MDR-1 positive patients [49]. Our study included too few high-risk MDS patients (16 individuals) to comment on the relative efficacy of PSC-MEC in this patient group.
Empirical dose reductions for mitoxantrone and etoposide were employed in our study, based on previous observations of drug interactions. Our population PK analysis showed a similar reduction in mitoxantrone and etoposide clearance during valspodar treatment (Table 8). Despite the prescribed dose reductions in the PSC-MEC arm, we observed a significant increase of 30% in drug exposure (AUC) for mitoxantrone in the experimental arm, and a significant decrease of 16% in AUC for etoposide (Table 8). The net result clinically showed no essential difference in toxicity, or likely in efficacy, in the two arms.
Although studies have demonstrated blockade of MDR-1 in vivo and in vitro with MDR modulating agents, it is likely that multiple other mechanisms exist in our AML and MDS patients, which contributed to their clinical chemotherapeutic resistance [50,51]. These resistance mechanisms include extracellular (eg, drug pharmacokinetics, distribution) or intratumor cell derangements. Representative of abnormal intratumoral transmembrane transport occurring in such cells is the overexpression of members of a super-family of transport proteins (including MDR-1, LRP, and MRP-1) which extrude a variety of cytotoxic drugs often used for therapy [52] and sub-optimal inhibition of P-gp function in vivo.
The study reported here shows that the MDR-modulating agent valspodar did not improve responses in poor-risk AML patients treated with chemotherapy. Future studies, including those without pharmacokinetic interactions for the chemotherapy drugs [53], will need to define the presence of specific resistance mechanisms in specific subtypes of AML and to then target these lesions more comprehensively than the single agent approaches currently being used.
Acknowledgments
This study was conducted by the Eastern Cooperative Oncology Group (Robert L. Comis, MD, Chair) and supported in part by Public Health Service Grants CA23318, CA66636, CA21115, CA13650, CA17145, CA11083, and from the National Cancer Institute (NCI), National Institutes of Health (NIH), and the Department of Health and Human Services. Its contents are solely the responsibility of the authors and do not necessarily represent the official views of the NCI. The pharmacokinetic studies were also supported by NIH grants R01 CA 52168 (B.I.S.) and M01 RR 00070 (General Clinical Research Center, Stanford University School of Medicine).
Footnotes
Reported in part at the American Society of Hematology meeting, New Orleans, LA, December 6, 1999.
Authors’ Disclosures of Potential Conflicts of Interest
The authors indicated no potential conflicts of interest.
References
- 1.Velu T, Delbusscher L, Stryckmans P. Daunorubicin in patients with relapsed and refractory acute non-lymphocytic leukemia previously treated with anthracycline. Am J Hematol. 1988;27:224–225. doi: 10.1002/ajh.2830270315. [DOI] [PubMed] [Google Scholar]
- 2.Lowenberg B, Downing J, Burnett A. Acute myeloid leukemia. N Engl J Med. 1999;341:1051–1062. doi: 10.1056/NEJM199909303411407. [DOI] [PubMed] [Google Scholar]
- 3.Lepelley P, Soenen V, Preudhomme C, et al. Expression of multidrug resistance p-glycoprotein and its relationship to hematological characteristics and response to treatment in myelodysplastic syndromes. Leukemia. 1994;8:998–1004. [PubMed] [Google Scholar]
- 4.List AF. Multidrug resistance: Clinical relevance in acute leukemia. Oncology. 1993;7:23–28. [PubMed] [Google Scholar]
- 5.Arceci R. Clinical significance of P-glycoprotein in multidrug resistance malignancies. Blood. 1993;81:2215–2222. [PubMed] [Google Scholar]
- 6.Campos L, Guyotat D, Archimbauld E, et al. Clinical significance of multidrug resistance P-glycoprotein expression on acute nonlympho-blastic leukemia cells at diagnosis. Blood. 1992;79:473–476. [PubMed] [Google Scholar]
- 7.Marie J-P, Zittoun R, Sikic BI. Multidrug resistance (mdr1) gene expression in adult acute leukemias: Correlations with treatment outcome and in vitro drug sensitivity. Blood. 1991;78:586–592. [PubMed] [Google Scholar]
- 8.Wood P, Burgess R, MacGregor A, et al. P-glycoprotein expression on acute myeloid leukaemia. Br J Haematol. 1994;87:509–514. doi: 10.1111/j.1365-2141.1994.tb08305.x. [DOI] [PubMed] [Google Scholar]
- 9.Boekhorst PAW, de Leeuw K, Schoester M, et al. Predominance of functional multidrug resistance (MDR-1) phenotype in CD34+ acute myeloid leukemia cells. Blood. 1993;82:3157–3162. [PubMed] [Google Scholar]
- 10.List A, Spier C, Cline A, et al. Expression of the multi-drug resistance gene product (P-glycoprotein) in myelodysplasia is associated with a stem cell phenotype. Br J Haematol. 1991;78:28–34. doi: 10.1111/j.1365-2141.1991.tb04378.x. [DOI] [PubMed] [Google Scholar]
- 11.Leith C, Kopecky K, Godwin J, et al. Acute myeloid leukemia in the elderly: Assessment of MDR-1 and cytogenetics distinguishes biologic subgroups with remarkably distinct responses to standard chemotherapy. A SWOG study Blood. 1997;89:3323–3329. [PubMed] [Google Scholar]
- 12.Herweijor H, Sonneveld P, Baas F, et al. Expression of mdr1 and mdr3 multidrug resistance genes in human acute and chronic leukemias and association with stimulation of drug accumulation by cyclosporine. J Natl Cancer Inst. 1990;82:1133–1140. doi: 10.1093/jnci/82.13.1133. [DOI] [PubMed] [Google Scholar]
- 13.Nooter K, Sonneveld P, Oostrum R, et al. Overexpression of the mdr1 gene in blast cells from patients with acute myelocytic leukemia is associated with stimulation of drug accumulation that can be restored by cyclosporin-A. Int J Cancer. 1990;45:263–268. doi: 10.1002/ijc.2910450210. [DOI] [PubMed] [Google Scholar]
- 14.Solary E, Caillot D, Chauffert B, et al. Feasibility of using quinine, a potential multi-drug resistance-reversing agent, in combination with mitoxantrone and cytarabine for the treatment of acute leukemia. J Clin Oncol. 1992;10:1730–1736. doi: 10.1200/JCO.1992.10.11.1730. [DOI] [PubMed] [Google Scholar]
- 15.List AF, Spier C, Greer J, et al. Phase I/II trial of cyclosporin as a chemotherapy-resistance modifier in acute leukemia. J Clin Oncol. 1993;11:1652–1660. doi: 10.1200/JCO.1993.11.9.1652. [DOI] [PubMed] [Google Scholar]
- 16.Tallman MS, Lee S, Sikic BI, et al. Mitox-antrone, etoposide, and cytarabine plus cyclosporine for patients with relapsed or refractory acute myeloid leukemia: an Eastern Cooperative Oncology Pilot Study. Cancer. 1999;85:358–367. [PubMed] [Google Scholar]
- 17.Advani R, Saba H, Rowe JM, et al. Treatment of refractory/relapsed AML with chemotherapy plus the multi-drug resistance modulator PSC833 (Valspodar) Blood. 1999;93:787–795. [PubMed] [Google Scholar]
- 18.Twentyman P, Bleehen N. Resistance modification by PSC 833, a novel non-immunosuppressive cyclosporin. A Eur J Cancer. 1991;27:1639–1642. doi: 10.1016/0277-5379(91)90435-g. [DOI] [PubMed] [Google Scholar]
- 19.Boesh D, Gaveriaux C, Jachez B, et al. In vivo circumvention of P-glycoprotein-mediated multi drug resistance of tumor cells with SDZ PSC833. Cancer Res. 1991;51:4226–4233. [PubMed] [Google Scholar]
- 20.Keller R, Altermatt H, Nooter K, et al. SDZ PSC 833, a non-immunosuppressive cyclosporine and its potency in overcoming P-glycoprotein-mediated multidrug resistance of murine leukemia. Int J Cancer. 1992;50:593–597. doi: 10.1002/ijc.2910500418. [DOI] [PubMed] [Google Scholar]
- 21.Boote D, Dennis P, Twentyman P. Phase I study of etoposide with SDZ PSC833 as a modulator of multi-drug resistance in patients with cancer. J Clin Oncol. 1996;14:610–618. doi: 10.1200/JCO.1996.14.2.610. [DOI] [PubMed] [Google Scholar]
- 22.Keller RP, Altermatt HJ, Donatsch P, et al. Pharmacologic interactions between the resistance modifying cyclosporine SDZ PSC833 and etoposide (VP 16–213) enhance in vivo cytostatic activity and toxicity. Int J Cancer. 1992;51:433–438. doi: 10.1002/ijc.2910510316. [DOI] [PubMed] [Google Scholar]
- 23.Fisher GA, Lum BL, Hausdorff J, et al. Pharmacological considerations in the modulation of multidrug resistance. Eur J Cancer. 1996;32A:1082–1088. doi: 10.1016/0959-8049(96)00111-6. [DOI] [PubMed] [Google Scholar]
- 24.Dorr R, Karanes C, Spier C, et al. Phase I/II study of the P-glycoprotein modulator PSC 833 in patients with acute myeloid leukemia. J Clin Oncol. 2001;19:1589–1599. doi: 10.1200/JCO.2001.19.6.1589. [DOI] [PubMed] [Google Scholar]
- 25.Greenberg P, Cox C, Le Beau MM, et al. International scoring system for evaluating prognosis in myelodysplastic syndromes. Blood. 1997;89:2079–2088. [PubMed] [Google Scholar]
- 26.Paietta E, Andersen J, Racevskis J, et al. Modulation of multidrug resistance in de novo adult acute myeloid leukemia. Blood Rev. 1995;9:47–52. doi: 10.1016/0268-960x(95)90039-x. [DOI] [PubMed] [Google Scholar]
- 27.Paietta E. Classical multi drug resistance in acute myeloid leukemia. Med Oncol. 1997;14:53–60. doi: 10.1007/BF02990947. [DOI] [PubMed] [Google Scholar]
- 28.Karger S. Neoplasia. In: Mitelman F, editor. An international system for human cytogenetic nomenclature. Basel, Switzerland: 1995. p. 78. [Google Scholar]
- 29.Slovak ML, Kopecky KJ, Cassileth PA, et al. Karyotypic analysis predicts outcome of preremission and postremission therapy in adult myeloid leukemia: A Southwest Oncology Group/Eastern Cooperative Oncology Study. Blood. 2000;96:4075–4083. [PubMed] [Google Scholar]
- 30.Slordal L, Andersen A, Warren DJ. A sensitive and simple high-performance liquid chromatographic method for the determination of mitoxantrone in plasma. Ther Drug Monit. 1993;15:328–333. doi: 10.1097/00007691-199308000-00011. [DOI] [PubMed] [Google Scholar]
- 31.Hu OY, Chang SP, Song YB, et al. Novel assay method for mitoxantrone in plasma, and its application in cancer patients. J Chromatogr. 1990;532:337–350. doi: 10.1016/s0378-4347(00)83783-4. [DOI] [PubMed] [Google Scholar]
- 32.Andersen A, Warren DJ, Slordal L. A sensitive and simple high-performance liquid chromatographic method for the determination of doxorubicin and its metabolites in plasma. Ther Drug Monit. 1993;15:455–461. doi: 10.1097/00007691-199310000-00016. [DOI] [PubMed] [Google Scholar]
- 33.Manouilov KK, McGuire TR, Gordon BG, et al. Assay for etoposide in human serum using solid-phase extraction and high-performance liquid chromatography with fluorescence detection. J Chromatogr B Biomed Sci Appl. 1998;707:342–346. doi: 10.1016/s0378-4347(97)00543-4. [DOI] [PubMed] [Google Scholar]
- 34.Lum BL, Kaubisch S, Yahanda AM, et al. Alteration of etoposide pharmacokinetics and pharmacodynamics by cyclosporine in a phase I trial to modulate multidrug resistance. J Clin Oncol. 1992;10:1635–1642. doi: 10.1200/JCO.1992.10.10.1635. [DOI] [PubMed] [Google Scholar]
- 35.Beal SL, Sheiner LB. Methodology of population pharmacokinetics. In: Garrett ER, Hirtz J, editors. Drug Fate and Metabolism: Methods and Techniques. Vol. 5. New York, NY: Marcel Decker; 1985. pp. 135–183. [Google Scholar]
- 36.Ludden TM. Population pharmacokinetics. J Clin Pharmacol. 1988;28:1059–1063. doi: 10.1002/j.1552-4604.1988.tb05714.x. [DOI] [PubMed] [Google Scholar]
- 37.Attal M, Canal P, Schlaifer D, et al. Escalating dose of mitoxantrone with high-dose cyclophosphamide, carmustine, and etoposide in patients with refractory lymphoma undergoing autologous bone marrow transplantation. J Clin Oncol. 1994;12:141–148. doi: 10.1200/JCO.1994.12.1.141. [DOI] [PubMed] [Google Scholar]
- 38.Ciccolini J, Monjanel-Mouterde S, Bun SS, et al. Population pharmacokinetics of Etoposide: Application to therapeutic drug monitoring. Ther Drug Monit. 2002;24:709–714. doi: 10.1097/00007691-200212000-00005. [DOI] [PubMed] [Google Scholar]
- 39.Agresti A. Categorical Data Analysis. New York, NY: Wiley; 1990. pp. 59–66. [Google Scholar]
- 40.Kaplan E, Meier P. Nonparametric estimation from incomplete observations. J Am Stat Assoc. 1958;53:457–461. [Google Scholar]
- 41.Lehmann EL. Nonparametrics: Statistical methods based on ranks. Upper Saddle River, NJ: Prentice-Hall; 1998. pp. 5–12. [Google Scholar]
- 42.Pampallona S, Tsiatis AA. Group sequential designs for one-sided and two-sided hypothesis testing with provision for early stopping in favor of the null hypothesis. Journal of Statistical Planning and Inference. 1994;42:19–35. [Google Scholar]
- 43.Estey E, Kornblau S, Pierce S, et al. A stratification system for evaluating and selecting therapies in patients with relapsed or primary refractory AML. Blood. 1996;88:756. [PubMed] [Google Scholar]
- 44.Sato H, Preisler H, Day R, et al. MDR1 transcripts levels as an indication of resistant disease in acute myelogenous leukemia. Br J Haematol. 1990;75:340–345. doi: 10.1111/j.1365-2141.1990.tb04346.x. [DOI] [PubMed] [Google Scholar]
- 45.Schneider E, Cowan KH, Bader H, et al. Increased expression of the multidrug resistance associated protein gene in relapsed acute leukemia. Blood. 1995;85:186–193. [PubMed] [Google Scholar]
- 46.Beck WT, Grogan TM, Willman CL, et al. Methods to detect P-glycoprotein associated with multidrug resistance in patients’ tumors. Consensus recommendations. Cancer Res. 1996;56:3010–3020. [PubMed] [Google Scholar]
- 47.Baer M, George S, Dodge R, et al. Phase 3 study of the multidrug resistance modulator PSC-833 in previously untreated patients 60 years of age and older with acute myeloid leukemia: CALGB study 9720. Blood. 2002;100:1224–1232. [PubMed] [Google Scholar]
- 48.Gruber A, Bjorkholm M, Brinch L, et al. A phase I/II study of the MDR modulator Valspodar (PSC 833) combined with daunorubicin and cytarabine in patients with relapsed and primary refractory acute myeloid leukemia. Leuk Res. 2003;27:323–328. doi: 10.1016/s0145-2126(02)00181-9. [DOI] [PubMed] [Google Scholar]
- 49.Wattel E, Solary E, Hecquet B, et al. Quinine improves the results of intensive chemotherapy in myelodysplastic syndromes expressing P glycoprotein: Results of a randomized study. Br J Haematol. 1998;102:1015–1024. doi: 10.1046/j.1365-2141.1998.00870.x. [DOI] [PubMed] [Google Scholar]
- 50.Sikic BI. Pharmacologic approaches to reversing multidrug resistance. Semin Hemat. 1997;34(suppl 5):40–47. [PubMed] [Google Scholar]
- 51.List AF. Non-P-glycoprotein drug export mechanisms of multidrug resistance. Semin Hemat. 1997;34(suppl 5):20–24. [PubMed] [Google Scholar]
- 52.Leith CP, Kopecky KJ, Chen IM, et al. Frequency and clinical significance of expression of the multidrug resistance proteins MDR1, MRP1 and LRP in acute myeloid leukemia. A Southwest Oncology Group study. Blood. 1999;94:1086–1099. [PubMed] [Google Scholar]
- 53.Cripe L, Tallman MS, Karanes C, et al. A phase II trial of Zosuquidar (LY335979), a modulator of P-glycoprotein activity plus daunorubicin and high dose cytarabine in patients with newly diagnosed secondary acute myeloid leukemia (AML), refractory anemia with excess blasts in transformation or relapsed/refractory AML. Blood. 2001;98(suppl 1):595a. [Google Scholar]