

EXECUTIVE SUMMARY
Background
A scoping search identified systematic reviews on diagnostic accuracy and predictive ability of frailty measures in older adults. In most cases, research was confined to specific assessment measures related to a specific clinical model.
Objectives
To summarize the best available evidence from systematic reviews in relation to reliability, validity, diagnostic accuracy and predictive ability of frailty measures in older adults.
Inclusion criteria Population
Older adults aged 60 years or older recruited from community, primary care, long-term residential care and hospitals.
Index test
Available frailty measures in older adults.
Reference test
Cardiovascular Health Study phenotype model, the Canadian Study of Health and Aging cumulative deficit model, Comprehensive Geriatric Assessment or other reference tests.
Diagnosis of interest
Frailty defined as an age-related state of decreased physiological reserves characterized by an increased risk of poor clinical outcomes.
Types of studies
Quantitative systematic reviews.
Search strategy
A three-step search strategy was utilized to find systematic reviews, available in English, published between January 2001 and October 2015.
Methodological quality
Assessed by two independent reviewers using the Joanna Briggs Institute critical appraisal checklist for systematic reviews and research synthesis.
Data extraction
Two independent reviewers extracted data using the standardized data extraction tool designed for umbrella reviews.
Data synthesis
Data were only presented in a narrative form due to the heterogeneity of included reviews.
Results
Five reviews with a total of 227,381 participants were included in this umbrella review. Two reviews focused on reliability, validity and diagnostic accuracy; two examined predictive ability for adverse health outcomes; and one investigated validity, diagnostic accuracy and predictive ability. In total, 26 questionnaires and brief assessments and eight frailty indicators were analyzed, most of which were applied to community-dwelling older people. The Frailty Index was examined in almost all these dimensions, with the exception of reliability, and its diagnostic and predictive characteristics were shown to be satisfactory. Gait speed showed high sensitivity, but only moderate specificity, and excellent predictive ability for future disability in activities of daily living. The Tilburg Frailty Indicator was shown to be a reliable and valid measure for frailty screening, but its diagnostic accuracy was not evaluated. Screening Letter, Timed-up-and-go test and PRISMA 7 (Preferred Reporting Items for Systematic Reviews and Meta-Analyses) demonstrated high sensitivity and moderate specificity for identifying frailty. In general, low physical activity, variously measured, was one of the most powerful predictors of future decline in activities of daily living.
Conclusion
Only a few frailty measures seem to be demonstrably valid, reliable and diagnostically accurate, and have good predictive ability. Among them, the Frailty Index and gait speed emerged as the most useful in routine care and community settings. However, none of the included systematic reviews provided responses that met all of our research questions on their own and there is a need for studies that could fill this gap, covering all these issues within the same study. Nevertheless, it was clear that no suitable tool for assessing frailty appropriately in emergency departments was identified.
Keywords: Diagnostic test accuracy, frail elderly, frailty, pre-frailty, screening
Background
Frailty is an age-related state of decreased physiological reserves characterized by a weakened response to stressors and an increased risk of poor clinical outcomes.1 Frailty contributes to the dynamic progression from robustness to functional decline.2 Because of this, it is frequently defined in terms of absence of resilience that predisposes to disability and dependency on others for daily life activities, and that leads to hospitalization and institutional placement.3-5 It is also a predictor of higher mortality rates.5-8 In the absence of biological markers, several operational definitions of frailty have been proposed with a widely adopted one being that of a frailty phenotype.3,9 This definition is based on physical markers, including global weakness with low muscle strength (e.g. poor grip strength), overall slowness (particularly of gait), decreased balance and mobility, fatigability or exhaustion, low physical activity and involuntary weight loss. For diagnostic purposes, at least three of these symptoms must be observed.9 The presence of only one or two of them indicates the earlier stage of frailty, namely, pre-frailty. Despite high predictive validity of this operational definition, and despite its common use in clinical settings, many researchers believe it is insufficient, asserting that a definition of frailty should also include cognitive and mental health domains and maybe also social domains such as living alone.1,10-12 Other dimensions recognized as important to identify frailty are quality of life (e.g. including aspects such as perceived health and life satisfaction) and ability to deal with activities of daily living, since in this clinical condition both tend to be decreased.10,13
A lack of consensus on the definition of frailty (based on physical markers as opposed to a broader multi-dimensional approach) is also reflected in differences related to the prevalence data obtained from epidemiological studies. Systematic comparison of these data14 shows that frailty prevalence differs from 4% to 17% in the population aged 65 years and over, and in the case of pre-frailty, prevalence varies from 19% to 53% in the same age group, with average values of 10.7% and 41.6%, respectively. The differences between estimates are also conditioned by demographic variables such as age and gender, for example, for elders aged 80–84 years, the prevalence of frailty is estimated as 15.7%, and for elders over the age of 84 years, 26.1%. In addition, women tend to have higher rates of frailty than men.14
Although the condition of frailty has been studied for years, there is no consensus view about its pathophysiological mechanism. According to some authors,2,3,9 this state of increased vulnerability is due to accumulation of sub-threshold decrement in physiologic reserves that affect multiple physiologic systems. Other authors15,16 have described frailty in terms of progressive dysregulation in a number of main physiological systems and their complex inter-connected network and subsequent depletion of homeostatic reserve and resiliency. Recently, discussion on the pathological mechanism of this clinical condition has been enriched by new theoretical proposals associating frailty with reduced capacity to compensate aging-related molecular and cellular damage.13,17 It was also suggested that frailty emerges as a consequence of an absence of resilience associated with the ability to compensate and maintain coping and a sense of health.18 In all these approaches, it is assumed that the development of frailty may be modulated by disease or that it can be exacerbated by the occurrence of comorbid pathological conditions.19-21 It is also suggested that the presence of increased vulnerability for adverse health outcomes can precede the onset of chronic disease.19,20 However, according to Bergman et al.,19 it is probable that the observed vulnerability or frailty that precedes the onset of chronic disease is only a manifestation of the sub-clinical and undiagnosed stages of such a disease.
Because of the high prevalence of frailty and the related burden of adverse outcomes, its early identification should be a priority especially among community-dwelling people and in primary care networks (including general practice and geriatrics). Early diagnosis of this clinical condition can help improve care for older adults, minimizing the risk of pre-frail states developing into frail states (primary prevention). Early diagnosis is also vital for implementation of therapeutic measures. These therapeutic measures may attenuate or delay the underlying conditions and symptoms or ameliorate the impacts on independence or a healthy and engaged lifestyle, loss of which would in turn have further impacts on frailty development (secondary prevention).3,5 In more advanced stages, frailty assessment provides valuable data, necessary for planning and implementing intervention strategies oriented to preservation of functional status or to controlling adverse outcome progression, such as recurrent hospitalizations, institutionalization or death (tertiary prevention).3,5 The evidence from the implementation of various types of interventions for frailty indicates that frailty can be managed and reduced.22-25 Screening for frailty can also provide information on populations at high risk of disability and poor prognosis, and help to identify reversible risk factors.2 These data are especially important for determining variables that make specific interventions more beneficial to specific patients.
To identify individuals at risk of frailty, several assessment tools have been developed. The most widely cited are focused on physical markers of frailty3,9 or based on the accumulation of deficits in physical, cognitive, mental health and functional domains.13,26 However, both types of measures seem to be insufficient, since the first one does not cover all dimensions of frailty and, consequently, does not provide indications useful for treatment choice and care planning, and the last one is time consuming thus difficult to integrate into day-to-day healthcare practice.27 In more recent approaches, the indices created for frailty assessment integrate demographic, medical, social and functional information, and demonstrate their usefulness either for diagnostic purposes or to predict adverse health outcomes.28 According to the literature, there are more than 20 different measures being used for frailty screening. Nonetheless, it is still unknown how their characteristics match different samples within the frail/pre-frail condition and robust populations, and what is the best fit between these measures, purposes (e.g. to predict the need for care, mortality or potential response to intervention) and contexts/populations to assess frailty in older age. Also, the reliability and validity of these measures need to be clarified, as well as their comparative sensitivity and specificity in identifying older adults at risk of a poor prognosis.
A scoping search identified relevant systematic reviews; however, in most cases, they were confined to one specific assessment approach related to a specific frailty conceptualization (phenotype model,9 cumulative deficits model13 and predictive model28). For a clear view and objective evaluation of existing tools, this set of evidence needs to be systematized, compared and synthesized. In other words, it is essential to conduct an umbrella review.
A preliminary search29 of the JBI Database of Systematic Reviews and Implementation Reports, the Cochrane Database of Systematic Reviews (CDSR), PROSPERO, CINAHL and MEDLINE has revealed that there is currently no umbrella review (neither published nor in progress) looking at the reliability, validity and diagnostic accuracy in detecting pre-frail and frail conditions, and the predictive accuracy of available screening tools for frailty in older adults.
The main aim of this umbrella review is to consolidate the available evidence regarding screening for pre-frailty and frailty in older age from the published literature. More specifically, we summarized reviews to determine the performance of screening tools in terms of pre-frailty and frailty diagnosis and prediction of poor prognosis. This review was conducted according to an a priori published protocol.30
Review question/objective
The aim of this umbrella review was to comprehensively search the available literature and to summarize the best available evidence from systematic reviews in relation to published screening tools to identify pre-frailty and frailty in older adults, namely: (i) to determine their psychometric proprieties, (ii) to assess their capacity to detect pre-frail and frail conditions against established methods, and (iii) to evaluate their predictive ability.
More specifically, the review focused on the following questions:
What is the reliability and validity of existing screening tools that assess pre-frailty/frailty in older adults?
How sensitive and specific are the available tools to identify pre-frail and frail older adults?
What is the ability of available pre-frailty/frailty assessment tools to predict adverse health outcomes such as functional disability, hospitalization, institutionalization, comorbidities and death?
Inclusion criteria
Types of participants
Initially, this umbrella review considered systematic reviews that included older adults (male and female) aged 65 years or older in any type of setting (including primary care, long-term residential care and hospitals). However, in the course of the review, we realized that only a few systematic reviews satisfied this inclusion criterion. In our opinion, this might be in part due to the fact that many papers published after 2001 reported data from studies conducted before this date, when the age associated with the commencement of the aging processes was lower than it is nowadays. The preventative aspect and rationale of some screening studies might be another reason to start looking at the age-associated risks at an earlier stage. Thus, it was decided to lower the age criterion to 60 years or older.
Index test
The current umbrella review considered systematic reviews that focused on currently available screening tools for pre-frailty and frailty in older adults, including questionnaires, brief assessments and frailty indicators, used in any type of setting (primary care, nursing home and hospitals).
Reference test
The capacity to detect pre-frail and frail conditions of the index tests was compared against reference tests from the Cardiovascular Health Study (CHS) phenotype model,9 the Canadian Study of Health and Aging (CSHA) cumulative deficit model (Clinical Frailty Scale [CFS] and the Frailty Index based on a Comprehensive Geriatric Assessment [FI-CGA]),31,32 as well as against the CGA33 or other reference tests.
Diagnosis of interest
Diagnosis of interest included conditions of pre-frailty and frailty. Frailty was defined as an age-related state of decreased physiological reserves characterized by a weakened response to stressors and an increased risk of poor clinical outcomes.1 Pre-frailty was defined as a clinically silent and reversible stage preceding frailty, in which physiological reserves are sufficient to respond adequately to stressors.2
Because of the aims of this umbrella review (to determine the performance of currently available frailty measures in terms of detecting pre-frailty and frailty in older adults or predicting risk of adverse health outcomes), various operational definitions of frailty were considered, including: (i) a definition focused on physical markers of frailty3,9; (ii) a definition based on the accumulation of deficits from physical, cognitive, mental health and functional domains,13,26 and (iii) a definition integrating demographic, medical, psychological, social and functional information.28
Outcomes
The current umbrella review considered reviews that included the following outcome measures:
Reliability of frailty screening tools defined in terms of internal consistency and repeatability (test-retest) of findings.
Criterion validity of frailty screening tools defined as a measure of how well one test correctly classifies people according to a reference outcome, as well as construct validity defined as the degree to which a test measures what it claims or purports to be measuring.
Sensitivity and specificity determined by comparison with a reference test (the CHS phenotype model, CSHA cumulative deficit model, CGA or other reference tests), positive predictive values, negative predictive values (NPV) and likelihood ratios (LRs).
Predictive accuracy of frailty screening tools for risks of adverse health outcomes, including functional disability, hospitalization, institutionalization, comorbidities and death.
Reviews were considered for inclusion when they reported data relevant to at least one of the umbrella review outcomes.
Types of studies
The current umbrella review considered quantitative systematic reviews, meta-analyses and pooled analyses (that provide an overall summary of subgroup data or data from a number of related studies) identifying relevant scientific evidence related to reliability, validity and diagnostic accuracy to detect pre-frail and frail conditions, and predictive accuracy of available screening tools for frailty in older adults.
Search strategy
The search strategy aimed to find both published and unpublished systematic reviews and meta-analyses. A three-step search strategy was utilized in this umbrella review. An initial limited search of MEDLINE and CINAHL was undertaken followed by analysis of the text words contained in the titles and abstracts, and of the index terms used to describe the articles.
A second search using all identified keywords and index terms was then undertaken across all included databases. Third, the reference lists of all identified reports and articles were searched for additional studies. Reviews and meta-analyses published in English from January 2001 to October 2015 were considered for inclusion in this umbrella review. This timeline was selected because 2001 was the year of publication of Fried's9 paper that was shown to be seminal for research on the frailty condition. Studies in other languages or outside the timeframe selected were excluded.
The search for published reviews and meta-analyses included the following sources: MedicLatina, CINAHL Complete, MEDLINE via EBSCOhost Web, Scielo – Scientific Electronic Library Online, CDSR, Centre for Reviews and Dissemination Databases (Database of Reviews of Effects), PROSPERO register and JBI Database of Systematic Reviews and Implementation Reports.
The search for unpublished reviews and meta-analyses included: Grey Literature Report (The New York Academy of Medicine), ProQuest – Nursing and Allied Health Source Dissertations.
Initial keywords were review, meta-analysis, pre-frailty, frailty, diagnostic test, assessment, accuracy, clinical risk stratification instruments, screening, sensitivity, specificity, reliability validity, positive predictive value and negative predictive value.
The search strategies for all databases are detailed in Appendix I.
Assessment of methodological quality
Two reviewers independently selected titles and screened abstracts prior to retrieving full texts. The full texts were assessed for eligibility in respect of type of participants, study design and outcomes. Papers selected for retrieval were assessed for methodological validity prior to inclusion in the review, using the standardized critical appraisal checklist for systematic reviews and research synthesis from the Joanna Briggs Institute System for the Unified Management, Assessment and Review Instrument and The Joanna Briggs Institute Reviewers’ Manual 2014 – Methodology for JBI Umbrella Reviews.34 Any disagreements that arose between the reviewers were resolved through discussion or with other reviewers.
To ensure quality of analyzed evidence, a cutoff point for inclusion of systematic reviews and meta-analyses was applied. It was decided to consider as mandatory three questions: Q2 (appropriateness of inclusion criteria for the review question), Q5 (appropriateness of criteria used for critical appraisal of the included studies) and Q6 (whether the critical appraisal was conducted by two or more reviewers independently). These three mandatory questions were chosen by the reviewers to avoid the inclusion of reviews that did not consider the risk of bias in the primary studies or that were prone to selection bias because of inappropriate critical appraisal process and/or lack of appropriate inclusion criteria. Thus, reviews that received a negative answer to any of these three questions were excluded, and only reviews receiving “YES” answers to all the three questions were included. In case of “UNCLEAR” answers, the authors of the review were contacted to clarify the data. In the absence of the answers from the authors, it was decided to retain reviews that provided unclear information in relation to the mandatory questions Q2 and Q6, but not Q5. Two such reviews36,37 were identified: in one review,37 the appropriateness of inclusion criteria for the review question was unclear (Q2); the second review36 did not state clearly that the critical appraisal was conducted by at least two reviewers working independently from each other (Q6).
Data extraction
Data were extracted from papers included in the review using the standardized JBI data extraction form for systematic reviews and research syntheses.34 This process was conducted by two independent reviewers. Disagreements were resolved by discussion to reach consensus. Information was extracted on the following:
Characteristics of the review, such as objective, search sources and timeframe, characteristics of participants (number and age group) and setting, critical appraisal details and method of analysis.
Characteristics of the included studies, such as number of analyzed studies, design, data range and country of origin.
Summary of findings from relevant comparisons and outcomes, including instrument references, outcomes identified (type/characteristics), length of follow-up and primary outcome measures.
This information was taken directly from the source papers or narrative summary. In cases of missing or unclear information, the authors of the included reviews and meta-analyses were contacted.
Data summary
As statistical pooling was not possible due to significant heterogeneity between the reviews in terms of characteristics of participants included, settings of conducted studies, screening tests used for analysis and differences in time points of the outcome measurements, the findings are presented in narrative form. Figures and tables are included where appropriate to aid in data presentation. All outcomes of interest extracted from the included reviews and meta-analyses were tabulated in the form of review-level summaries. Where outcomes were meta-analyzed within a review, the authors of this umbrella review extracted and reported the pooled effect sizes. Where no quantitative pooling of effect sizes was reported or where outcomes were reported descriptively by single studies, the authors of this umbrella review provided these results by using standardized language indicating direction of effect and statistical significance. All included reviews and meta-analyses were also screened for overlapping of included studies.
Results
Study selection
A total of 420 potentially relevant reviews were identified in the literature search. Of those, 75 were duplicates. From the remaining 345 records, 325 were excluded after title and abstract assessment, and then 10 were excluded after full-text analysis as they did not meet the inclusion criteria. The methodological quality of the remaining 10 reviews was assessed. Finally, a total of five reviews were included in this umbrella review. Figure 1 illustrates the process of study selection.
Figure 1.
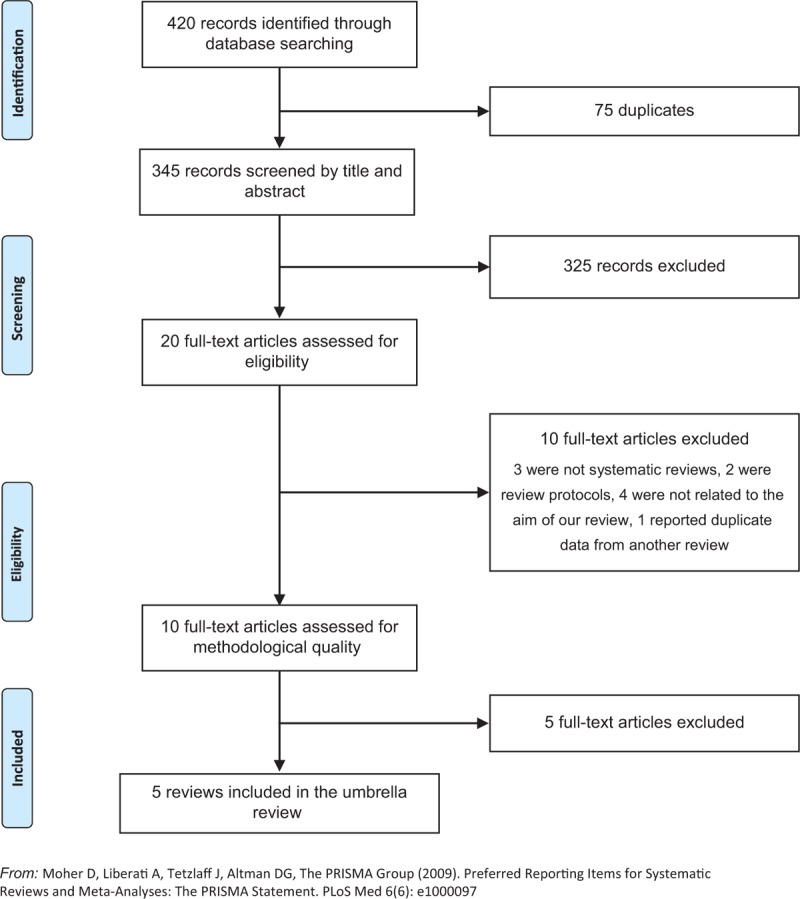
Flowchart for the search and review and meta-analysis selection process
From the five reviews included in this umbrella review, three35-37 aimed to explore whether the available screening tools for frailty were adequate to identify this clinical condition among older adults. All three reviews35-37 reported data related to diagnostic accuracy of frailty screening tools, two reviews36,37 provided details about reliability of the analyzed instruments and one36 focused on construct validity and criterion validity. In this last review,36 criterion validity was assessed based on ability of the instrument to predict adverse outcomes. There were two more reviews38,39 that investigated whether the existing screening tools for frailty had the capacity to identify older people at risk of adverse outcomes. One of these reviews38 addressed instruments used in emergency departments. The other39 considered physical indicators of frailty. In one review,37 one of the analyzed primary studies included participants aged 50 years and over. However, given that the data were not pooled in meta-analysis, it was decided to exclude this study from further analysis and include the other primary studies described by the authors of the review.37 No overlapping primary studies were found in the included reviews.
Methodological quality
Two independent reviewers assessed methodological quality of 10 reviews. The authors of eight of them were contacted to obtain more details in relation to missing or unclear data. Three authors replied. The answer obtained from one of the authors did not satisfy the mandatory criteria for inclusion in this umbrella review. Besides this review, four other reviews were excluded. Appendix II lists the reviews that were excluded based on critical appraisal and the reasons for the exclusion.
There was general agreement among the reviewers to include the five reviews. All included reviews stated clearly and explicitly the review question (Q1), performed the search process in adequate sources of studies (Q4), used appropriate criteria for appraising studies (Q5), delivered recommendations for policy and/or practice that were supported by the reported data (Q10) and indicated appropriate specific directives for new research (Q11). In one review,37 the inclusion criteria were not sufficiently detailed to decide whether they were appropriate or not for the review question, being evaluated as unclear (Q2). One unclear answer was also obtained in relation to the question addressing the issue of appropriateness of search strategy (Q3).36 One review36 provided insufficient information in relation to the critical appraisal process, and unclear whether this process was conducted by two or more independent reviewers or not (Q6). The lack of sufficient information was also observed with respect to the data extraction process in three reviews36,37,39 that did not specify their method for minimizing errors in data extraction (Q7). One review36 provided unclear information on the reasons why the method to combine the studies was chosen (Q8). None of the included reviews evaluated likelihood of publication bias (Q9). Table 1 shows the results of the methodological quality assessment of included reviews.
Table 1.
Assessment of methodological quality of included reviews
| Reference | Q1 | Q2 | Q3 | Q4 | Q5 | Q6 | Q7 | Q8 | Q9 | Q10 | Q11 |
| Clegg et al.35 | Y | Y | Y | Y | Y | Y | Y | Y | N | Y | Y |
| Drubbel et al.36 | Y | Y | U | Y | Y | U | U | U | N | Y | Y |
| Pialoux et al.37 | Y | U | Y | Y | Y | Y | U | Y | N | Y | Y |
| Carpenter et al.38 | Y | Y | Y | Y | Y | Y | Y | Y | N | Y | Y |
| Vermeulen et al.39 | Y | Y | Y | Y | Y | Y | U | Y | N | Y | Y |
| % | 100 | 80 | 80 | 100 | 100 | 80 | 40 | 80 | 0 | 100 | 100 |
N, no; N/A, not applicable; U, unclear; Y, yes.
Findings of the umbrella review
The findings from the included reviews are summarized in narrative form. Detailed information about the aims of the included reviews, search sources and timeframe; characteristics of analyzed studies (number, design, data range and country of origin); characteristics of participants (number and age group) and setting; critical appraisal details and method of analysis are provided in Appendix III.
Description of included reviews
The date range for the reviews included in this umbrella review was from 2011 to 2014, with the primary studies published between 1980 and 2013. All reviews but one37 included prospective studies, and two reviews36,38 focused additionally on retrospective studies. Most of the primary studies included in the cited reviews had observational, cross-sectional or cohort designs; in one case,38 a secondary analysis of RCT data was additionally included. One review37 included studies that aimed to develop a screening tool for frailty in older adults and/or evaluate its psychometric properties.
Search methods
The databases searched most frequently were Cochrane and PubMed. Both were considered in the search process by four reviews (Cochrane35-38 and PubMed36-39). Three reviews35,38,39 undertook searches in Embase. CINAHL was searched in two reviews35,39 as was Scopus.35,38 Clinicaltrials.gov. was searched by one review.38 This review additionally considered conference abstracts published in four scientific journals. MEDLINE, Web of Science, PedRo, AMED and PsycInfo were searched by one review.35 Two reviews36,38 limited their search to studies published in English. One review39 searched for studies written in English and Dutch. In two reviews,35,37 no information about language limiters was found. The widest range of publication date defined for search process was from 1950 to 2014.38 In one review,37 the initial date for search was determined based on the start of databases.
Critical appraisal of primary studies
The assessment of methodological quality of the included primary studies was based on different instruments, including Quality Assessment Tool for Diagnostic Accuracy Studies,35,38 Quality in Prognosis Studies (QUIPS) tool36 with three modified domains, Terwee et al.'s assessment scale for the measurement properties of health status questionnaires37 and a self-constructed list consisting of 27 criteria.39 According to this review's authors,39 the self-constructed list was created using previous research on methodological quality, quality of reporting criteria for observational research and previous reviews regarding prediction of disability. Two reviews36,39 classified the included primary studies as being mostly of high quality39 or as showing predominantly a low risk of bias.36 However, in one of these reviews,36 cases of high risk of attrition bias due to very low response rates or an unclear response rate were identified. Several forms of potential bias, such as spectrum bias (which is described as an error in clinical judgment resulting from the different performance of a diagnostic test in different clinical settings and in different populations) and incorporation bias (associated with the lack of outcome assessors’ blinding to the index test results) were also indicated by authors of another review.38 In one review,35 the risk of bias was classified as unclear. In the review using QUIPS, the overall quality of primary studies was rated as being poor.37 According to these authors, construct validity was the only psychometric property correctly reported in the majority of their reviewed studies and the measure that obtained the best classification met only six of the 10 assessment criteria.
Methods of analysis
From the five reviews included in this umbrella review, four35-37,39 presented findings in a narrative form because of statistical, methodological and/or clinical heterogeneity observed in the primary studies. The remaining review38 meta-analyzed data from primary studies assessing the same index test at the same threshold for the same or similar outcomes at the same follow-up interval based on the random effects model. In this review, the heterogeneity observed between the included primary studies was assessed with pooled estimates of sensitivity and specificity using the DerSimonian-Laird random effects model, and statistical heterogeneity was reported using the index of inconsistency. The test-treatment threshold was examined using the Pauker and Kassirer decision threshold model. When meta-analysis was not possible, the authors presented data in a tabular form.38
Participants
In total, the selected reviews included 227,381 participants. The number of participants reported in the reviews varied from 258537 to 137,545,36 and the number of participants included in individual primary studies from 49 to 36,424. The information about country of origin of primary studies was provided inconsistently. Based on details described in narrative summaries and after the analysis of the titles of the included studies, it was possible to conclude that the primary studies were undertaken in Europe, Middle East, Asia, North America, South America, and Australia and Oceania. However, given that in some cases the geographical location remained unknown, it was not possible to proceed with the analysis of frequency of these data.
Three reviews35,36,39 included community-dwelling older adults; however, in one of these reviews,36 additional criteria for inclusion were applied. These criteria were living independently with or without home care, or living in an assisted living facility.36 From the remaining two reviews,37,38 one presented studies that recruited participants through general practitioners and geriatric consultations, social centers, rehabilitation facilities, retirement homes and electoral lists,37 and the other one focused on older patients admitted to emergency departments.38
Reference tests
The three reviews35-37 comprising reliability, validity and diagnostic accuracy analyses used different reference tests. In one,35 the authors pre-specified that they would include studies using the phenotype model, the cumulative deficit frailty index and the CGA as reference tests. The second review's authors37 identified as reference tests for frailty tools “a more complete geriatric assessment”,37(p.2) without a more specific definition for it. These authors included primary studies that used as reference tests the CGA, the Systeme de Mesure de l’Autonomie Fonctionnelle scale, the Marigliano-Cacciafesta Polypathological Scale (MCPS), the Minimum Data Set for Home Care and the Canadian and American Geriatric Advisory Panel criteria, including patient-reported fatigue, physical performance, walking, number of comorbidities and nutritional state. In a third review,36 the reference tests were not pre-specified, and the authors used the reference tests used in the primary studies they included. Therefore, for the purpose of studying reliability, the phenotype model and the Changes in Health, End-Stage Disease and Signs and Symptoms Scale were used. The reference tests used to examine construct validity were Changes in Health, End-Stage Disease and Signs and Symptoms Scale; Functional Reach Test; Consolice Study of Brain Ageing Score; Edmonton Frail Scale and self-rated health.36 The review authors36 also referred to impairment in activities of daily living, number of comorbidities and sociodemographical variables, such as age and gender, as reference standards for studying construct validity. The reference tests used with the purpose of examining diagnostic accuracy included the phenotype model and the functional domains model.36
Index tests
In total, 26 structured questionnaires and brief assessments,35-38 and eight frailty indicators39 were analyzed by the included reviews. The summarized information regarding structured instruments for identifying frailty is presented in Table 2. Table 3 provides information about frailty indicators and specifies the way these indicators were measured.
Table 2.
Characteristics of questionnaires and brief assessments analyzed in the included reviews
| Tool/study | Reference | Test structure | Administration mode | Scoring system/cutoff point |
| Bright tool | Pialoux et al.37 | 11 simple items evaluating autonomy, close circle, walking, falls, cognition, executive functions, mood and patient perceived health status | Self-administered questionnaire | Not available |
| Clinical Frailty Scale from Canadian Study on Health and Ageing | Carpenter et al.38 | 7 items evaluating levels of frailty, from very fit (robust, active, energetic, well-motivated and fit) to severely frail (completely dependent on others for the activities of daily living, or terminally ill) | Not available | Level 4 describes state of apparent vulnerability |
| Donini Index of Frailty | Carpenter et al.38 | Not available | Not available | Not available |
| Frailty index | Drubbel et al.36 | The list of deficits varying from 13 to 92 items, comprising health deficits (such as symptoms, signs, diseases and impairments) indicative for frailty | Not available | Binary score and/or multilevel score |
| Functional assessment screening package | Pialoux et al.37 | 16 simple items or measures evaluating autonomy, eyesight, hearing, upper limb mobility, urinary incontinence, memory, depression and nutrition | Administration by non-medical staffDuration of administration from 8 to 12 min | Not available |
| General Practitioner assessment | Clegg et al.35 | Focused on physical, psychological and social dimensions of individual functioning | Not available | Not available |
| Groningen Frailty Indicator | Clegg et al.35Pialoux et al.37 | 15 items (the authors did not provide more details about the content of this test) | Suitable for postal completion | Cutoff point ≥4 for moderate-to-severe frailty |
| Identification of Seniors at Risk (ISAR) | Carpenter et al.38 | 6 items considering necessity of patient to be aided on regular basis or to care him/herself; history of hospitalizations during the past six months; eyesight; memory problems; and medication | Not available | Cutoff point ≥2 for high risk of adverse outcomes |
| Mortality risk Index | Carpenter et al.38 | 6 items evaluating risk factors such as age, dependency in activities of daily living, presence of delirium, malnutrition, presence of comorbidities | Not available | Cutoff points ≥3 or ≥5 for high risk of mortality |
| Polypharmacy | Clegg et al.35 | Defined as five or more medications | Not available | Cutoff point for frailty ≥5 medication |
| PRISMA-7 | Pialoux et al.37Clegg et al.35 | 7 simple items exploring gender, autonomy, close circle and walking | Self-administered questionnaireDuration of administration about 3 min | Cutoff point ≥3 for frailty |
| Rowland | Carpenter et al.38 | 7 items mostly focused on (in)dependency in activities of daily living | Not available | Cutoff points ≥2 or ≥3 for high risk of frailty |
| Runciman | Carpenter et al.38 | 8 items, 3 of which have sub-questions, mostly focused on (in)dependency in activities of daily living | Not available | Cutoff points ≥3 or ≥4 for high risk of frailty |
| Schoevaerdts Index of Frailty | Carpenter et al.38 | Not available | Not available | Not available |
| Screening instrument | Pialoux et al.37 | 16 simple items analyzing domains of autonomy, falls, depression and urinary incontinence | Duration of administration about 5 min | Not available |
| Screening letter | Pialoux et al.37 | 9 simple items exploring domains of autonomy, subjective health status, hearing, eyesight and past hospitalizations | Self-administered questionnaire | Not available |
| Self-administered test | Pialoux et al.37 | 49 simple items exploring domains of neurological functions, cardiac and pulmonary functions, continence, locomotion, eyesight, hearing, nutrition and cognitive functions | Self-administered questionnaire | 5 levels of severity: slight, medium, medium serious, serious and very serious |
| Self-rated health | Clegg et al.35Carpenter et al.38 | Not available | Not available | Cutoff point ≤6 for frailty |
| Sherbrooke postal questionnaire | Pialoux et al.37 | 6 simple items evaluating person's immediate circle, medication, walking, eyesight and memory | Self-administered questionnaire | Not available |
| Silver Code | Carpenter et al.38 | 6 items evaluating risk factors, such as age, gender, marital status, previous hospital admissions and prescribed medication | Not available | Cutoff points ≥4 and ≥11 for risk of adverse outcomes |
| Strawbridge questionnaire | Pialoux et al.37 | 16 simple items evaluating eyesight, hearing, cognition, nutrition and physical performance | Self-administered questionnaire | Not available |
| Tilburg frailty indicator | Pialoux et al.37 | 15 simple items evaluating domains of physical, psychological and social functioning, including autonomy, close circle, cognition, mood and physical performance | Self-administered questionnaireDuration of administration about 14 min | Not available |
| Timed-up-and-go test (s) | Clegg et al.35 | Not available | Not available | Cutoff point ≤6 for frailty |
| Triage Risk Screening Tool (TRST) | Carpenter et al.38 | 6 items focused on different risk factors, including evidence of cognitive impairment, living alone, difficulty in walking or recent falls, polypharmacy, previous hospitalizations or admissions to emergency department, nurse concern for elder abuse/neglect, substance abuse, medication non-compliance, activities of daily living problems, or other issues | Not available | Cutoff points ≥2 or ≥3 for high risk of adverse outcomes |
| Variables Indicative of Placement risk (VIP) | Carpenter et al.38 | 3 items focused on different risk factors, including living alone, help for bathing and dressing, help for use the telephone | Not available | Cutoff points ≥1, ≥2 or ≥3 for high risk of adverse outcomes |
| Winograd Index Frailty | Carpenter et al.38 | Not available | Not available | Not available |
Table 3.
Characteristics of frailty indicators analyzed in the included reviews
| Frailty indicator | Reference | Measurement | Scoring system/cutoff point |
| Gait speed | Vermeulen et al.39Clegg et al.35 | 10 foot distance back and forth, as fast as possible8 foot distance twice at a usual pace, fastest timed walk was used for scoring purposes15 ft at a usual pace3-m distance back and forth, as fast as possible4-m distance twice, as fast as possible5-m distance (measured between the 3 and 8 m marks from the start of the walkway), maximal walking speed (of two attempts)11-m distance: 5-m with usual and maximum walking speed, and 6-m at rapid pace30-m distance, maximal walking speed | Slow gait speed defined as:- the lowest quartile- the lowest quintile- taking 10 s or more- taking longer than 10 s to walk 10 ft back and forth- taking longer than 9 s to walk 8 ft- taking longer than 5.7 s to walk 8 ft- being slower than 0.09 m/s or being unable to be completed- being slower than 0.7 m/s- being slower than 0.8 m/s- being slower than 0.9 m/s- being slower than 1 m/s |
| Physical activity | Vermeulen et al.39 | Measured:- with a modified Paffenbarger survey- with a standardized self-administered questionnaire (low, middle and high duration and intensity)- with the Physical Activity Scale for the Elderly (PASE) questionnaire- with an ordinal 7-point scale, dichotomized into absent/light activity versus moderate activity- by asking participant how often they go outdoors (daily, nearly daily, 2–3 times a week, once a week, less than once a week)Participants were considered as exercisers when:- they exercised at least four days a week- they participated in walking, hiking, bicycling, aerobics, swimming, water aerobics, weight training or other exercise at least three times per week- they exercised at least twice a week- they thought they get enough exercise (participants were also asked whether they think they are more, the same, or less active compared to others their age to assess the level of physical activity) | Low activity level defined as*:- the lowest quintile- score below 64 for men and below 52 for women in the PASE questionnaire |
| Weight loss | Vermeulen et al.39 | Weight was measured at baseline and after two-year follow-up or during annual examsParticipants were asked at baseline whether they lost more than 10 pounds in the past year and (in some cases) whether this was intentional or not | Weight loss defined as:- loss of 5% or more of the total body weight after two-year follow-up- loss of 5% of total body weight between consecutive annual visits or from baseline, without an intervening 5% gain |
| Muscle strength or handgrip strength | Vermeulen et al.39 | Maximum grip strength in both hands measured with a Vigorimeter at an elbow-angle of 90° and with the shoulder joint in neutral position (medium-sized ball for women and big ball for men)Averaged maximum grip strength in both hands measured with a grip dynamometerMaximum grip strength (measured in two efforts) in the dominant hand using a hand dynamometer or mechanical dynamometerMaximum grip strength (measured in three efforts)Grip strength in dominant hand measured in kilograms using a hand-held dynamometer in a sitting position with elbow resting on the tableGrip strength measured using hand-held dynamometerUpper extremity strength assessed using the Martin dynamometer | Low grip strength defined as*:- the lowest quintile- the lowest quartile- the lowest quartile within gender group- being below sex- and body mass index-specific cutoff points- being scored 5 kg or less |
| Balance | Vermeulen et al.39 | Examined:- with a balance subscale of the Performance Oriented Mobility Assessment- with a side-by-side, sterna nudge, tandem and one-leg stands subtests of the Performance Oriented Mobility Assessment- with three balance related tasks of increasing difficulty (side-by-side, semi-tandem and tandem stand) which were timed and scored on a 3-point scale- by timing how long participants could stand on 1 leg until balance was lost (with scores divided into quartiles)- with a chair stand test and balance test | Not available |
| Exhaustion | Vermeulen et al.39 | Measured through the questions about how often the participants “felt like everything they did was an effort” and how often “they could not get going” | Exhaustion was defined as answering “much or most of the time” to one of the two presented questions |
| Lower extremity function | Vermeulen et al.39 | Measured by adding the rescaled scores for the walking speed test, chair stands test and standing balance test. The walking distance and number of chair stands differed form study to study | Low lower extremity function defined based on*:- quartiles of performance- score of performance |
| Combination of chair stands, 360° turn, bending over, foot taps and hand signature | Vermeulen et al.39 | Measured through the timed performance on the tests of:- 10-ft taps, three chair stands, 360° turn, time to bend over and pick up a pen, and time to pick up a pencil and complete a signature- three chair stands, 360° turn, and rapid gait back and forth over a 10-ft course | Poor performance defined based on quartiles of performance |
*Not all primary studies included in the review determined the indicators of poor performance.
The structured questionnaires and brief assessments described by the included reviews differed from each other in terms of test structure, administration mode and duration, and scoring system. In addition, different cutoff points of the same test were used in different primary studies. Unfortunately, many specific details related to the analyzed index tests were not provided. One review36 reported data related to a single frailty measure (the Frailty Index) in its different existing variants. Only two screening tests and one brief assessment were used by more than one review. These measures were PRISMA 7, Groningen frailty indicator and index of self-rated health.
Physical indicators of frailty included low gait speed, unintended weight loss, low muscle strength or hand grip strength, low physical activity, low balance, low lower extremity function, exhaustion, poor performance on chair stands, 360° turn, bending over, foot taps and hand signature. One review39 focused on all these indicators. Gait speed was additionally addressed in another review.35 Details of the variations in how these indicators were measured in the primary studies are given in Table 3.
The authors of one review38 reported findings related to the CSHA Clinical Frailty Scale that was considered by the authors of this umbrella review as a reference test. Given that the reference tests were defined only for outcomes of reliability, validity and diagnostic accuracy, and the cited review38 focused on predictive ability, the data on this measure were still extracted. In relation to different versions of the frailty index analyzed by Drubbel et al.,36 although all of them comprised a list of health deficits that were indicative of frailty, constructed within the cumulative deficit model, none of these measures was based on a CGA (as, according to the authors,36 variants of the frailty index based on a CGA had reduced feasibility for use in general practice). Hence, it was decided to include the findings on the different versions of the frailty index reported by Drubbel et al.36 in the analysis.
Outcomes
Three reviews35-37 included in this umbrella review focused on reliability, validity and diagnostic accuracy of frailty measures. The details of these reviews regarding method of analysis, outcomes assessed, reference and index tests and conclusions of review authors are summarized in Table 4. In relation to findings from these three reviews, they are reported in narrative format and summarized in Tables 5–7.
Table 4.
Summary of characteristics of reviews focused on reliability, validity and diagnostic accuracy of frailty measures
| Reference | Clegg et al.35 | Drubbel et al.36 | Pialoux et al.37 |
| Method of analysis | Narrative summary | Narrative summary | Narrative summary |
| Outcomes assessed | SensitivitySpecificityPositive and negative predictive valuesPositive and negative likelihood ratios | Construct validityResponsiveness | Content validityInternal consistencyCriterion validityConstruct validityAgreementReliabilityResponsivenessFloor and ceiling effectsInterpretability |
| Reference tests | 1. Phenotype model2. Cumulative deficit frailty index3. Comprehensive geriatric assessment | 1. Phenotype model2. Changes in Health, End-Stage Disease and Signs and Symptoms Scale3. Functional Reach Test4. Consolice Study of Brain Ageing Score5. Edmonton Frail Scale6. Impairment in Activities of daily living and number of comorbidities7. Self-rated health8. Functional Domains Model | 1. Comprehensive geriatric assessment2. Systeme de Mesure de l’Autonomie Fonctionnelle scale3. Marigliano-Cacciafesta Polypathological Scale4. Minimum Data Set for Home Care5. The Canadian and American Geriatric Advisory Panel criteria including patient-reported fatigue, physical performance, walking, number of comorbidities and nutritional state |
| Index test | 1. Gait speed2. General practitioner clinical judgment3. Polypharmacy4. Groningen frailty indicator5. PRISMA 76. Self-rated health7. Timed-up-and-go test | 1. Frailty Index (defined as a list of health deficits for which patients were screened and that provided score reflecting the proportion of deficits present on the predefined list) | 1. Screening Letter2. Sherbrooke Postal Questionnaire3. Functional Assessment Screening Package4. Screening Instrument5. Strawbridge Questionnaire6. PRISMA-77. Bright Tool8. Self-Administered Test9. Tilburg Frailty Indicator10. Groningen Frailty Indicator |
| Conclusions of authors of the included reviews(see also Tables 5–7 for actual findings) | When compared with the Phenotype model, the gait speed, PRISMA 7 and the Timed-up-and-go test have high sensitivity for identifying frailty. However, limited specificity implies many false-positive results which means that these instruments cannot be used as accurate single tests to identify frailty | Frailty index demonstrates good criterion and construct validity, but its discriminatory ability is poor to moderate. However, future research is necessary to investigate whether the psychometric properties of Frailty Index are generalizable to primary care setting and to facilitate its interpretation and implementation in daily clinical practice | Tilburg Frailty Indicator was shown to be the strongest statistically and appears as potentially relevant for screening for frailty in a primary care setting. However, validation of this instrument in larger studies in primary health care settings and with more quality criteria is required |
Table 5.
Findings related to reliability of frailty measures
| Index tests (cutoff) | Reliability | |||
| Reference | Number of studies/participants | Results/findings | Heterogeneity | |
| Groningen Frailty Indicator (not available) | Pialoux et al.37 | 1/687 | Acceptable internal consistency | N/A |
| Sherbrooke Postal Questionnaire (not available) | Pialoux et al.37 | 1/687 | Unacceptable internal consistency | N/A |
| Tilburg Frailty Indicator (score of 5) | Pialoux et al.37 | 2/932 and 962 one year later | Substantial inter-rater reliability and acceptable internal consistency | Clinical (subjects randomly recruited from municipal registers vs recruited in general practitioner surgeries) |
| Bright Tool (score of 3) | Pialoux et al.37 | 1/120 | Substantial inter-rater reliability and acceptable internal consistency | N/A |
| Functional Assessment Screening Package (not available) | Pialoux et al.37 | 1/109 | Substantial to excellent inter-rater reliability | N/A |
| Strawbridge Questionnaire (not available) | Pialoux et al.37 | 1/48 | Substantial inter-evaluation agreement and fair inter-rater reliability | N/A |
N/A: not applicable.
Table 7.
Findings related to diagnostic accuracy of frailty measures
| Index tests (cutoff) | Sensitivity and specificity | ||||
| Reference | Number of studies/participants | Reference standard | Results/findings | Heterogeneity | |
| Gait speed(<0.7 m/s)(<0.8 m/s)(<0.9 m/s) | Clegg et al.35 | 1/1327 | Phenotype model | Slow gait speed has high sensitivity and low-to-moderate specificity | Methodological (cut-off <0.7, <0.8 and <0.9 m/s were used) |
| Timed-up-and-go test (TUGT) (>10 s) | Clegg et al.35 | 1/1814 | Phenotype model | TUGT has high sensitivity and moderate specificity for identifying frailty | N/A |
| Screening Letter (not available) | Pialoux et al.37 | 1/102 | CGA | Screening Letter has high sensitivity and moderate specificity for identifying frailty | N/A |
| PRISMA 7 (≥3) (not available) | Clegg et al.35Pialoux et al.37 | 2/714 | Phenotype model/SMAF | In one study, PRISMA 7 demonstrated relatively high sensitivity and specificity for identifying frailty.In the other study, either specificity or sensitivity for identifying frailty was moderate | Methodological (different reference tests were used; the cutoff was identified only in one study) |
| Self-rated health (≤6) | Clegg et al.35 | 1/120 | Phenotype model | Self-rated health has relatively high sensitivity and moderate specificity for identifying frailty | N/A |
| General practitioner clinical assessment (dichotomous) | Clegg et al.35 | 1/120 | Phenotype model | General practitioner clinical assessment has moderate sensitivity and moderate specificity for identifying frailty | N/A |
| Polypharmacy (≥5 medication) | Clegg et al.35 | 1/120 | Phenotype model | Index of polypharmacy has moderate sensitivity and moderate specificity for identifying frailty | N/A |
| Functional Assessment Screening Package (not available) | Pialoux et al.37 | 1/109 | CGA | Functional Assessment Screening Package has moderate-to-high sensitivity and low-to-high specificity for identifying frailty | N/A |
| Screening Instrument (not available) | Pialoux et al.37 | 1/150 | CGA | Screening Instrument has moderate-to-high sensitivity and moderate-to-high specificity for identifying frailty | N/A |
| Bright Tool (score of 3) | Pialoux et al.37 | 1/120 | CGA | Bright Tool has moderate sensitivity and relatively high specificity for identifying frailty | N/A |
| Groningen Frailty Indicator (≥4) | Clegg et al.35 | 1/120 | Phenotype model | Groningen Frailty Indicator has relatively low sensitivity and moderate specificity for identifying frailty | N/A |
| Sherbrooke Postal Questionnaire (not available) | Pialoux et al.37 | 1/842 | SMAF | Sherbrooke Postal Questionnaire has moderate sensitivity and relatively low specificity for identifying frailty | N/A |
| Frailty Index with binary scoring (not available) | Drubbel et al.36 | 2/6378 | Phenotype Model/Functional Domains Model | Frailty Index has low-to-moderate sensitivity and moderate-to-high specificity for identifying frailty | Methodological (list of 38 deficits and list of 48 deficits were used) |
CGA: comprehensive geriatric assessment; DTA: diagnostic test accuracy; N/A: not applicable; SMAF: Systeme de Mesure de l’Autonomic Fonctionnelle scale. Values ≥80 were considered as indicative of high specificity and sensitivity, values ≥60 and <80 as indicative of moderate specificity and sensitivity, and values <60 as indicative of low specificity and sensitivity.
Predictive ability of frailty measures was addressed by three other reviews.36,38,39 The summary of characteristics of these reviews, including method of analysis, outcomes assessed and follow-up interval, index tests and conclusions of review authors, is presented in Table 8. Tables 9–11 describe findings from these reviews. These findings are also reported in narrative format.
Table 8.
Summary of characteristics of reviews focused on predictive ability of frailty measures
| Reference | Carpenter et al.38 | Drubbel et al.36 | Vermeulen et al.39 |
| Method of analysis | Random effect model for studies assessing the same index test at the same threshold for the same or similar outcomes at the same follow-up intervalInter-study heterogeneity was assessed with pooled estimates of sensitivity and specificity using the DerSimonian-Laird random effects modelStatistical heterogeneity was reported using the index of inconsistencyThe test-treatment threshold was examined using the Pauker and Kassirer decision threshold model | Narrative summary | Narrative summary |
| Outcomes assessed | Sensitivity, specificity, positive and negative likelihood ratios for predictors of adverse outcomes:- return emergency department visits- hospital readmissions- institutionalization- functional decline- mortality | Criterion validity (defined as an ability of the Frailty Index to predict adverse health outcomes):- death- institutionalization- emergency department visits- recurrent falls- recurrent fractures- hospitalization- change in instrumental activity of daily living score- change in mental score- new disease at three years | Predictive ability for future disability of activities of daily living |
| Index test/frailty indicators | Identification of Seniors at RiskTriage Risk Screening ToolThe Silver CodeVariables Indicative of Placement RiskMortality Risk IndexThe Rowland instrumentThe Runciman instrumentDonini Index of FrailtyWinograd Index of FrailtySchoevaerdts Index of FrailtySelf-rated healthCanadian Study of Health and Aging Clinical Frailty Scale | 1. Frailty Index | Physical frailty indicators:-Weight loss-Gait speed-Grip strength-Physical activity-Balance-Lower extremity function-Exhaustion-Chair stands-360° turn, bending over, foot taps and hand signature |
| Follow-up period | 14 days to 12 months after emergency department encounter | One to 12 years | One to 14 years |
| Conclusions of authors of the included reviews(see also Tables 9–11 for actual findings) | Existing instruments designed to risk stratify older patients admitted to Emergency Departments do not accurately distinguish high- or low-risk subsets and should be not used by key stakeholders for this purpose | Criterion validity (defined as the ability to predict adverse health outcomes) of Frailty index was shown to be good | Unintended weight loss, lower slow gait speed, lower grip strength, poor balance, low lower extremity function and low physical activity can predict future disability in activities of daily living in community-dwelling people, with gait speed and low physical activity being the most powerful predictors.Exhaustion appears not to predict future disability of activities of daily living; however only one of the reviewed studies focused on this outcome.Physical frailty indicators do not only predict disability when they are related together in a frailty phenotype but also independently |
Table 9.
Findings related to predictive ability of frailty measures in community-dwelling older adults
| Index tests | Predictive ability | ||||
| Reference | Adverse health outcome | Number of studies/participants | Results/findings | Heterogeneity | |
| Tilburg Frailty Indicator | Pialoux et al.37 | Quality of life, autonomy and resorting to care | 1/245 and 275 one year later | The predictive value of this tool for quality of life, autonomy and resorting to care is statistically robust | N/A |
| Frailty Index (FI)*Reviewed FIs included from 13 to 92 deficits and were based on binary or binary/multilevel scoring | Drubbel et al.36 | Recurrent falls | 1/3257 | Accuracy is sufficient to predict increased risk of recurrent falls at eight years after evaluation | N/A |
| Drubbel et al.36 | Recurrent fractures | 1/3257 | Accuracy is sufficient to predict increased risk of recurrent fractures at eight years after evaluation | N/A | |
| Drubbel et al.36 | ADL decline | 1/2032 | Accuracy is sufficient to predict increased risk of ADL decline at three years after evaluation | N/A | |
| Drubbel et al.36 | Change in mental score | 1/2032 | Accuracy is sufficient to predict increased risk of change in mental score at three years after evaluation | N/A | |
| Drubbel et al.36 | New diseases | 1/2032 | Accuracy is sufficient to predict increased risk of new disease at three years after evaluation | N/A | |
| Drubbel et al.36 | Hospitalization | 1/1066 | Accuracy is sufficient to predict increased risk of hospitalization at 12 months after evaluation | N/A | |
| Drubbel et al.36 | Change in hospital days | 1/2032 | Accuracy is sufficient to predict increased risk of change in hospital days at three years after evaluation | N/A | |
| Drubbel et al.36 | Institutionalization | 2/25,018 | Accuracy is sufficient to predict increased risk of institutionalization at 12 months after evaluation | Methodological (list of 50 deficits and list of 83 deficits were used; binary scoring and binary/multilevel scoring were applied) | |
| Drubbel et al.36 | Mortality | 14/123,320 | Accuracy is sufficient to predict increased risk of mortality at 12, 24 and 120 months after evaluation | Statistical (FI data used as an unique predictor vs FI data used within multivariable model with age, gender and comorbidities)Methodological (follow-up periods from 12 to 120 months) | |
| Drubbel et al.36 | Multiple negative outcomes (ED visits, out of hours GP surgery visits, nursing home admission and mortality) | 1/1679 | Accuracy is sufficient to predict increased risk of multiple negative outcomes at 24 months after evaluation | N/A | |
ADL: activities of daily living; GP: general practitioner; N/A: not applicable.
*Predictive ability for adverse outcomes was evaluated in order to determine the criterion validity of the instrument.
Table 11.
Findings related to predictive ability of frailty indicators
| Predictive ability | |||||
| Frailty indicator/risk factors | Reference | Adverse consequences | Number of studies/participants | Results/findings | Heterogeneity |
| Gait speed | Vermeulen et al.39 | ADL disability | 12/23,277 | Lower gait speed is associated to higher risk of developing ADL disability | Methodological (measures of average vs highest/lowest gait speed were used; different distances were used)Clinical (older adults free or not free of ADL disability at baseline were assessed) |
| Physical activity | Vermeulen et al.39 | ADL disability | 9/20,899 | More physical activity or regular participation in exercise are associated to a lower risk of developing ADL disability | Methodological (different criteria for definition of exercisers were used)Clinical (older adults free and not free of ADL disability at baseline were assessed) |
| Unintended weight loss | Vermeulen et al.39 | ADL disability | 4/6752 | Unintended weight loss is associated to higher risk of developing ADL disability | Methodological (loss of 5% or more of the total body weight vs loss of more than 10 pounds were considered) |
| Balance | Vermeulen et al.39 | ADL disability | 6/5076 | Low balance is associated to higher risk of developing ADL disability | Methodological (different balance tasks were used)Clinical (older adults free and not free of ADL disability at baseline were assessed) |
| Lower extremity function | Vermeulen et al.39 | ADL disability | 5/10,050 | Low lower extremity function is associated to higher risk of developing ADL disability | Methodological (different lower extremity function tasks were used)Clinical (older adults free and not free of ADL disability at baseline were assessed) |
| Chair stands | Vermeulen et al.39 | ADL disability | 3/2812 | Low performance on chair stands is associated to higher risk of developing ADL disability | Clinical (older adults free and not free of ADL disability at baseline were assessed) |
| 360° turn, bending over, foot taps and hand signature | Vermeulen et al.39 | ADL disability | 1/563 | Lower performance in 360° turn, bending over, foot taps and hand signature is associated to higher risk of developing ADL disability | N/A |
| Muscle strength or hand grip strength | Vermeulen et al.39 | ADL disability | 10/13,916 | Seven studies concluded that poor muscle strength or hand grip strength are predictors of ADL disabilityThree studies concluded that poor muscle strength or hand grip strength are not predictors of ADL disability | Methodological (different numbers of measurements were considered; evaluation was performed in the dominant hand or in both hands)Clinical (older adults free and not free of ADL disability at baseline were assessed) |
| Exhaustion | Vermeulen et al.39 | ADL disability | 1/754 | Exhaustion is not a predictor of future ADL disability | N/A |
ADL: activities of daily living (in all cases, ADLs referred would be described as basic ADLs, such as bathing, dressing, eating, transferring, toileting, continence, walking inside the home); ED: emergency department; N/A: not applicable.
Reliability of index tests
The reliability of frailty screening tools defined in terms of internal consistency and repeatability of findings was systematically analyzed in only one review.37 The authors of this review reported data related to 10 measures, including Screening Letter, Sherbrooke Postal Questionnaire, Functional Assessment Screening Package, Screening Instrument, Strawbridge Questionnaire, PRISMA-7, Bright Tool, Self-Administered Test, Tilburg Frailty Indicator and Groningen Frailty Indicator. From all these measures, only four were described in terms of internal consistency: Tilburg Frailty Indicator (α from 0.73 to 0.79), Groningen Frailty Indicator (α = 0.73), Bright Tool (α = 0.77) and Sherbrooke Postal Questionnaire (α = 0.26).37 Internal consistency of Tilburg Frailty Indicator, Groningen Frailty Indicator and Bright Tool was judged to be acceptable, and that of Sherbrooke Postal Questionnaire was judged to be unacceptable.
Data about inter-rater reliability was reported for four measures.37 The Functional Assessment Screening Package was shown to have substantial to excellent inter-rater reliability (kappa = 0.77–1.00), Tilburg Frailty Indicator and Bright Tool were shown to have substantial inter-rater reliability (kappa = 0.79 and 0.77, respectively) and Strawbridge Questionnaire was shown to have low inter-rater reliability (kappa = 0.29). Information about substantial inter-evaluation agreement in relation to Strawbridge Questionnaire and CGA was also provided, being 0.67 (statistical test used for this analysis was not specified). Findings describing the reliability of frailty measures are summarized in Table 5.
Validity of index tests
Validity of frailty measures was addressed in two reviews.36,37 One review37 provided data in relation to the Tilburg Frailty Indicator and the Self-Administrated Test. The Self-Administrated Test was compared to MCPS, with the classifications obtained by these two measures being similar in 48% of cases, at a “better” level for Self-Administered Test and at a “worse” level for MCPS in 45% of cases, and at a “worse” level for Self-Administered Test and at a “better” level for MCPS in 7% of cases.37 The description of the Tilburg Frailty Indicator included information about significant Pearson correlations (P < 0.001) for each item and each frailty domain in comparison with the reference measure (CGA).37 The authors of this review37 additionally analyzed whether the included primary studies reported validity of frailty measures, identifying the tools with fulfilled quality criteria for measurement properties. However, this information was used merely for the purpose of methodological quality assessment, not accompanied by values of statistical tests.
The second review36 focused on different versions of the Frailty Index, summarizing details regarding criterion validity, construct validity and responsiveness. Given that assessment of criterion validity was performed based on the ability of the analyzed tool to predict adverse health outcomes, without addressing its concurrent and postdictive aspects, it was decided to include these data in the section on the predictive ability of frailty measures.
In terms of construct validity, different versions of the Frailty Index showed a positive correlation with different scales used as reference: the version assessing 36 deficits correlated with Functional Reach Test (r = 0.73), the version assessing 43 deficits correlated with Consolice Study of Brain Ageing score (r = 0.72), the version assessing 70 deficits correlated with Frailty Phenotype (r = 0.65) and the version assessing 50 deficits with Edmonton Frail Scale (r = 0.61).36 Negative correlations were found between the 50-deficit version of the Frailty Index and Changes in Health, End-Stage Disease and Signs and Symptoms scale. The authors of this review36 also reported positive correlation between the 38-deficit Frailty Index and self-rated health (r = 0.49), as well as between two different versions of the Frailty index comprising 37 deficits (one including and one excluding activities of daily living and comorbidities) and functional impairments in activities of daily living and comorbidity. In this last case, the coefficients of correlations were not provided. In addition, the Frailty Index was compared with the frailty phenotype and the scale of Changes in Health, End-Stage Disease and Signs and Symptoms, and the values of weighted kappa were 0.17 (95% confidence interval [CI] 0.13–0.20) and 0.36 (95% CI 0.31–0.40), respectively.36
It was also revealed that older people and women show higher scores on the Frailty Index. However, in one of the cited primary studies, the opposite association between the Frailty Index score and gender was observed. Unfortunately, the authors of this review36 did not provide details about the items comprising each of the Frailty Index versions or interpretations of the obtained finding. Thus, it is difficult to explain differences observed in the relationship between the Frailty Index and gender. Findings related to validity of frailty measures are presented in Table 6 .
Table 6.
Findings related to (construct) validity of frailty measures
| Index tests | Validity | ||||
| Reference | Number of studies/participants | Reference standard/putative correlates | Results/findings | Heterogeneity | |
| Frailty Index (FI)Reviewed FIs included from 13 to 92 deficits and were based on binary or binary/multilevel scoring | Drubbel et al.36 | 1/2740 | Functional reach test | Strong positive correlation between index test and reference test was found | N/A |
| Drubbel et al.36 | 1/1016 | Consolice Study of Brain Ageing score | Strong positive correlation between index test and reference test was found | N/A | |
| Drubbel et al.36 | 1/23,952 | Edmonton Frail Scale; CHESS scale | Index test correlated positively with Edmonton Frail Scale and negatively with CHESS scale | N/A | |
| Drubbel et al.36 | 1/2305 | Frailty phenotype | Positive correlation between index test and reference test was found | N/A | |
| Drubbel et al.36 | Not clear | Phenotype modelCHESS scale | Slight (when compared to phenotype model) and fair (when compared to CHESS scale) Weighted Kappa | ||
| Drubbel et al.36 | 1/2305 | Impairment in ADL and number of comorbidities | Positive correlation between index test and reference test was found | N/A | |
| Drubbel et al.36 | 1/1318 | Self-rated health | Positive correlation between index test and reference test was found | N/A | |
| Drubbel et al.36 | 3/28,1356/46,043 | Age | In three studies weak positive correlations between index test and reference standard were foundSix studies reported increase in FI score with age ranging from +0.02 to 0.05/year | Methodological (list of deficits ranging from 13 to 92 were used; binary scoring and binary/multilevel scoring were applied) | |
| Drubbel et al.36 | 18/108,8721/23,952 | Age and gender | In 18 studies was demonstrated that older people and women show higher FI scores.One study reported a lower percentage of women in the most-frail group | Methodological (list of deficits ranging from 13 to 92 were used; binary scoring and binary/multilevel scoring were applied) | |
| Tilburg Frailty Indicator (score of 5) | Pialoux et al.37 | 1/245 and 275 one year later | CGA | Significant Pearson correlations for each item and each frailty domain in comparison with the reference measure | N/A |
| Self-Administered Test (not available) | Pialoux et al.37 | 1/100 | MCPS | 48% of classifications were similar between two instruments; 45% of classifications were at a “better” level for Self-Administered Test and at a “worse” level for MCPS; 7% of classifications were at a “worse” level for Self-Administered Test and at a “better” level for MCPS | N/A |
ADL: activities of daily living; CGA: comprehensive geriatric assessment; CHESS: changes in health, end-stage disease and signs and symptoms; MCPS: Marigliano-Cacciafesta Polypathological Scale; N/A: not applicable.
Diagnostic accuracy of index tests
Three reviews35-37 provided data related to diagnostic accuracy of frailty measures (Table 7). In one review,35 sensitivity and specificity of seven measures, including gait speed (with three different cutoff points: <0.7, <0.8 and <0.9 m/s), general practitioner clinical judgment, index of polypharmacy, Groningen frailty indicator, PRISMA 7, index of self-rated health and Timed-up-and-go test, were reported. Sensitivity and specificity of PRISMA 7 were also reported by authors of another review,37 being accompanied by indicators of diagnostic accuracy of Screening Letter, Sherbrooke Postal Questionnaire, Functional Assessment Screening Package, Screening Instrument and Bright Tool. In a third review,36 data regarding the Frailty Index were provided.
The highest sensitivity for identifying frailty (1.00) was reported in relation to gait speed with a cutoff point <0.9 m/s.35 However, specificity of this measure was shown to be low (0.56). A slight reduction in sensitivity and slight increase in specificity were found in relation to gait speed with a cutoff point <0.8m/s (sensitivity = 0.99 and specificity = 0.64). Similarly, the reduction of the gait speed cutoff point to <0.7 m/s was associated with a further decrease of sensitivity (0.93) and increase of specificity (0.77).35 High sensitivity and moderate specificity for identifying frailty were also revealed for Screening Letter (sensitivity = 0.95 and specificity = 0.68)37 and Timed-up-and-go test score >10 s (sensitivity = 0.93 and specificity = 0.62).35
Functional Assessment Screening Package and Screening Instrument were found to have moderate-to-high sensitivity (0.70–0.95 and 0.65–0.93, respectively) and low-to-high specificity (0.64–0.95 and 0.50–0.96, respectively) for identifying frailty.37 In relation to PRISMA 7, the values of sensitivity and specificity for identifying frailty were shown to be from moderate to relatively high (0.78–0.83 and 0.74–0.83, respectively).35,37 Relatively high sensitivity (0.83) and moderate specificity (0.72) for identifying frailty were reported in relation to index of self-rated health.35 Bright Tool showed to have moderate sensitivity (0.65) and relatively high specificity (0.84) for identifying frailty.37 The Frailty Index's sensitivity for identifying frailty was revealed to be from low to moderate (38.0–60.7); however, specificity of this measure was shown to be relatively high (83.5–91.5).36
Lower values of test accuracy were reported for Sherbrooke Postal Questionnaire (sensitivity = 0.75 and specificity = 0.52), General Practitioner Clinical Assessment (sensitivity = 0.67 and specificity = 0.76), index of polypharmacy (sensitivity = 0.67 and specificity = 0.72) and Groningen Frailty Indicator (sensitivity = 0.58 and specificity = 0.72).35,37
Predictive ability of index tests
Predictive ability of frailty measures was systematically analyzed in three reviews.36,38,39 In one review,38 only data regarding available screening tools for use in emergency departments were considered. These tools were the Identification of Seniors at Risk, the Triage Risk Screening Tool, the Silver Code, the Variables Indicative of Placement Risk, the Mortality Risk Index, the Rowland instrument, the Runciman instrument, the Donini Index of Frailty, the Winograd Index of Frailty, the Schoevaerdts Index of Frailty and the Self-rated Health. Participants were older adults admitted to or discharged from the emergency department. The remaining two reviews36,39 focused on community-dwelling older adults: one of these two reviews36 provided data on the Frailty Index; and the other one39 addressed frailty indicators. The follow-up reported in three reviews varied from 14 days to 14 years. The adverse health outcomes included recurrent falls and fractures, change in activity of daily living score, functional decline/dementia, new disease at three years, (return) emergency department visits, hospitalization and hospital re-admissions, institutionalization and mortality. The characteristics of reviews addressing predictive ability of frailty measures are summarized in Table 8.
Predictive ability of frailty screening tools in community-dwelling adults
The Frailty Index was the only screening tool that was systematically analyzed for predictive ability based on data obtained with community-dwelling older adults.36 However, the reported data referred to different versions of this measure, ranging from 13 to 92 items. The Frailty Index was shown to be sufficiently accurate to predict increased risk of: (i) recurrent falls and recurrent fractures at eight years after evaluation; (ii) decline in activities of daily living, changes in mental score, new disease and change in hospital days at three years after evaluation; (iii) hospitalization and institutionalization at 12 months after evaluation; and (iv) mortality at 12, 24 and 120 months after evaluation. The Frailty Index was also shown to have sufficient ability to predict increased risk of multiple negative outcomes (such as emergency department visits, out of hour's general practitioner surgery visits, nursing home admission and mortality) at 24 months after evaluation.
Authors of another review37 reported statistically robust (P < 0.001) predictive value of the Tilburg Frailty Indicator for quality of life, autonomy and resorting to care. However, given that the review authors did not focus on the predictive ability of the analyzed measures, it is possible that important data complementary to the cited findings were missing.
Findings describing predictive ability of frailty measures in community-dwelling adults are presented in Table 9.
Predictive ability of frailty screening tools in older patients admitted to emergency department
Only one review38 addressed predictive ability of screening tools validated in emergency departments. Some measures addressed in this review, including Donini Index of Frailty, Winograd Index of Frailty, Schoevaerdts Index of Frailty, Mortality Risk Index, Rowland instrument, Runciman instrument, CSHA Clinical Frailty Scale and self-rated health, were analyzed based on findings from a single study. Other measures, including Identification of Seniors at Risk, Triage Risk Screening Tool, The Silver Code and Variables Indicative of Placement Risk, were described using data obtained in more than one study. Whenever possible, meta-analysis was performed, using thresholds for LR+ of ≥10 and for LR− of ≤0.1. The outcomes of interest considered in the cited review38 included return to emergency department, functional decline, hospital re-admission, institutionalization and mortality.
Mortality Risk Index was evaluated in terms of its capacity to predict two-year mortality after presentation to the emergency department, with two thresholds (≥3 or 5) used to define “abnormality” (the review authors38 did not specify the concept of abnormality). This measure lacked prognostic accuracy to predict the risk of adverse outcome.38 Donini Index of Frailty, Winograd Index of Frailty and Schoevaerdts Index of Frailty were analyzed for institutionalization or mortality at 12 months after admission to emergency department and were revealed not to be sufficiently accurate to predict increased risk of any of these adverse outcomes.38 Rowland and Runciman instruments were examined for returns to the emergency department, hospital re-admission, mortality or different combinations of these adverse outcomes at six months after admission to the emergency department. Both instruments were shown to have insufficient ability to predict the indicated outcomes of interest.38 The CSHA Clinical Frailty Scale was assessed as a predictor of hospital readmission at 30 or 90 days, and was shown to be an inaccurate predictor of this adverse health outcome. The measure of self-rated health stratified as bad (fair/poor) or non-bad (good/excellent) was screened in terms of its predictive ability for return to emergency department at 30 and 90 days after admission. It was shown not to be associated with an increased risk of adverse outcome.38
The predictive ability of Silver Code was examined in two different studies.38 One of these studies defined as outcomes of interest returns to emergency department, hospital re-admission, mortality or different combinations of these, and considered results obtained six months after admission to an emergency department. Another study focused on risk of mortality at 12 months after the episode in an emergency department. In both studies, thresholds of ≥4 and ≥11 were used to define “abnormality”. Regardless of threshold and follow-up interval, Silver Code was revealed to have insufficient prognostic accuracy to predict increased risk of adverse outcomes.
Four studies assessed predictive ability of Variables Indicative of Placement Risk.38 Three studies focused on outcome of hospital re-admission at 30 days using “abnormality” thresholds of ≥1, ≥2 and ≥3. Inter-study heterogeneity was evaluated based on data reported in only two of these studies. For the purpose of meta-analysis, threshold of ≥1 was considered. Pooled estimates of sensitivity (79; 95% CI 69–86) and specificity (18; 95% CI 15–21) demonstrated variable statistical heterogeneity with I2 ranging from 0 to 99.5%. Based on pooled estimates of LR+ (0.98; 95% CI 0.83–1.17) and LR− (1.11; 95% CI 0.59–2.09), the measure Variables Indicative of Placement Risk was considered not sufficiently accurate to predict increased risk of hospital re-admission at 30 days after presentation to the emergency department. The results of the study not considered in meta-analysis pointed in the same direction.38
Moreover, two studies examined Variables Indicative of Placement Risk for functional decline at 30 days using “abnormality” thresholds of ≥1 and ≥2. Data reported in these studies were meta-analyzed. I2 ranging from 0 to 99.5% (sensitivity: 82; 95% CI 77–86; specificity: 37; 95% CI 33–42) indicated significant statistical heterogeneity. Pooled estimates of LR+ (1.92; 95% CI 0.58–6.41) and LR− (0.63; 95% CI 0.50–0.78) demonstrated that predictive ability of Variables Indicative of Placement Risk for outcome of interest was not sufficient to be clinically useful.38
Several studies assessed predictive ability of Triage Risk Screening Tool.38 Outcomes of interest considered in these studies included returns to the emergency department, functional decline, hospital re-admission and different combinations of these adverse outcomes. The follow-up intervals varied from 30 to 180 days. The thresholds for “abnormality” were defined based on one, two or three affirmative responses; however, for the purpose of meta-analysis, only threshold of ≥2 was used. The pooled estimates of sensitivity and specificity for all outcomes at all follow-up intervals demonstrated statistically significant heterogeneity (I2 often >50%). Pooled estimates of LR+ and LR− for returns to emergency department at 30 days (LR+ of 1.06; 95% CI 0.83–1.35; LR− of 1.09; 95% CI 0.70–1.70), 90 days (LR+ of 1.11; 95% CI 0.89–1.38; LR− of 0.86; 95% CI 0.61–1.22) and 120 days (LR+ 1.19; 95% CI 1.03–1.38; LR− of 0.70; 95% CI 0.50–0.98) showed that Triage Risk Screening Tool was not sufficiently accurate to be clinically useful. Insufficient predictive ability of this frailty measure was also revealed for functional decline at 30 days (LR+ of 1.37; 95% CI 1.10–1.71; LR− of 0.65; 95% CI 0.54–0.78) and 90 days (LR+ of 1.23; 95% CI 0.87–1.75; LR− of 0.73; 95% CI 0.42–1.27) after admission to the emergency department, as well as for hospital re-admission at 30 days (LR+ of 1.06; 95% CI 0.92–1.24; LR− of 0.90; 95% CI 0.63–1.29), 90 days (LR+ of 1.16; 95% CI 1.06–1.28; LR− of 0.62; 95% CI 0.43–0.85) and 180 days (LR+ of 1.22; 95% CI 1.16–1.29; LR− of 0.56; 95% CI 0.34–0.91) after admission to the emergency department. Lack of sufficient predictive ability of Triage Risk Screening Tool was additionally evidenced in relation to combinations of adverse outcomes, assessed after 30 days interval (LR+ of 1.29; 95% CI 1.03–1.62; LR− of 0.67; 95% CI 0.55–0.81), 90 days (LR+ of 1.02; 95% CI 0.79–1.32; LR− of 0.94; 95% CI 0.62–1.42) or 120 days (LR+ of 1.34; 95% CI 1.17–1.53; LR− of 0.75; 95% CI 0.65–0.87).38
Because of different thresholds for “abnormality”, data from the few studies addressing Triage Risk Screening Tool were not considered in meta-analysis.38 These studies assessed predictive ability for hospital re-admission, functional decline and any adverse outcomes at 30 days after admission to the emergency department. In no case was the Triage Risk Screening Tool revealed to have sufficient accuracy to be clinically useful.
Predictive ability of Identification of Seniors at Risk was assessed for outcomes of return to the emergency department, functional decline, hospital re-admission and different combination of these adverse outcomes.38 Intervals ranging from 30 to 180 days after emergency department presentation were considered. The thresholds for “abnormality” varied from one to three positive responses. Meta-analysis was based on data reported for threshold of ≥2. The pooled estimates of sensitivity and specificity for all outcomes at all follow-up intervals demonstrated statistical significant heterogeneity (I2 often >50%). The pooled estimates of positive and negative LRs showed that Identification of Seniors at Risk was not sufficiently accurate to predict increased risk of return to the emergency department at 30 days (LR+ of 1.06; 95% CI 0.83–1.35; LR− of 1.09; 95% CI 0.70–1.70), 90 days (LR+ of 1.09; 95% CI 0.83–1.43; LR− of 0.79; 95% CI 0.34–1.84) and 180 days (LR+ of 1.38; 95% CI 1.14–1.67; LR− of 0.71; 95% CI 0.66–0.75) after the emergency department episode. Insufficient accuracy to predict risk of adverse outcomes was also evidenced in relation to functional decline and hospital re-admission. Regarding functional decline at 30 days, pooled estimates of positive and negative LRs were 1.19 (95% CI 1.07–1.34) and 0.56 (95% CI 0.43–0.72), respectively. For functional decline at 90 days, the pooled estimate of LR+ was 1.25 (95% CI 1.14–1.38) and that of LR− was 0.53 (95% CI 0.44–0.77).38
Hospital re-admission at 30 days after presentation to the emergency department yielded a pooled estimate of LR+ of 1.08 (95% CI 0.94–1.23) and a pooled estimate of LR− of 0.75 (95% CI 0.37–1.56).38 Data from single studies that focused on the same outcome (hospital re-admission at 30 days), but were not included in meta-analysis, pointed results in the same direction. For hospital re-admission at 90 days, pooled estimates for positive and negative LRs were 1.18 (95% CI 1.05–1.34) and 0.57 (95% CI 0.30–1.10), respectively, and for hospital re-admission at 180 days were 1.22 (95% CI 1.11–1.34) and 0.54 (95% CI 0.39–0.75), respectively. Identification of Seniors at Risk was shown to be insufficiently accurate to predict increased risk of any adverse outcome at 30 days (LR+ 1.26; 95% CI 1.03–1.55; LR− 0.56; 95% CI 0.40–0.77), 90 days (LR+ 1.25; 95% CI 1.11–1.42; LR− 0.60; 95% CI 0.44–0.83) and 180 days (LR+ 1.40; 95% CI 0.88–2.24; LR− 0.66; 95% CI 0.37–1.19) after emergency department presentation. Limited ability of Identification of Seniors at Risk to predict increased risk of adverse outcomes was also revealed in a single study that focused on the outcome of high hospital utilization at six months after admission to emergency department.38
In two studies, modified versions of Identification of Seniors at Risk were considered.38 The outcomes of interest were one-month and 12-month hospital re-admission. Modification of Identification of Seniors at Risk did not improve its predictive ability.
Findings related to predictive ability of frailty screening tools in older patients admitted to emergency department are summarized in Table 10.
Table 10.
Findings related to predictive ability of frailty screening tools in older patients admitted to the emergency department
| Index tests | Predictive ability | ||||
| Reference | Adverse health outcomes | Number of studies/participants | Results/findings | Heterogeneity | |
| Triage Risk Screening Tool (TRST) | Carpenter et al.38 | Emergency department (ED) returns | 5/846 | Accuracy is not sufficient to predict increased risk of ED return at 30, 90 and 120 days after presentation to ED | Methodological (follow-up periods from 30 to 120 days; thresholds of ≥2 and ≥3 were used)Clinical (ED patients, ED patients not receiving sedating medications, discharged ED patients) |
| Carpenter et al.38 | Functional decline | 5/1794 | Accuracy is not sufficient to predict increased risk of functional decline at 30 and 90 days after presentation to ED | Methodological (follow-up periods from 30 to 90 days; thresholds of ≥2 and ≥3 were used)Clinical (ED patients, ED patients not receiving sedating medications, discharged ED patients) | |
| Carpenter et al.38 | Hospital readmission | 5/3323 | Accuracy is not sufficient to predict increased risk of hospital readmission at 30, 90 and 180 days after presentation to ED | Methodological (follow-up periods from 30 to 180 days; thresholds of ≥1, ≥2 and ≥3 were used)Clinical (ED or in-patient wards patients, discharged ED patients, ED patients non-cognitively impaired, non-trauma ED patients) | |
| Carpenter et al.38 | Any adverse outcome | 6/2405 | Accuracy is not sufficient to predict increased risk of any adverse outcome at 30, 90 and 120 days after presentation to ED | Methodological (follow-up periods from 30 to 120 days; thresholds of ≥ 1 and ≥ 2 were used)Clinical (ED or in-patient wards patients, discharged ED patients, ED patients not receiving sedating medications) | |
| Identification of Seniors at Risk (ISAR) | Carpenter et al.38 | ED returns | 9/4848 | Accuracy is not sufficient to predict increased risk of ED return at 30, 90 and 180 days after presentation to ED | Methodological (follow-up periods from 30 to 180 days; thresholds of ≥2 and ≥3 were used)Clinical (ED patients, ED patients referred for GA, discharged ED patients, ED patients not receiving sedating medications, non-trauma ED patients) |
| Carpenter et al.38 | Functional decline | 6/2093 | Accuracy is not sufficient to predict increased risk of functional decline at 30 and 90 days after presentation to ED | Methodological (follow-up periods from 30 to 90 days; thresholds of ≥2 and ≥3 were used)Clinical (ED or in-patient wards patients, ED patients not receiving sedating medications, acute medical unit patients, non-trauma ED patients) | |
| Carpenter et al.38 | Hospital readmission | 6/5408 | Accuracy is not sufficient to predict increased risk of hospital readmission at 30, 90 and 180 days after presentation to ED | Methodological (follow-up periods from 30 to 180 days; thresholds of ≥2 and ≥3 were used)Clinical (discharged ED patients, ED patients without cognitive impairment or a surrogate informant if cognitively impaired) | |
| Carpenter et al.38 | Any adverse outcome | 7/4928 | Accuracy is not sufficient to predict increased risk of any adverse outcome at 30, 90 and 180 days after presentation to ED | Methodological (follow-up periods from 30 to 180 days; thresholds of ≥2 and ≥3 were used)Clinical (ED or in-patient wards patients, ED patients not receiving sedating medications, admitted or discharged ED patients, acute medical unit patients, non-trauma ED patients) | |
| Carpenter et al.38 | High hospital utilization | 1/1620 | Accuracy is not sufficient to predict increased risk of high hospital utilization at six months after presentation to ED | Methodological (thresholds of ≥2, ≥3 and ≥4 were used) | |
| Identification of Seniors at Risk (ISAR) – modified version | Carpenter et al.38 | Hospital readmission | 2/595 | Accuracy is not sufficient to predict increased risk of hospital readmission at one and 12 months after presentation to ED | Statistical (ISAR data used as an unique predictor vs ISAR data used within multiple regression model based on four risk factors, such as presence of home help, increased dependency, professional recommendation, presence of vascular disease)Methodological (follow-up periods of one and 12 months)Clinical (ED patients referred for GA, discharged ED patients) |
| Variables Indicative of Placement Risk (VIP) | Carpenter et al.38 | Hospital readmission | 3/1013 | Accuracy is not sufficient to predict increased risk of hospital readmission at 30 days after presentation to ED | Methodological (thresholds of ≥1, ≥2 and ≥3 were used)Clinical (ED or in-patient wards patients, patients admitted to ED non-cognitively impaired) |
| Carpenter et al.38 | Functional decline | 2/965 | Accuracy is not sufficient to predict increased risk of functional decline at 30 days after presentation to ED | Methodological (thresholds of ≥1 and ≥2 were used)Clinical (ED or in-patient wards patients, patients admitted to ED non-cognitively impaired) | |
| Silver Code | Carpenter et al.38 | ED returns | 1/1538 | Accuracy is not sufficient to predict increased risk of ED returns at six months after presentation to ED | Methodological (either threshold ≥4 or ≥11 were used) |
| Carpenter et al.38 | Hospital readmission | 1/1538 | Accuracy is not sufficient to predict increased risk of hospital readmission at six months after presentation to ED | Methodological (either threshold ≥4 or ≥11 were used) | |
| Carpenter et al.38 | Mortality | 2/12,451 | Accuracy is not sufficient to predict increased risk of mortality at six and 12 months after presentation to ED | Methodological (follow-up periods from six to 12 months, either threshold ≥4 or ≥11 were used) | |
| Carpenter et al.38 | ED return or hospital readmission or mortality | 1/1538 | Accuracy is not sufficient to predict increased risk of any of indicated outcomes at six months after presentation to ED | Methodological (either threshold ≥4 or ≥11 were used) | |
| Mortality Risk Index | Carpenter et al.38 | Mortality | 1/1263 | Accuracy is not sufficient to predict increased risk of mortality at two years after presentation to ED | Methodological (thresholds of ≥3 and ≥5, were used) |
| Rowland | Carpenter et al.38 | ED returns | 1/381 | Accuracy is not sufficient to predict increased risk of ED returns at six months after presentation to ED | N/A |
| Carpenter et al.38 | Hospital readmission | 1/381 | Accuracy is not sufficient to predict increased risk of hospital readmission at six months after presentation to ED | N/A | |
| Carpenter et al.38 | Mortality | 1/381 | Accuracy is not sufficient to predict increased risk of mortality at six months after presentation to ED | N/A | |
| Carpenter et al.38 | ED return or hospital readmission or mortality | 1/381 | Accuracy is not sufficient to predict increased risk of any of indicated outcomes at six months after presentation to ED | N/A | |
| Runciman | Carpenter et al.38 | ED returns | 1/381 | Accuracy is not sufficient to predict increased risk of ED returns at six months after presentation to ED | N/A |
| Carpenter et al.38 | Hospital readmission | 1/381 | Accuracy is not sufficient to predict increased risk of hospital readmission at six months after presentation to ED | N/A | |
| Carpenter et al.38 | Mortality | 1/381 | Accuracy is not sufficient to predict increased risk of mortality at six months after presentation to ED | N/A | |
| Carpenter et al.38 | ED return or hospital readmission or mortality | 1/381 | Accuracy is not sufficient to predict increased risk of any of indicated outcomes at six months after presentation to ED | N/A | |
| Winograd Index of Frailty | Carpenter et al.38 | Institutionalization | 1/1306 | Accuracy is not sufficient to predict increased risk of institutionalization at 12 months after presentation to ED | Clinical (ED or in-patient wards patients) |
| Carpenter et al.38 | Mortality | 1/1306 | Accuracy is not sufficient to predict increased risk of mortality at 12 months after presentation to ED | Clinical (ED or in-patient wards patients) | |
| Donini Index of Frailty | Carpenter et al.38 | Institutionalization | 1/1306 | Accuracy is not sufficient to predict increased risk of institutionalization at 12 months after presentation to ED | Clinical (ED or in-patient wards patients) |
| Carpenter et al.38 | Mortality | 1/1306 | Accuracy is not sufficient to predict increased risk of mortality at 12 months after presentation to ED | Clinical (ED or in-patient wards patients) | |
| Schoevaerdts Index of Frailty | Carpenter et al.38 | Institutionalization | 1/1306 | Accuracy is not sufficient to predict increased risk of institutionalization at 12 months after presentation to ED | Clinical (ED or in-patient wards patients) |
| Carpenter et al.38 | Mortality | 1/1306 | Accuracy is not sufficient to predict increased risk of mortality at 12 months after presentation to ED | Clinical (ED or in-patient wards patients) | |
| CSHA Clinical Frailty Scale | Carpenter et al.38 | Hospital readmission | 1/645 | Accuracy is not sufficient to predict increased risk of hospital readmission at 30 and 90 days after presentation to ED | N/A |
| Self-rated health | Carpenter et al.38 | Return ED visits | 1/177 | Accuracy is not sufficient to predict increased risk of return ED visits at 30 and 90 days after presentation to ED | N/A |
CSHA: Canadian Study on Health and Ageing; ED: emergency department; GA: geriatric assessment. Acute medical unit patients: all acute medical unit patients with anticipated discharge in <72 h; N/A: not applicable; Non-trauma ED patients: non-trauma ED patients without cognitive impairment or a surrogate informant if cognitively impaired.
Predictive ability of frailty indicators
The predictive ability of frailty indicators was examined in a single review.39 This review focused on gait speed, unintended weight loss, low muscle strength or hand grip strength, low physical activity, low balance, low lower extremity function, exhaustion, poor performance on chair stands, 360° turn, bending over, foot taps and hand signature, investigating their association with future disability in activities of daily living. All frailty indicators, with exception of muscle strength or hand grip strength and exhaustion, were revealed to be significant predictors of disability in activities of daily living. The risk of this adverse outcome was studied in different follow-up intervals, varying from one to 8.4 years for gait speed, from three to 10 years for physical activity, from four to 14 years for weight loss, from one to six years for balance, from three to nine years for lower extremity function and from one to three years for chair stands. Predictive ability of 360° turn, bending over, foot taps and hand signature was analyzed at 12 months after evaluation.39
Regarding muscle strength or hand grip strength, the reported findings were inconsistent.39 Three studies with follow-up periods of three, four and eight years concluded that grip strength was not a significant predictor of disability in activities of daily living. In seven studies with follow-up periods from three to nine years, grip strength was found to be associated with higher risk of developing disability in activities of daily living. Exhaustion was analyzed in a single study, with follow-up of eight years, which was the only frailty indicator that was shown not to be a significant predictor of disability in activities on daily living.39
Findings related to predictive ability of frailty indicators are summarized in Table 11.
Summary of evidence
The summary of evidence for outcomes of reliability, validity and diagnostic accuracy, based on findings described in Tables 5–7, is presented in Table 12. The evidence regarding the Frailty Index should be considered with caution as it was collected from different existing versions of this measure. Table 13 provides the summary of evidence for predictive ability outcome.
Table 12.
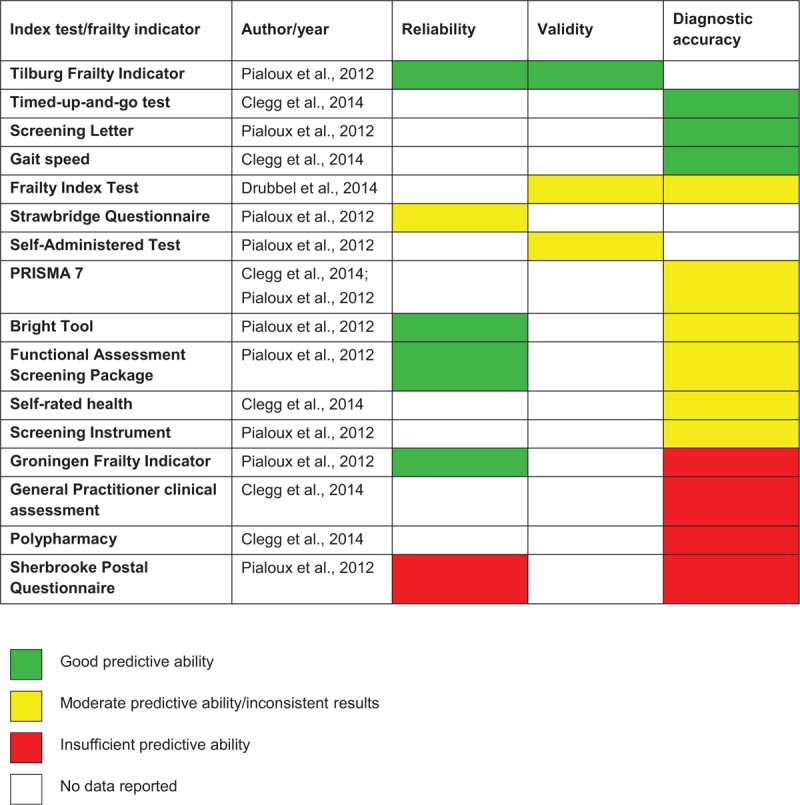
Summary of evidence for outcomes of reliability, validity and diagnostic accuracy
Table 13.
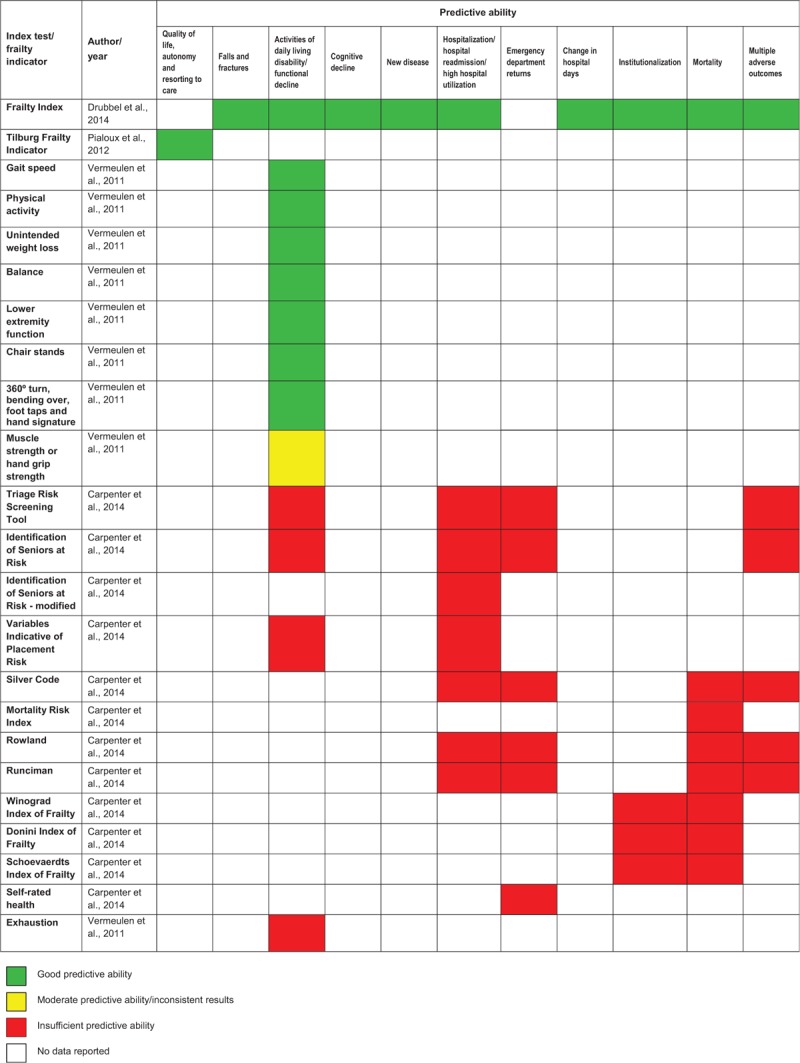
Summary of evidence for predictive ability outcome
Discussion
The current umbrella review on screening for frailty has examined reviews covering 26 different index tests for frailty plus eight individual indicators. The reviews together considered 11 different adverse health outcomes ranging from falls, functional decline or disability on activities of daily living to hospitalization, institutionalization and death. Screening tools were assessed for their reliability and validity, and compared against established reference tests, including the full clinical assessment, the CGA, the CHS phenotype model (also known as Fried's phenotype) and the CSHA cumulative deficit model (also known as Rockwoods’ frailty profile). Screening tools were also examined for their predictive ability. The overall aim of examining the utility of screening tools for detecting or predicting risk of frailty and its associated negative outcomes was deemed necessary given that, despite the widely accepted concept of frailty as an age-related state of high vulnerability to adverse outcomes in the event of a stressor such as trauma or new disease, different operational definitions had been proposed. After consideration of quantitative systematic reviews, pooled analyses and meta-analyses, five systematic reviews met inclusion criteria including age range (60 years and over) and methodological quality criteria. Poorer quality reviews that did not meet our mandatory requirements for inclusion were excluded at this stage, but it is important to note that none of the included reviews considered or analyzed for the possibility of publication bias.
Quality of included primary studies: key issues
The authors of included reviews varied in terms of their overall appraisals of the quality of their included primary studies. They recognized weaknesses in the primary studies such as risks of attrition bias and bias as a result of lack of blinding of assessors in relation to index test results. Incorporation bias was also a potential problem in terms of the relationships to the reference tests used, given that there was some commonality and overlap between the measures, for example, efficacy of gait speed as appraised against a frailty phenotype that included gait speed.35 Nevertheless, the utility of using the simple index as opposed to the fuller assessment is important and shown to be very useful, with high sensitivity and moderate specificity at a gait speed of less than 0.7 m/s. However, the design of studies to control for these risks is an important consideration in any further development or evaluation of frailty screening.
Attrition was also identified as a concern and threat to validity of studies. It is well known that attrition in such studies is unlikely to be random, with people with the poorer prognoses being those more likely to decline or be unavailable for further assessments.40 Statistical methods are available to account for this, developed in longitudinal studies. A related issue is the range of the level of frailty among those screened in the different studies for comparisons to be valid. This is similar to the issue of setting a specific time point in the course of a disease process in general prognosis research (e.g. refer to D’Amico et al.41). For example, the prognostic validity of a tool may be different depending on the severity of the frailty of the patient, and further research may clarify whether some tools are more suitable for high levels of frailty as opposed to, for instance, conditions of pre-frailty. In the study that examined frailty tools in an emergency department,38 sensitivity and specificity were poor, but the study also found reliably that specificity was higher and sensitivity lower for higher levels of frailty and vice versa for lower levels of frailty. A further illustration of this issue was evident in a comparison between the diagnostic accuracy of some index tests in different contexts: PRISMA-7 was appraised as being more accurate (sensitivity and specificity) in a general community sample35 than in a primary care sample37 (although the reference standard was also different). One particular review in this umbrella review35 specifically examined the differences in validity for different levels of an indicator variable, gait speed, showing that a cutoff of <0.7 m/s had higher sensitivity and specificity values (fewest false negatives and false positives for frailty, according to the reference standard) than values of <0.8 or 0.9 m/s, and also that people with a gait speed above 0.7 m/s were unlikely to be classified as frail (NPV of 0.98). This careful comparative analysis or control of levels of frailty in analysis demonstrates the usefulness of setting a level or investigation of different levels of frailty examined. Some authors suggested that the effectiveness of interventions may vary at different levels of frailty (e.g. responsiveness being dependent on the underlying basis of mobility or disease components of frailty36), a question that research on interventions for frailty needs to address.
The studies were too heterogeneous in the data presented to enable meta-analysis, an issue that points to the development needed in reporting of diagnostic accuracy and predictive ability of measures. This necessitated a narrative approach both in this umbrella review as well as in some of the reviews examined. Nevertheless, it was still possible to draw conclusions from the comparisons conducted. Authors also often provided little information on contents of the analyzed instruments. To examine commonalities between measures that work well in different contexts, understanding of the components of tools is necessary.
Five reviews were excluded because of the quality standards set for inclusion (Appendix II). Three of these (conducted by de Vries et al.,42 Pijpers et al.43 and van Kan et al.44) did not apply any critical appraisal to the included studies, which reduced confidence in the conclusions. de Vries et al.,42 one of the excluded reviews, evaluated frailty screening tools against a set of evidence based frailty factors, across physical, psychological and social domains, and concluded that only the Frailty Index (accumulation model) included all eight factors, although four others included at least one factor within each domain. The authors furthermore indicated that the Frailty Index was useful in that it captured the dynamic nature of frailty and so suggested that it might be more suitable to assess intervention outcomes than screening measures that gave a dichotomous result of frail or not frail. The finding of the usefulness of the Frailty Index concured with conclusions from our review of the included reviews. This excluded review did include studies that examined screening tools not considered in the included reviews. However, further information on validity was restricted to construct validity and, to a very limited extent, reliability. The second excluded review was that by van Kan et al.44 who specifically focused on the use of gait speed as a predictor. In agreement with the included reviews, low gait speed was reported as a useful indicator of disability in activities of daily living, decline or dependence and also as a predictor of cognitive decline. A third review, developed by Pijpers et al.,43 was also excluded because their inclusion criteria were not appropriate as that they did not restrict their age range. Pijpers et al.43 examined predictive validity of the tools for mortality or functional decline. The authors concluded that the risk of false-positives was generally too high for the tools to be adopted. The lack of restriction of age range was also identified in the review by Hamaker et al.45 that aimed to assess the sensitivity and specificity of frailty screening methods for predicting the presence of impairments on the CGA in elderly patients with cancer. According to these authors, frailty screening methods had insufficient discriminative power and thus it might be beneficial for the cancer patients to receive a complete geriatric assessment. The fifth review by Feng et al.,46 which was excluded because of the use of inappropriate criteria for the study appraisal examined the utility of CGA components as predictors of adverse outcomes among geriatric patients undergoing major oncologic surgery. The authors found that the CGA components were associated with postoperative complications and discharge to non-home institutions, and concluded that the focused geriatric assessment should be included as part of the routine in preoperative care in the geriatric surgical oncology population. Given the similarities between outcomes and lack of contradiction where similar measures were examined, our decisions on exclusion did not seem to result in salient differences in conclusions that may have been drawn if these exclusions had not been made, but these exclusions increased the likely reliability of the conclusions of this umbrella review. The only review focusing on instruments other than those considered in this umbrella review was by Feng et al.46 However, this review assessed papers on a very specific population (cancer patients before major surgery), and thus the conclusions drawn by the authors were generalizable to the very restricted number of frail patients.
Reliability of reviewed frailty measures
Regarding reliability, defined in terms of internal consistency and test-retest or inter-rater reliability, of the measures assessed, the Tilburg and the Groningen Frailty Indicators, the Bright tool and the Functional assessment screening package were all evidenced as being reliable, whereas other measures such as the Strawbridge and Sherbrooke questionnaires were shown not to be reliable in the studies reviewed. A notable feature of all of these measures is that they all included items regarding mood, social networks or loneliness, and cognition as well as physical issues such as weight loss, mobility, polypharmacy or eyesight and hearing. That is because many researchers believe a frailty tool based only on physical measures is insufficient and assert that assessment of frailty should also include cognitive, mental health domains and possibly also social domains such as living alone.11,47 However, only the Functional Assessment Screening Package actually included objectively assessed measures, such as a Timed-up-and-go test or a recall test, with the rest being self-assessed, carer-assessed or nurse-assessed via questions. These findings together illustrate that self-assessed and question-based screening without objective measures can be reliable, but objectively assessed parameters can add to this reliability.
Validity of reviewed frailty measures
Validity of some of the tests was also reviewed, with relationships with reference standards reported. Strong positive relationships were reported for the Frailty Index (with a variety of constituent numbers of deficits), which also correlated significantly with the frailty measures used as reference tests; however, these correlations varied from weak to strong. In addition, further supporting construct validity, it was reported that the frailty index score increased steadily with age, being tendentiously higher in women than in men.
Diagnostic accuracy of reviewed frailty measures and consideration of converging evidence
Diagnostic accuracy was examined by three of the reviews, with gait speed particularly below 0.8 or 0.7 m/s, Timed-up-and-go, Screening Letter, PRISMA 7, Bright tool and self-rated health, showing excellent-to-moderate sensitivity and specificity values, with the Functional Assessment Screening Package and the Screening Instrument showing a wide range from poor to excellent for different areas of frailty, with no further details given. Specificity of the Frailty Index was generally high, although sensitivity was low, suggesting that use of it would produce higher numbers of false-negative results, that is, not identifying people who might actually be frail and thereby missing potentially critical opportunities for treating or supporting these people. It is suggested that although these measures are generally well regarded, further research is necessary to determine the critical components of such accumulation methods that reduce the possibility of such errors. In studies reviewed, the highest sensitivity value was reported for a walking speed of < 0.9 m/s. However, given that this was compared against a reference standard that also included the same measure, it may not be considered as an independent assessment of the diagnostic accuracy of walking speed. Nevertheless, the role of walking speed as a component in frailty assessments is supported by converging evidence in the background literature. For example, walking speed is reported to be related to disability six years post-measurement in people with no reported disabilities initially (e.g. Guralnik et al.48) and is also directly associated with cognitive decline such as global cognitive function, memory, and executive function49,50 and mortality up to five years later.51 In addition, neuroimaging studies have linked changes in gait such as walking speed with measures of information processing speed in terms of specific gray matter changes in the pre-frontal cortex, dissociating from other cognitive changes such as visuospatial attention or memory.52 Information processing speed, particularly, changes in older age, and has been linked reliably with survival in a general population in longitudinal studies.53
The role of converging evidence is also important for other indices in this review. In this umbrella review, self-rated health was found to be a useful measure on its own,35 and it related well to cumulative frailty indices.36 Likewise, the importance of self-rated health as a valid concept in terms of predicting need for care, morbidity and mortality also has further supporting evidence in the background literature, with evidence linking it reliably to objective health, and prospectively to healthcare utilization, morbidity and mortality.54 Recent analyses55 have combined 65 measures of cognition, lifestyle and health, and demonstrated that female gender, better subjective health and smaller decrements with age in processing speed over the 29 years of this longitudinal study were all associated with reductions in mortality risk.
Predictive ability of reviewed frailty measures
Given that a condition of frailty is essentially defined as a poor prognosis, given further stressors, the predictive ability of the screening tests is a vital part of this review. The three reviews that examined predictive ability included one that examined screening tools for use in emergency departments only. These tools were a series of 12 assessments that did not overlap with the screening tools used to identify frailty in primary care or the community featured in the other studies, with the exception of self-rated health. Nevertheless, one of the screening methods used as a reference standard in the other reviews was included here as a screening test in terms of its predictive ability, the CSHA accumulation frailty scale. In terms of predicting long-term adverse events based on emergency department assessment, none of the measures showed sufficient predictive ability for outcomes such as re-admission, nursing home placement or mortality. As the authors described, one-third of older adults discharged from emergency department experienced subsequent adverse outcomes and having a way of predicting this, stratifying risk, across a range of reasons for admittance would be extremely useful to clinicians and case management design. However, distinguishing frailty from acute illness in such an environment is clearly a central issue and is one that requires the ability to distinguish between ill older patients with good physiological reserve, and those with poor reserve, that is the frail. It was clear from this study that there might not yet be a valid tool with acceptable predictive accuracy for this purpose at least among the wide range considered in the review.
The frailty index (with a variety of versions) was shown to be accurate to predict a variety of outcomes, including falls, disability in activities of daily living, cognitive decline, hospitalization and mortality and also health service usage, such as emergency department visits. The Tilburg Frailty Index showed satisfactory predictive ability for quality of life, autonomy and resorting to care only. Although it was described as being predictive for geriatric events at one year, there were no details reported on this analysis.
Individual risk factors such as walking speed and Timed-up-and-go were also examined in terms of their predictive ability. Higher risk of developing disability in activities of daily living was predicted well by most of these risk factors, with grip strength showing that three out of 10 studies contradicted this and that self-perceived exhaustion was a poor predictor. Thus, although it is difficult to make conclusions on its specificity and sensitivity against an overlapping reference test, gait speed did seem to be assessed as a reliable predictor of adverse outcomes, specifically disability in activities of daily living.
Limitations
The current review has a number of limitations. First, we only searched keywords in the abstract field to ensure that only systematic reviews would be included. Since we did not search in the title field and since it was possible that some reviews were published without an abstract, this decision could increase the risk of bias of this umbrella review. Furthermore, we only searched the index terms in the exact major subject heading (MM) field. This decision could also contribute to the risk of bias as it seemed plausible that some of the index terms were identifiable only in the exact subject heading (MH) field.
Second, included studies were too heterogeneous to allow for meta-analyses to compare results. A key outcome from this review is to call for researchers to work together toward creating a consensus on screening tools for frailty and/or pre-frailty. Each of the five reviews took a different approach to assess the reliability and/or validity of tools, which meant that it was impossible to build a global picture of which tools should be recommended for future research. Potentially, researchers should be encouraged to include multiple tools in future studies to allow for systematic synthesis of measures across contexts and populations. The salient point from this review is that there are too many tools being developed and used without establishing that they are an improvement on already existing tools or that they are more relevant for specific contexts, purposes or levels of severity. This also applies to frailty indicators that are not only measured differently in different studies, but also considered based on different scoring systems, including those defined in terms of the lowest quartile or the lowest quintile of the observed sample performance. This approach is likely to hinder researchers working in this field, as tools with limited reliability and validity may be supporting the success of interventions aimed at reducing frailty and pre-frailty, thus potentially suggesting that more reliable and valid measures would have no effect.
It is also important to highlight that the findings from primary studies provided by the included reviews were frequently insufficiently detailed. For example, some of the review authors35-37 conferred significance to the obtained results (such as correlation coefficients or values of sensitivity and specificity) without clarifying the statistical basis used for this purpose, which raises the problem of the interpretation of the reported data. Other review authors39 provided different indices of effect sizes for adverse health outcomes, without referring to the magnitude of exposure to these outcomes, which made the conversion of data to a uniform statistic and their further comparison impossible. It is possible that these details were also missing in the primary studies; however, since the extraction of data performed within this umbrella review only covered the information reported by the included reviews, this issue cannot be clarified. The lack of detailed information limited the analysis that could be conducted, constituting another weakness of this umbrella review.
Another limitation of the current review is that few of the included reviews considered unpublished research, and none of the reviews analyzed the possibility of publication bias. Two common methods for assessing publication bias are searching the gray literature and generating funnel plots. The lack of the latter is unsurprising as none of the included papers were able to synthesize results, meaning that it would be unlikely that review authors would be able to generate funnel plots. The former method was undertaken by only one review38 and only in terms of inclusion of published conference abstracts, although no assessment of publication bias was made. It is worth being very clear on this issue; publication bias is a serious flaw in a systematic review/meta-analysis, and reviewers in all areas should be encouraged to take this issue seriously. Failure to do so will lead to wasted time and resources as researchers try (and fail) to replicate results that are statistical anomalies. The recent debate in the journal Science56-58 has shown that psychological research is susceptible to publication bias, with an international team of researchers failing to replicate a series of experiments across cognitive and social psychology. Although there is no certainty that there will be publication bias in any field or area, researchers, when conducting reviews, should endeavor to do all they can to avoid this bias.
One issue to raise concerning diagnostic accuracy (and validity) is the lack of a gold standard. This is not only an issue in the frailty setting, it is an important issue in many other fields, often solved, for analytical purposes, by using some well accepted tools as reference standards as done here. However, this is a concern in this field since diagnostic accuracy measures and validity strongly depend on which frailty paradigm is used as reference, and this is something to take into account in the interpretation. It has been proposed that the Frailty Phenotype (physical frailty construct) and the Frailty Index based on CGA (accumulation of deficits construct) are not in fact alternatives, but they are designed for different purposes and so complementary.59
Conclusion
In conclusion, only a few frailty measures seem to be demonstrably valid, reliable, diagnostically accurate and have good predictive ability in the reviews considered in this umbrella review. The first is the Frailty Index, an accumulation model that can potentially be calculated electronically from records plus a small number of questions or measures. It was revealed to have good predictive ability and mostly acceptable validity and diagnostic accuracy. These results have been obtained with frailty indices with a variety of numbers of items, thus further research is needed to determine the smallest number possible without losing accuracy to assist healthcare practitioners to use it in a variety of settings. Given that a minimum of 30 deficits has been suggested as the limit at which different types of deficits can be used without major influence on the properties of the Frailty Index,60 it is notable that one of the primary studies had only 13 items. Further research would be helpful to determine the ideal combination of constituent deficits for specific contexts, especially given that validity did vary between versions.
Some other screening tools, the Tilburg Frailty Indicator, PRISMA-7, the Screening Letter, the Bright Tool and the Functional Assessment Screening Package also showed good characteristics, although analysis of predictive ability was only available for the Tilburg and then only for a very restricted set of three variables in the reviews examined. In comparison, the Groningen Frailty Indicator, general practitioner clinical assessment, index of polypharmacy and Sherbrooke Postal Questionnaire were revealed to have unacceptable diagnostic accuracy, thus their use for identifying frailty in primary care or community settings is not recommended.
Perhaps the most salient positive finding is the clear usefulness of simple risk indicators, with slow gait speed showing as having excellent predictive abilities. It is also noteworthy that some outcomes were predicted better by screening measures than others. A lot of the earlier studies on screening for frailty focused on frailty as a predictor of mortality, which this review shows to be well predicted by the frailty index. However, perhaps more useful in terms of providing care where it is needed is that almost all the individual indicators predicted disability in activities of daily living.
Finally, this study shows clearly that screening for frailty in terms of predicting adverse outcomes is not reliable in terms of use in emergency departments, at least in terms of the measures used here. It is worth noting that even a CFS reference test did not perform well in this context and the need for better ways to assess lack of physiological and psychological reserve in people who are also acutely ill or injured in an emergency department are needed. However, given the evidence that some of the outcomes measured may be dependent on the organizational context, there is perhaps a need for contextual factors to be taken into account in such predictive attempts. For example, outcomes can be affected by poor accessibility to general practitioners, leading to patients’ return to the emergency department. It is also important to highlight that none of the included systematic reviews provided responses that met all of our research questions on their own. Further research should fill this gap, covering all the issues related with reliability, validity, diagnostic accuracy and predictive ability of the examined instrument(s) within the same study.
Implication for practice
Early diagnosis of frailty can help improve care for older adults, helping to minimize the risk of pre-frail states developing into frail states, and the implementation of therapeutic measures to attenuate or delay the impact or worsening of underlying conditions and symptoms or to ameliorate the impact on independence or healthy and engaged lifestyles. Other possible implications are related to better allocation of healthcare costs. For example, early diagnosis of frailty can allow for better planning of care capacity, including material resources and competences. It also allows for earlier involvement and cooperation of the most suitable professionals in a specific situation, avoiding the escalation of costs generally involved in acute episodes of disease in already frail old people.
The current review has highlighted that there is no universally appropriate specific screening tool to identify frailty that could be advised for health professionals, identifying the need for choice of frailty screening tools based on context and purpose for which it is needed in any one circumstance. The important role of basic measures such as self-rated health and gait speed to be included in frailty tools is underlined, but it is also clear that those indicators that seemed to fare best in the analyses combined physical, psychological and situational factors.
Importantly, use of current frailty tools to predict adverse outcomes in situations where a patient is also acutely ill such as in people admitted to emergency departments or where there are other factors affecting the outcomes measured, such as availability of alternate forms of care where emergency department re-admission is the outcome, is not advised.
Implications for research
Despite the large and growing body of evidence about frailty, there is no consensus on frailty definition, and different frailty paradigms are used as reference in the research. This diversity can also be observed in relation to frailty measures used for screening and diagnostic purposes, as they cover different domains of individual functioning and provide complementary information about the status of health of the older patient. To optimize frailty assessment and then treatment choice and care planning, a consensual definition of frailty, validated for different economic and clinical contexts, is required.
The current review has indicated a need for further research on the best predictive sets of variables for different intended outcomes. Some of the uncertainty and variability between studies reviewed may be related to variance in the levels of frailty of the participant populations, and so control for level is recommended. Moreover, future research is required to strengthen the current evidence about psychometric properties of available frailty measures, with a consensual approach to assessing the reliability and/or validity of screening tools, useful for building a global picture of recommended measures. In this future research, the generalizability of available frailty measures to healthcare settings other than primary care should be addressed.
There is also a clear need for research on ways to assess frailty and potential resilience in acutely ill people.
In addition, it will be important to examine performance of frailty tools in the context of community-based prevention programs. The responsiveness of frailty tools to assess the impact of interventions is also needed as the field explores further ways of addressing frailty in our aging populations. The research in this field should take into account the specificity of primary, secondary and tertiary prevention, identifying frailty measures that are most appropriate in each of these contexts.
Finally, future systematic reviews should be more rigorous on the methodology to improve the quality of obtained evidence. In general terms, findings from primary studies could be better reported in future research on frailty screening tools. To facilitate the interpretation of the reported data, future reviews should clearly indicate the statistical basis used for conferring significance to the obtained results, while the inclusion in the review report of details that allow the conversion of data to a uniform statistic will improve the comparison across different systematic reviews. There is also a need for assessment of publication bias.
Acknowledgements
The current review is part of the FOCUS project (Frailty management Optimisation through EIPAHA Commitments and Utilisation of Stakeholders input) which is a three-year project co-financed by the Consumers, Health, Agriculture and Food Executive Agency (CHAFEA), under the power delegated by the European Commission (Grant Agreement 664367 – FOCUS).
We acknowledge the contribution of other members of the Focus project: Alessandro Nobili and Barbara D’Avanzo (IRCCS Istituto Di RicercheFarmacologiche “Mario Negri”), Ana Gonzalez Segura and Enrique de la Cruz Martínez (EVERIS Spain S.L.U), Ana M. Martinez-Arroyo, Vicente Gil and Vicente Llorens, (ESAM Tecnología S.L.), Donata Kurpas and Maria Bujnowskad (Wroclaw Medical University), James Brown and Rachel Shaw, (Aston Research Centre for Healthy Ageing, Aston University), and Lex van Velsen (Roessingh Research and Development) who were co-responsible for elaboration of PICO questions and structuring of PICO components of this umbrella review protocol.
The following are also thanked: Eduardo Santos for his contribution to the protocol development, and Filipa Couto and Cátia Grenha for their collaboration under supervision in the organization of the analyzed materials.
Appendix I: Search strategy
Searched – October 13, 2015
MEDLINE
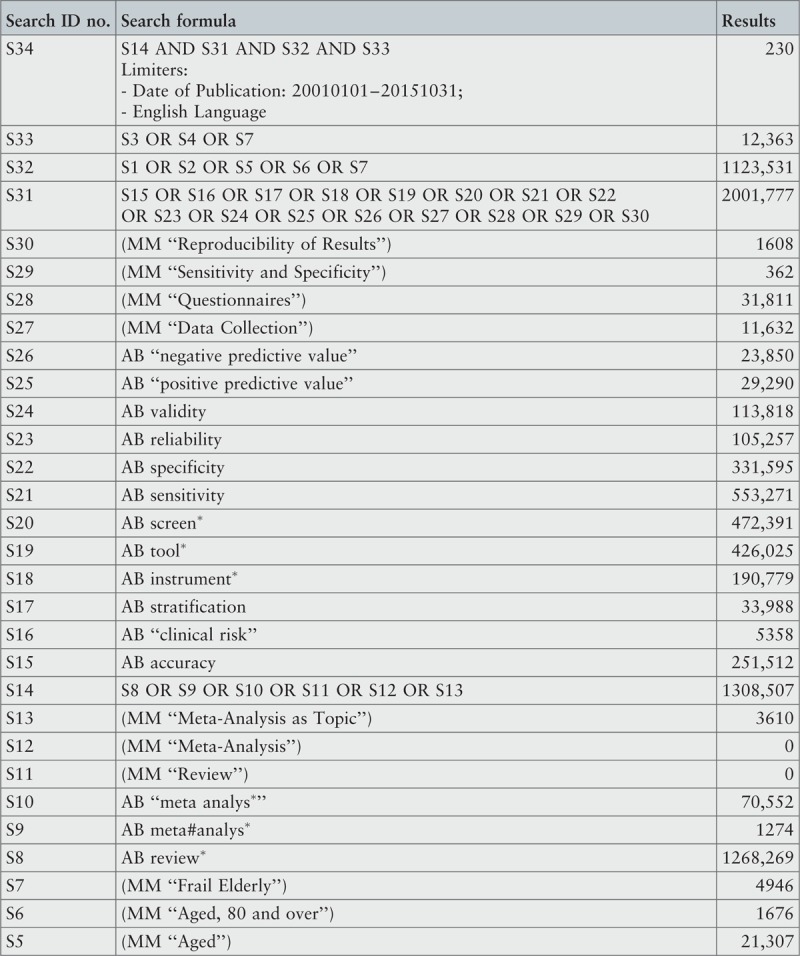
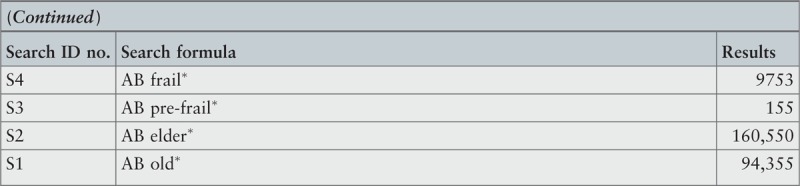
CINAHL
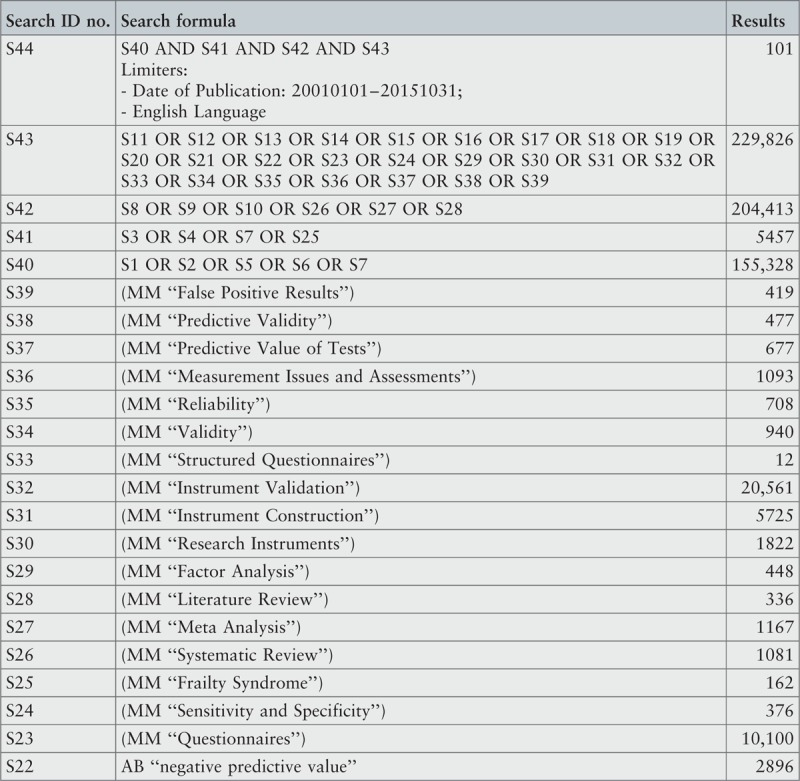
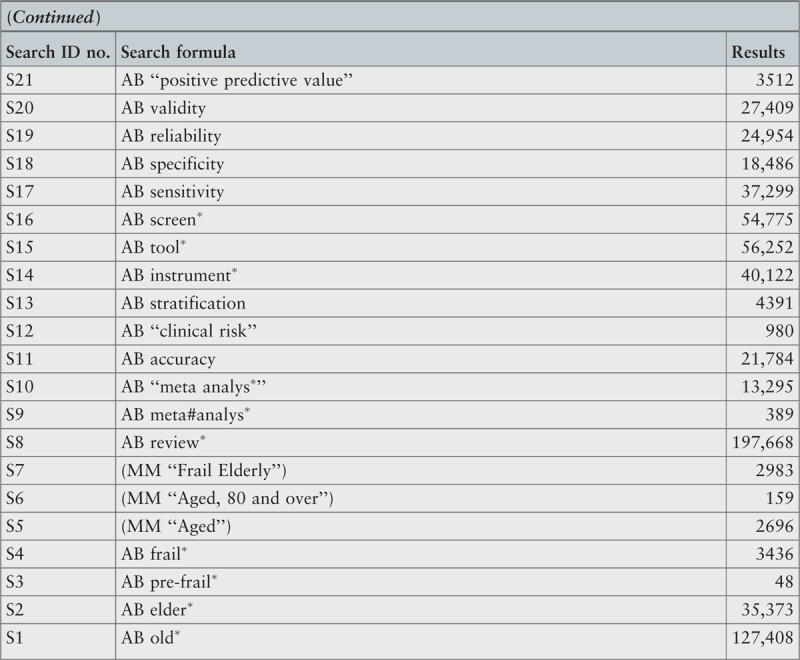
MedicLatina
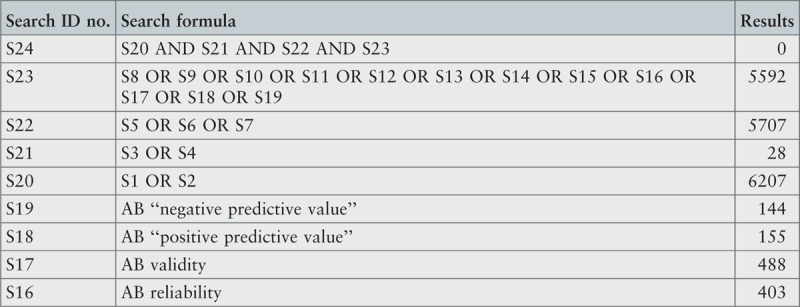
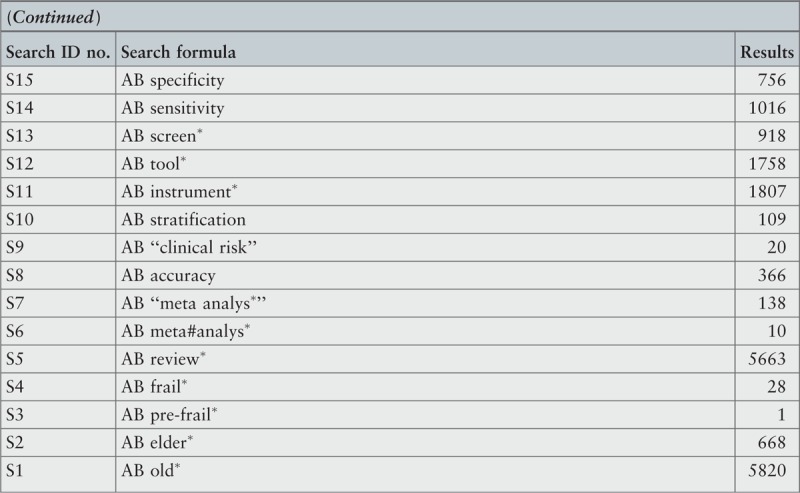
Cochrane Database of Systematic Reviews
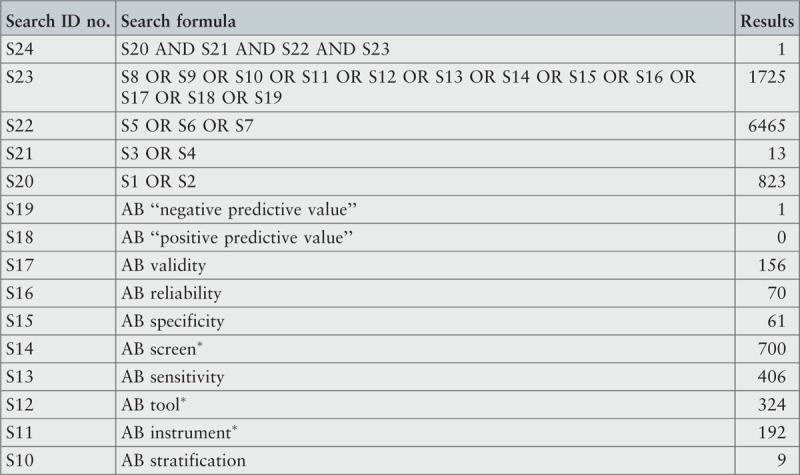
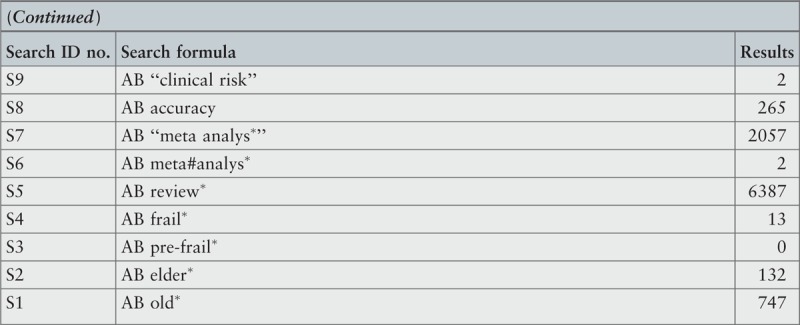
Database of Reviews of Effects
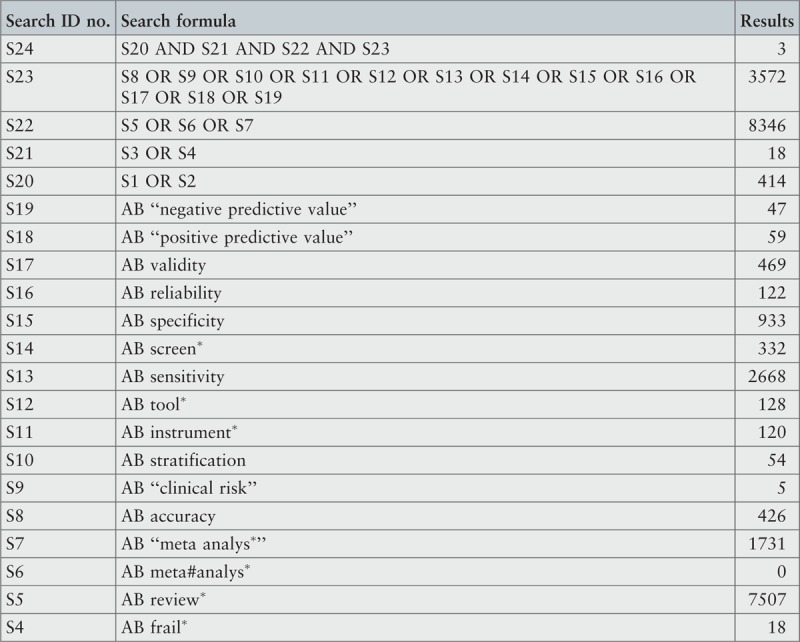
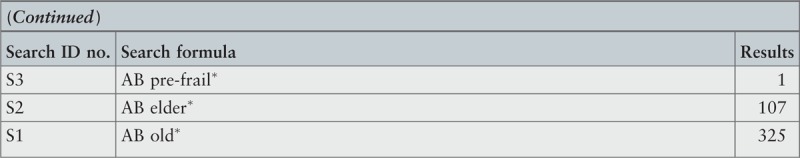
Scielo
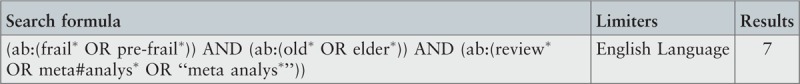
PROSPERO register

JBI Database of Systematic Reviews and Implementation Reports

“Grey Literature Report” from New York Academy of Medicine

ProQuest – Nursing and Allied Health Source Dissertations

Appendix II: List of excluded reviews based on assessment of methodological quality
de Vries NM, Staal JB, van Ravensberg CD, Hobbelen JS, Olde Rikkert MG, Nijhuis-van der Sanden MW. Outcome instruments to measure frailty: A systematic review. Ageing Res Rev.2011; 10(1): 104-114.
Reason for exclusion: The authors did not perform a critical appraisal of the included studies.
Feng MA, McMillan DT, Crowell K, Muss H, Nielsen ME, Smith AB. Geriatric assessment in surgical oncology: A systematic review. J Surg Res.2015; 193(1): 265-272.
Reason for exclusion: The criteria for appraising studies were inappropriate.
Hamaker ME, Jonker JM, de Rooij SE, Vos AG, Smorenburg CH, van Munster BC. Frailty screening methods for predicting outcome of a comprehensive geriatric assessment in elderly patients with cancer: a systematic review. Lancet Oncol.2012; 13(10): E437-E444.
Reason for exclusion: The inclusion criteria were not appropriate for the review question.
Pijpers E, Ferreira I, Stehouwer CD, Nieuwenhuijzen Kruseman AC. “The frailty dilemma. Review of the predictive accuracy of major frailty scores.” Eur J Intern Med.2012; 23(2): 118-123.
Reason for exclusion: The inclusion criteria were not appropriate for the review question. In addition, the authors did not perform a critical appraisal of the included studies.
van Kan GA, Rolland Y, Andrieu S, Bauer J, Beauchet O, Bonnefoy M, et al. Gait speed at usual pace as a predictor of adverse outcomes in community-dwelling older people an international academy on nutrition and aging (IANA) task force. J Nutr Health Aging.2009; 13(10): 881-889.
Reason for exclusion: The authors did not perform a critical appraisal of the included studies.
Appendix III: Summary of characteristics of included reviews
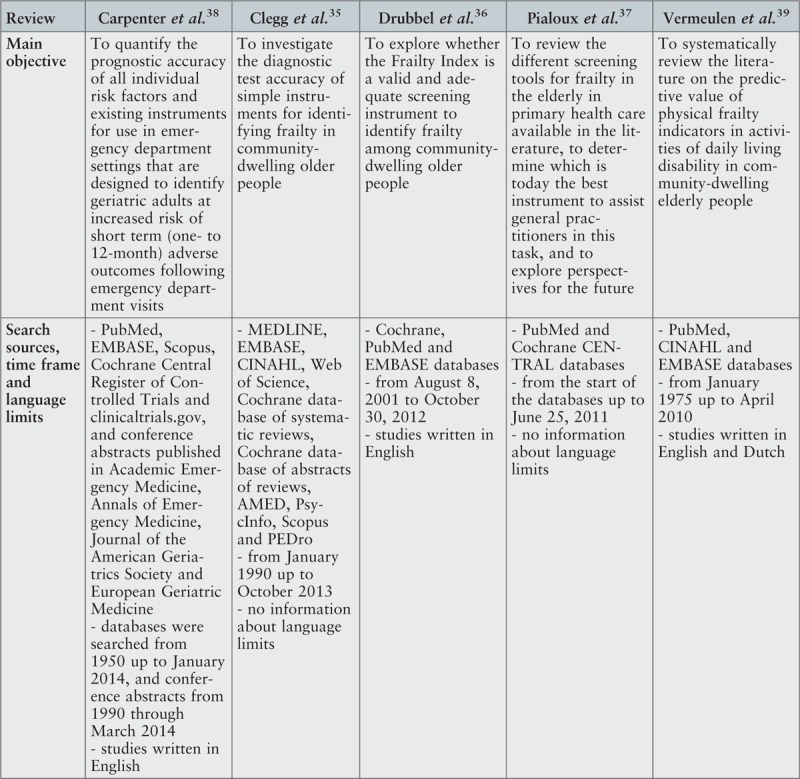
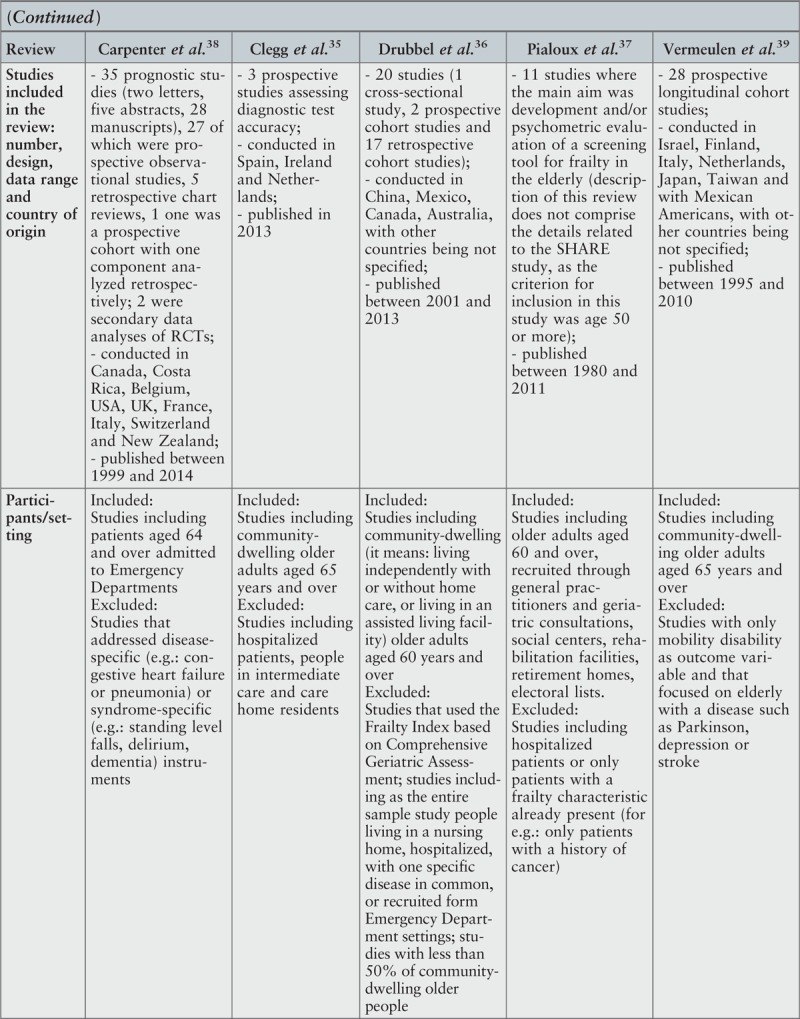
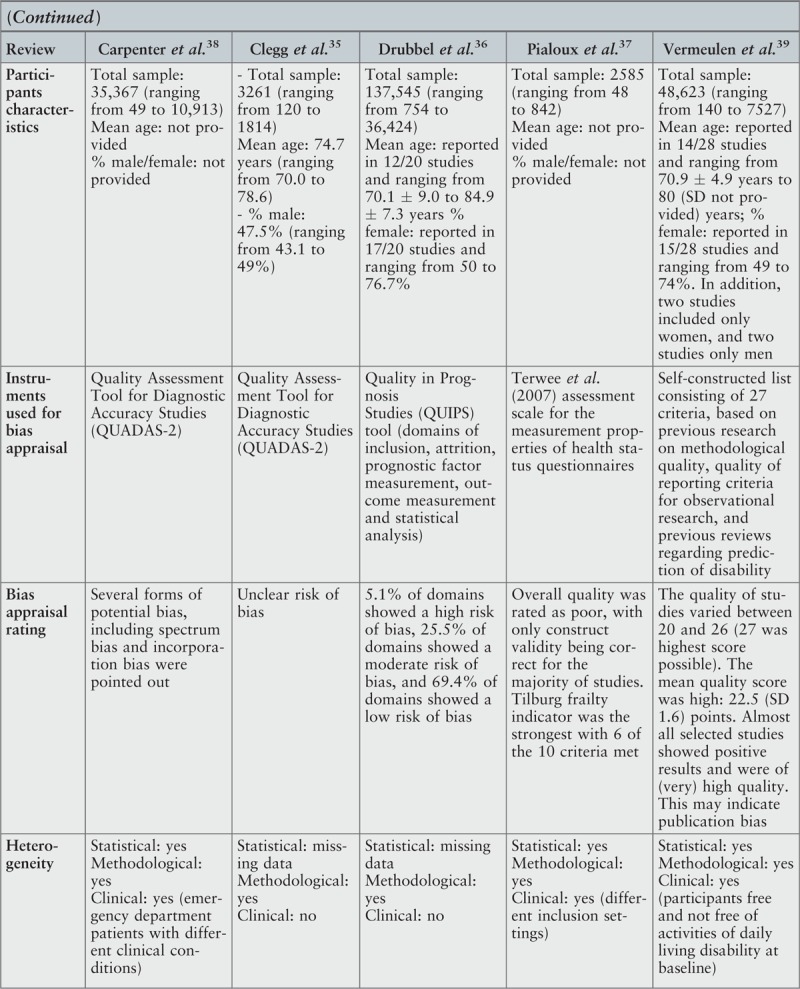
Footnotes
There is no conflict of interest in this project.
References
- 1.Rodriguez-Manas L, Feart C, Mann G, Viña J, Chatterji S, Chodzko-Zajko W, et al. Searching for an operational definition of frailty: a Delphi method based consensus statement: the frailty operative definition-consensus conference project. J Gerontol A Biol Sci Med Sci 2013; 68 1:62–67. [DOI] [PMC free article] [PubMed] [Google Scholar]
- 2.Lang PO, Michel JP, Zekry D. Frailty syndrome: a transitional state in a dynamic process. Gerontology 2009; 55 5:539–549. [DOI] [PubMed] [Google Scholar]
- 3.Fried LP, Ferrucci L, Darer J, Williamson JD, Anderson G. Untangling the concepts of disability, frailty, and comorbidity: implications for improved targeting and care. J Gerontol A Biol Sci Med Sci 2004; 59 3:255–263. [DOI] [PubMed] [Google Scholar]
- 4.Rockwood K. What would make a definition of frailty successful? Commentaries. Age and Ageing 2005; 34 5:432–434. [DOI] [PubMed] [Google Scholar]
- 5.Sternberg SA, Schwartz AW, Karunananthan S, Bergman H, Mark Clarfield A. The identification of frailty: a systematic literature review. Prog Geriatr 2011; 59 11:2129–2139. [DOI] [PubMed] [Google Scholar]
- 6.Le Maguet P, Roquilly A, Lasocki S, Asehnoune K, Carise E, Saint Martin M, et al. Prevalence and impact of frailty on mortality in elderly ICU patients: a prospective, multicenter, observational study. Intensive Care Med 2014; 40 5:674–682. [DOI] [PubMed] [Google Scholar]
- 7.Arya S, Kim SI, Duwayri Y, Brewster LP, Veeraswamy R, Salam A, et al. Frailty increases the risk of 30-day mortality, morbidity, and failure to rescue after elective abdominal aortic aneurysm repair independent of age and comorbidities. J Vasc Surg 2015; 61 2:324–331. [DOI] [PubMed] [Google Scholar]
- 8.Lahousse L, Maes B, Ziere G, Loth DW, Verlinden VJ, Zillikens MC, et al. Adverse outcomes of frailty in the elderly: the Rotterdam Study. Eur J Epidemiol 2014; 29 6:419–427. [DOI] [PubMed] [Google Scholar]
- 9.Fried LP, Tangen CM, Walston J, Newman AB, Hirsch C, Gottdiener J, et al. Frailty in older adults: evidence for a phenotype. J Gerontol A Biol Med Sci 2001; 5 6:M146–M156. [DOI] [PubMed] [Google Scholar]
- 10.Langlois F, Vu TTM, Kergoat MJ, Chassé K, Dupuis G, Bherer L. The multiple dimensions of frailty: physical capacity, cognition, and quality of life. Int Psychogeriatr 2012; 24 9:1429–1436. [DOI] [PubMed] [Google Scholar]
- 11.Ávila-Funes JA, Amieva H, Barberger-Gateau P, Le Goff M, Raoux N, Ritchie K, et al. Cognitive impairment improves the predictive validity of the phenotype of frailty for adverse health outcomes: the three-city study. J Am Geriatr Soc 2009; 57 3:453–461. [DOI] [PubMed] [Google Scholar]
- 12.Collard RM, Comijs HC, Naarding P, Penninx BW, Milaneschi Y, Ferrucci L, et al. Frailty as a predictor of the incidence and course of depressed mood. J Am Med Direct Ass 2015; 16 6:509–514. [DOI] [PMC free article] [PubMed] [Google Scholar]
- 13.Rockwood K, Mitnitski A. Frailty defined by deficit accumulation and geriatric medicine defined by frailty. Clin Geriatr Med 2011; 27 1:17–26. [DOI] [PubMed] [Google Scholar]
- 14.Collard RM, Boter H, Schoevers RA, Oude Voshaar RC. Prevalence of frailty in community-dwelling older persons: a systematic review. J Am Geriatr Soc 2012; 60 8:1487–1492. [DOI] [PubMed] [Google Scholar]
- 15.Ferrucci L, Windham BG, Fried LP. Frailty in older persons. Genus 2005; 61 1:39–53. [Google Scholar]
- 16.Varadhan R, Seplaki CS, Xue QL, Bandeen-Roche K, Fried LP. Stimulus-response paradigm for characterizing the loss of resilience in homeostatic regulation associated with frailty. Mech Ageing Dev 2008; 129 11:666–670. [DOI] [PMC free article] [PubMed] [Google Scholar]
- 17.Clegg A, Young J, Iliffe S, Rikkert MO, Rockwood K. Frailty in elderly people. Lancet 2013; 381:752–762. [DOI] [PMC free article] [PubMed] [Google Scholar]
- 18.D’Avanzo B, Shaw R, Riva S, Apostolo J, Bobrowicz-Campos E, Kurpas D, et al. Stakeholders’ views and experiences of care and interventions for addressing frailty and pre-frailty: a meta-synthesis of qualitative evidence. Submitted. [DOI] [PMC free article] [PubMed] [Google Scholar]
- 19.Bergman H, Ferrucci L, Guralnik J, Hogan DB, Hummel S, Karunananthan S, et al. Frailty: an emerging research and clinical paradigm – issues and controversies. J Gerontol A: Biol Sci Med Sci 2007; 62 7:731–737. [DOI] [PMC free article] [PubMed] [Google Scholar]
- 20.Topinková E. Aging, disability and frailty. Ann Nutr Metab 2008; 52 (suppl 1):6–11. [DOI] [PubMed] [Google Scholar]
- 21.Gobbens R, van Assen M, Luijkx K, Wijnen-Sponselee MT, Schols JM. Determinants of frailty. J Am Med Dir Assoc 2010; 11 5:356–364. [DOI] [PubMed] [Google Scholar]
- 22.Cameron ID, Fairhall N, Langron C, Lockwood K, Monaghan N, Aggar Ch, et al. A multifactorial interdisciplinary intervention reduces frailty in older people: randomized trial. BC Med 2013; 11:65. [DOI] [PMC free article] [PubMed] [Google Scholar]
- 23.Cesari M, Vellas B, Hsu F-C, Newman AB, Doss H, King AC, et al. A physical activity intervention to treat the frailty syndrome in older persons – results from the LIFE-P study. J Gerontol A Biol Sci Med Sci 2015; 70 2:216–222. [DOI] [PMC free article] [PubMed] [Google Scholar]
- 24.Pulignano G, Del Sindaco D, Di Lenarda A, Tarantini L, Cioffi G, Gregori D, et al. Usefulness of frailty profile for targeting older heart failure patients in disease management programs: a cost-effectiveness, pilot study. J Cardiovasc Med 2010; 11 10:739–747. [DOI] [PubMed] [Google Scholar]
- 25.Eklund K, Wilhelmson K, Gustafsson H, Landahl S, Dahlin-Ivanoff S. One-year outcome of frailty indicators and activities of daily living following the randomized controlled trial; “Continuum of care for frail older people”. BMC Geriatr 2013; 13:76. [DOI] [PMC free article] [PubMed] [Google Scholar]
- 26.Rockwood K, Andrew M, Mitnitski A. A comparison of two approaches to measuring frailty in elderly people. J Gerontol A Biol Sci Med Sci 2007; 62 7:738–743. [DOI] [PubMed] [Google Scholar]
- 27.Basic D, Shanley Ch. Frailty in older inpatients population: using the clinical frailty scale to predict patient outcomes. J Aging Health 2015; 27 4:670–685. [DOI] [PubMed] [Google Scholar]
- 28.Pijpers E, Ferreira I, Stehouwer C, Nieuwenhuijzen Kruseman AC. The frailty dilemma. Review of the predictive accuracy of major frailty scores. Eur J Intern Med 2012; 23 2:118–123. [DOI] [PubMed] [Google Scholar]
- 29.The Joanna Briggs Institute. Joanna Briggs Institute reviewers’ manual. Adelaide: The Joanna Briggs Institute; 2014. [Google Scholar]
- 30.Apóstolo J, Cooke R, Bobrowicz-Campos E, Santana S, Marcucci M, Cano A, et al. Predicting risk and outcomes for frail older adults: a protocol for an umbrella review of available frailty screening tools. JBI Database System Rev Implement Rep 2015; 13 12:14–24. [DOI] [PubMed] [Google Scholar]
- 31.Rockwood K, Song X, MacKnight Ch, Bergman H, Hogan DB, McDowell I, et al. A global clinical measure of fitness and frailty in elderly people. CMAJ 2005; 173 5:489–495. [DOI] [PMC free article] [PubMed] [Google Scholar]
- 32.Jones DM, Song X, Rockwood K. Evaluation of a frailty index based on a comprehensive geriatric assessment in a population based study of elderly Canadians. Aging Clin Exp Res 2005; 17 6:465–471. [DOI] [PubMed] [Google Scholar]
- 33.Rubenstein LZ, Stuck AE, Siu AL, Wieland D. Impacts of geriatric evaluation and management programs on defined outcomes: overview of the evidence. J Am Geriatr Soc 1991; 39 (9 Pt 2):8S–16S. discussion 17S-18S. [DOI] [PubMed] [Google Scholar]
- 34.The Joanna Briggs Institute. Joanna Briggs Institute reviewers’ manual: methodology for JBI umbrella reviews. Adelaide: The Joanna Briggs Institute; 2014. [Google Scholar]
- 35.Clegg A, Rogers L, Young J. Diagnostic test accuracy of simple instruments for identifying frailty in community-dwelling older people: a systematic review. Age Ageing 2015; 44 1:148–152. [DOI] [PubMed] [Google Scholar]
- 36.Drubbel I, Numans ME, Kranenburg G, Bleijenberg N, de Wit NJ, Schuurmans MJ. Screening for frailty in primary care: a systematic review of the psychometric properties of the frailty index in community-dwelling older people. BMC Geriatr 2014; 14 1:27. [DOI] [PMC free article] [PubMed] [Google Scholar]
- 37.Pialoux T, Goyard J, Lesourd B. Screening tools for frailty in primary health care: a systematic review. Geriatr Gerontol Int 2012; 12 2:189–197. [DOI] [PubMed] [Google Scholar]
- 38.Carpenter CR, Shelton E, Fowler S, Suffoletto B, Platts-Mills TF, Rothman RE, et al. Risk factors and screening instruments to predict adverse outcomes for undifferentiated older emergency department patients: a systematic review and meta-analysis. Acad Emerg Med 2015; 22 1:1–21. [DOI] [PubMed] [Google Scholar]
- 39.Vermeulen J, Neyens JCL, van Rossum E, Spreeuwenberg MD, de Witte LP. Predicting ADL disability in community-dwelling elderly people using physical frailty indicators: a systematic review. BMC Geriatr 2011; 11 1:33. [DOI] [PMC free article] [PubMed] [Google Scholar]
- 40.Hofer SM, Sliwinski MJ. Birren JE, Schaie KW. Design and analysis of longitudinal studies in aging. Handbook of the psychology of aging 6th ed.San Diego: Academic Press; 2006. 15–37. [Google Scholar]
- 41.D’Amico G, Maliza G, D’Amico M. Prognosis research and risk of bias. Intern Emerg Med 2016; 11 2:251–260. [DOI] [PubMed] [Google Scholar]
- 42.de Vries NM, Staal JB, van Ravensberg CD, Hobbelen JS, Olde Rikkert MG, Nijhuis-van der Sanden MW. Outcome instruments to measure frailty: a systematic review. Ageing Res Rev 2011; 10 1:104–114. [DOI] [PubMed] [Google Scholar]
- 43.Pijpers E, Ferreira I, Stehouwer CD, Nieuwenhuijzen Kruseman AC. The frailty dilemma. Review of the predictive accuracy of major frailty scores. Eur J Intern Med 2012; 23 2:118–123. [DOI] [PubMed] [Google Scholar]
- 44.van Kan GA, Rolland Y, Andrieu S, Bauer J, Beauchet O, Bonnefoy M, et al. Gait speed at usual pace as a predictor of adverse outcomes in community-dwelling older people an international academy on nutrition and aging (IANA) task force. J Nutr Health Aging 2009; 13 10:881–889. [DOI] [PubMed] [Google Scholar]
- 45.Hamaker ME, Jonker JM, de Rooij SE, Vos AG, Smorenburg CH, van Munster BC. Frailty screening methods for predicting outcome of a comprehensive geriatric assessment in elderly patients with cancer: a systematic review. Lancet Oncol 2012; 13 10:E437–E444. [DOI] [PubMed] [Google Scholar]
- 46.Feng MA, McMillan DT, Crowell K, Muss H, Nielsen ME, Smith AB. geriatric assessment in surgical oncology: a systematic review. J Surg Res 2015; 193 1:265–272. [DOI] [PMC free article] [PubMed] [Google Scholar]
- 47.Langlois F, Vu TT, Kergoat MJ, Chassé K, Dupuis G, Bherer L. The multiple dimensions of frailty: physical capacity, cognition, and quality of life. Int Psychogeriatr 2012; 24 9:1429–1436. [DOI] [PubMed] [Google Scholar]
- 48.Guralnik JM, Ferrucci L, Pieper CF, Leveille SG, Markides KS, Ostir GV, et al. Lower extremity function and subsequent disability: consistency across studies, predictive models, and value of gait speed alone compared with the short physical performance battery. J Gerontol A Biol Sci Med Sci 2000; 55 4:M221–M231. [DOI] [PMC free article] [PubMed] [Google Scholar]
- 49.Holtzer R, Verghese J, Xue X, Lipton RB. Cognitive processes related to gait velocity: results from the Einstein aging study. Neuropsychology 2006; 20 2:215–223. [DOI] [PubMed] [Google Scholar]
- 50.Watson NL, Rosano C, Boudreau RM, Simonsick EM, Ferrucci L, Sutton-Tyrrell K, et al. Executive function, memory, and gait speed decline in well-functioning older adults. J Gerontol A Biol Sci Med Sci 2010; 65A 10:1093–1100. [DOI] [PMC free article] [PubMed] [Google Scholar]
- 51.Studenski S, Perera S, Patel K, Rosano C, Faulkner K, Inzitari M, et al. Gait speed and survival in older adults. JAMA 2011; 305 1:50–58. [DOI] [PMC free article] [PubMed] [Google Scholar]
- 52.Rosano C, Studenski SA, Aizenstein HJ, Boudreau RM, Longstreth WT, Newman AB. Slower gait, slower information processing and smaller prefrontal area in older adults. Age Ageing 2012; 41 1:58–64. [DOI] [PMC free article] [PubMed] [Google Scholar]
- 53.Aichele S, Rabbitt P, Ghisletta P. Life span decrements in fluid intelligence and processing speed predict mortality risk. Psychol Aging 2015; 30 3:598–612. [DOI] [PubMed] [Google Scholar]
- 54.Lima-Costa FM, Steptoe A, Cesar CC, de Oliveira C, Proietti FA, Marmot M. The influence of socioeconomic status on the predictive power of self-rated health for 6-year mortality in English and Brazilian older adults: the ELSA and Bambui cohort studies. Ann Epidemiol 2012; 22 9:644–648. [DOI] [PubMed] [Google Scholar]
- 55.Aichele S, Rabbitt P, Ghisletta P. Think fast, feel fine, live long: a 29 year study of cognition, health and survival in middle-aged and older adults. Psychol Sci 2016; 27 4:518–529. [DOI] [PubMed] [Google Scholar]
- 56.Open Science Collaboration. Psychology. Estimating the reproducibility of psychological science. Science 2015; 349 6251:aac4716. [DOI] [PubMed] [Google Scholar]
- 57.Gilbert DT, King G, Pettigrew S, Wison TD. Comment on “Estimating the reproducibility of psychological science”. Science 2016; 351 6277:1037. [DOI] [PubMed] [Google Scholar]
- 58.Anderson CJ, Bahník Š, Barnett-Cowan M, Bosco FA, Chandler J, Chartier CR, et al. Response to comment on “Estimating the reproducibility of psychological science”. Science 2016; 351 6277:1037. [DOI] [PubMed] [Google Scholar]
- 59.Cesari M, Gambassi G, van Kan G, Vellas B. Commentary. The frailty phenotype and the frailty index: different instruments for different purposes. Age Ageing 2014; 43 1:10–12. [DOI] [PubMed] [Google Scholar]
- 60.Rockwood K, Mitnitski A. Frailty in relation to the accumulation of deficits. J Gerontol A Biol Sci Med Sci 2007; 62 7:722–727. [DOI] [PubMed] [Google Scholar]