

Supplemental Digital Content is available in the text
Keywords: ALA, alpha-linolenic acid, diabetes, glucose, glycemic control, omega-3 fatty acid, polyunsaturated fatty acid
Abstract
Background:
Polyunsaturated fats (PUFAs) have been shown to reduce type 2 diabetes (T2DM) risk and improve insulin responsiveness in T2DM subjects, but whether the plant sources of omega-3 PUFA (alpha-linolenic acid [ALA]) have an effect on glycemic control requires further investigation.
Methods:
The parameters of interest were glycated hemoglobin (HbA1c), fasting blood glucose (FBG), fasting blood insulin (FBI), homeostatic model assessment for insulin resistance (HOMA-IR), fructosamine, and glycated albumin. A comprehensive search was conducted with MEDLINE, Embase, CINAHL, and Cochrane. Eligible studies included randomized controlled trials (RCTs) ≥1 month in duration that compared diets enriched in ALA with usual diets on glycemic parameters. For each study, the risk of bias as well as the study quality was assessed. Using the statistical software RevMan (v5.3), data were pooled using the generic inverse method with random effects model, and final results were expressed as mean differences (MD) with 95% confidence intervals (CI). Heterogeneity was assessed by the Cochran Q statistic and quantified by the I2 statistic.
Results:
A total of 8 trials (N = 212) were included in the meta-analysis. Compared to a control diet, a median dose of 4.4 g/day of ALA intake for a median duration of 3 months did not affect HbA1c (%) (MD = –.01; [95%: –.32, .31], P = .96). A median ALA dose of 5.4 g/day did not lower FBG (MD = .07; [95% CI: –.61, .76], P = .84) or FBI (MD = 7.03, [95% CI: –5.84, 19.89], P = .28). Summary effect estimates were generally compromised by considerable and unexplained heterogeneity (I2 ≥75%). In the subgroup analysis of continuous predictors, a reduction in HbA1c (%) and FBG (mmol/L) was significantly associated with an increased intake of ALA. Further adjustment for Publication Bias using Duval and Tweedie's trim-and-fill analysis provided an adjusted, significant MD of –.25 (95% CI: –.38, –.12; P <.001) for HbA1c (%).
Conclusions:
ALA-enriched diets did not affect HbA1c, FBG, or FBI. The scarce number of existing RCTs and the presence of heterogeneity in our meta-analysis limit the ability to make firm conclusions about ALA in T2DM management. The potential for ALA to have dose-dependent effects warrants further research in this area.
1. Introduction
Dietary modifications have strong potential to improve the management of glycemic parameters in type 2 diabetes (T2DM). One specific modification recommended by both the American and Canadian Diabetes Association is to increase consumption of unsaturated fats as a substitute for saturated and trans fats.[1,2] In particular, polyunsaturated fats (PUFA) have been associated with reducing cardiovascular disease risk, however their benefits beyond improving the lipid profile remain inconclusive.[3,4]The Nutrition Evidence Library, which pools together available prospective cohort data, has reported that there is strong evidence to support PUFAs for the reduction of T2DM risk and for improvements in insulin responsiveness, without specifying which particular PUFA source.[5] Evidence from randomized controlled trials (RCTs) suggests that fish omega-3 PUFAs, eicosapentanoic acid (EPA) and docosahexaenoic acid (DHA), do not improve glycemic parameters in T2DM.[1,6,7] Rather, evidence points toward ALA for benefits in glycemic control, as associations have been observed between ALA and lowered T2DM risk as well as improved insulin sensitivity.[8,9] In light of recent research supporting ALA's role in T2DM management and the increasing pressures on global fish stocks,[10] identifying the physiological effects of ALA, the only plant-derived omega-3 available, is urgently needed.
ALA is an 18-carbon omega-3 PUFA of plant origin, mainly derived from our diet through walnut, flaxseed, salba-chia seed, and canola oil. According to the American Heart Association, an intake of 1.5 to 3 g of ALA per day seems to be beneficial for individuals at risk for coronary heart disease.[11] Although some health agencies advocate increasing consumption of ALA-containing foods, the benefit of ALA in T2DM is not well established. Numerous animal and in vitro studies have demonstrated the ability of ALA to regulate glucose homeostasis by affecting insulin sensitivity through potential functions in gene regulation, fat metabolism, and adipocyte formation.[12–18] However, human studies have shown mixed findings in regards to the effect of dietary ALA on glycemic parameters, in both healthy populations[19–21] and T2DM populations.[22–30] Therefore, in the present study, we conducted a systematic review and meta-analysis to synthesize existing evidence from RCTs that evaluated the effect of ALA, from all sources, on glycemic control in a population with T2DM.
2. Methods
2.1. Protocol and registration
The systematic review and meta-analysis was conducted following the Cochrane Handbook for Systematic Reviews of Interventions[31] and reported following the PRISMA guidelines.[32] The study was registered online at ClinicalTrials.gov [ID: NCT02701894].
2.2. Search strategy and data sources
The electronic databases MEDLINE, Embase, CINAHL, and the Cochrane Central Register of Controlled Trials were searched using specific search terms (see Supplementary Table 1 which lists the search terms in the order they were searched), from inception through December 28, 2015, without language restrictions. The search terms identified dietary sources of ALA and biomarkers of T2DM: glycated hemoglobin (HbA1c), fasting blood glucose (FBG), fasting blood insulin (FBI), glycated albumin, and the homeostatic model for insulin resistance (HOMA-IR). This was supplemented by a manual search of the references of the included articles. One article[33] was obtained through contacting the author.[34]
2.3. Eligibility criteria
The titles and abstracts of the articles were assessed using prespecified inclusion and exclusion criteria by VD for studies up to December 2012, and by DL for those published between December 2012 and December 2015. We included RCTs that compared ALA intake with an appropriate control in a T2DM population, with a duration ≥1 month, to allow for inclusion of articles that tested shorter changes of glycemic control, fructosamine, and glycated albumin.[35,36] Included studies assessed at least one of HbA1c, fasting blood glucose (FBG), fasting blood insulin (FBI), HOMA-IR, fructosamine, or glycated albumin. Articles were required to report the amount of ALA administered to participants, and doses were to be ≥1.3 g/day, as defined by the lower end of AMDR to prevent ALA deficiency.[11] Studies that were not conducted in human subjects were not randomized, lacked a suitable control group, lacked suitable endpoint data, and were <1 month in duration were excluded.
2.4. Data collection and quality assessment
Several independent reviewers, DL, ACRM, VD, and ES, assessed the included articles that fulfilled the inclusion criteria, and extracted data following a standardized proforma. Relevant data included: study design, sample size, study characteristics (weight, gender, disease state, age, medications, etc.), treatment and control diet, endpoints assessed, diet compositions, settings (inpatient or outpatient), statistical analyses used, and funding source. Mean ± SD estimates for all relevant endpoints for control and intervention arms were extracted (HbA1c, FBG, FBI, HOMA-IR, fructosamine, and glycated albumin) for baseline, end, and change-from-baseline values. If necessary and possible, the SD was derived from available data (95% CI, P-values, t of F values, and standard error of the mean [SEM]), following standard formulas.[31] If presented, the absolute mean difference (MD) in change ± SE values and/or the change (MD) ± SE values between the control and treatment group were also extracted. The primary effect measure is the difference in change score between ALA and control arms in HbA1c; when not available, difference in end values are used. Our choice of primary outcome measure, HbA1c, is reflective of an individual's average blood glucose during the previous 3 months. This method remains useful for detecting long-term and sustainable changes in diabetic complications.[37] If critical data could not be retrieved from the article (such as the dose of ALA administered) and authors could not be contacted after 3 email attempts, then the article was excluded and data was deemed irretrievable. The present meta-analysis extracted patient data from eligible RCTs, which have obtained patient consent for data collection. For this reason, our study did not require an ethics committee approval.
The risk of bias was assessed using the Cochrane Collaboration Tool for Assessing Risk of Bias.[31] The test for risk of bias ultimately determines whether the articles have credible results, which cannot be confirmed by assessment of the studies for appropriate methodological procedures or study quality.[31] We assessed each trial for an “Unclear,” “Low,” or “High” risk of bias in the following domains: sequence generation, allocation concealment, blinding, outcome data, and outcome reporting. Articles that were considered high risk had methodological flaws that likely influenced the results, and low risk articles indicated the use of methodology that is conventionally recognized to eliminate bias. If insufficient data were presented to make this assessment, then the article was indicated to have an unclear risk of bias.
The quality of the studies was assessed using the Heyland Methodological Quality Score (MQS).[38] A maximum of 12 points could be assigned to each article, and these points were given based on methodology (randomization, blinding, and analysis), sample (selection, compatibility, and follow-up), and intervention (protocol and co-interventions). Studies that were given a score of ≥8 were deemed higher quality. Any discrepancies between the study MQS and data extracted by the co-extractors were resolved by discussion and consensus. Likewise, the final inclusion of articles was decided based on discussion and agreement.
2.5. Statistical analysis
The statistical software Revman v5.3 (The Nordic Cochrane Centre, The Cochrane Collaboration, Copenhagen, Denmark) was used to analyze the data. When at least 2 studies provided data, we performed a DerSimonian and Laird random effects meta-analysis, which yields conservative confidence intervals (CIs) around effect estimates in the presence of heterogeneity. Paired analyses were conducted for crossover trials using 0.5 as a correlation coefficient. This represents a conservative estimate, which is used when the pooled correlation coefficient could not be derived for the imputation of unavailable SD.[39] Data are presented as MD with 95% CIs. A 2-sided P-value of <.05 was used to determine the significance of the difference.
Heterogeneity was determined by the Cochran Q test (significant at P <.10), quantified by the I2 statistic (range 0%–100%). I2 <50%, <75%, and ≥75% represented “moderate,” “substantial,” and “considerable” heterogeneity, respectively.[31] Irrespective of outcome, sources of heterogeneity for each outcome measure were explored with subgroup analysis, using STATA software to perform meta-regression and explore the significance of the subgroup effects. Subgroups were determined a priori, based on: ALA source (flaxseed oil, flax seed, salba-chia, or walnut), ALA dose, study duration, study quality (MQS), study design (control or parallel), method of intake, and baseline outcome values for each respective outcome. Study characteristics were analyzed as continuous (dose, duration, and baseline values) or categorical predictors (dose, MQS, study type, ALA source, duration, and method of intake).
Sensitivity analyses were conducted to explore the effect of each individual trial on the total summary effect and heterogeneity. This was done by systematically removing an individual trial at a time from the meta-analysis to allow for a recalculation of the effect size and heterogeneity for the remaining trials (a “leave-one-out” analysis).
Publication bias was investigated by visual inspection of funnel plots for asymmetry and quantitatively assessed using Egger's and Begg's tests. P <.10 was considered evidence of small study effects. To correct for publication bias, Duval and Tweedie's trim-and-fill analysis was used to estimate the number of studies that may have been suppressed and provide an adjusted summary effect with the filled studies.[40,41]
3. Results
3.1. Search results
The literature search identified 1189 potentially relevant articles. After duplicate studies were removed and ineligible studies were excluded, 48 studies were reviewed in full, and 8 studies were included in the quantitative syntheses (Fig. 1). One trial that had irretrievable information for the dose of ALA[42] and another trial that incorporated a low dose of 1.2 g/day [33] in an exclusive post-menopausal female population were both excluded after careful consideration. Sensitivity analysis in which both of these trials were independently added to the meta-analysis did not significantly alter the results. Four used flaxseed oil, [22,26,27,29] 3 studies [24,25,28] incorporated walnuts, and 1 used salba-chia seed as the source of ALA. All 8 trials reported HbA1c and 7 trials reported FBG and FBI. Only 1 article [29] reported on HOMA-IR, so meta-analysis could not be performed on this outcome measure. None of the studies provided values for glycated albumin or fructosamine.
Figure 1.

PRISMA flow diagram. Search and data selection.
3.2. Trial characteristics
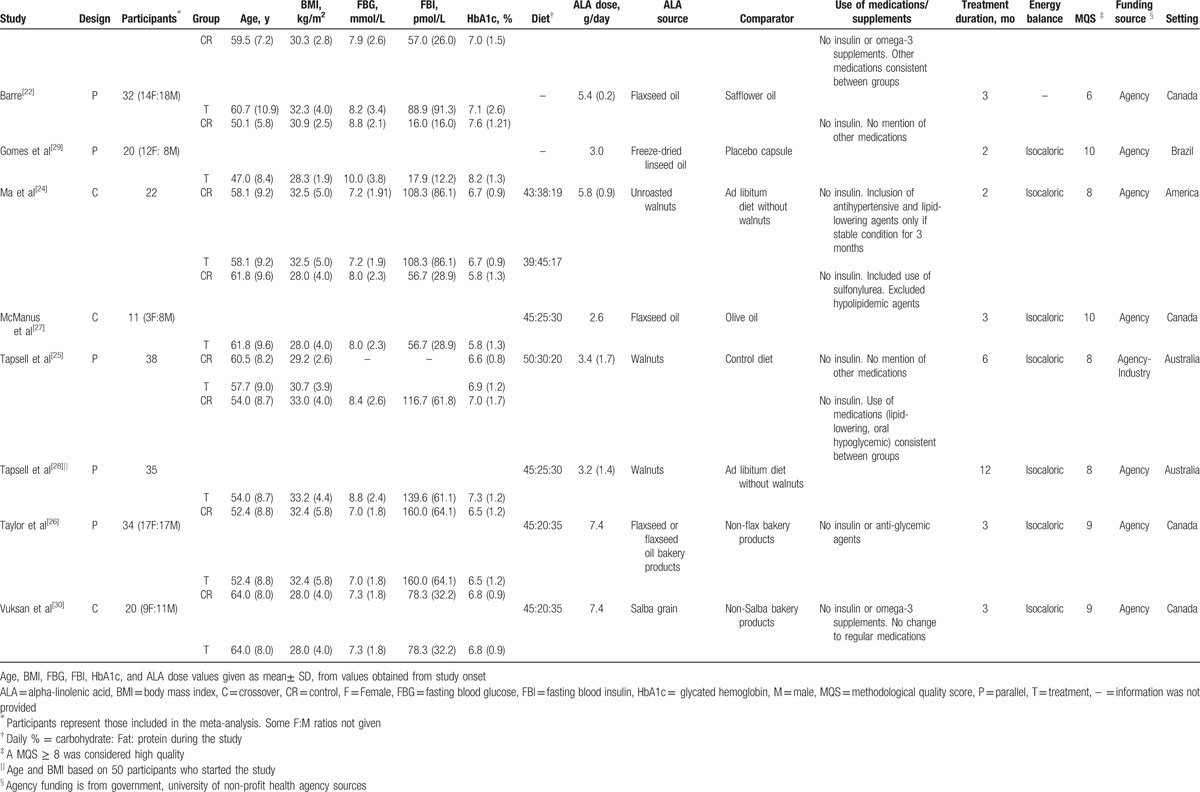
Table 1 summarizes the characteristics of the included trials. All studies were in outpatient settings. Five studies were conducted in North America: 4 in Canada (50%) [22,26,27,30] and 1 in United States (12.5%) [24]; 2 were conducted in Australia (25%) [25,28] and 1 was conducted in Brazil (12.5%).[29] Five trials (62.5%) [22,25,26,28,29] were parallel designs, and 3 (37.5%) [24,27,30] were crossover designs. Participants were generally middle-aged (median age = 54 years, range = 47–64 years) and overweight or obese (median BMI = 30.7, range = 28.0–33.2). Overall, participants had controlled diabetes (median HbA1c: 6.8%, median FBG: 7.95 mmol/L), and the majority of studies indicated the use of hypoglycemic drugs or other medications, although all studies excluded the use of insulin therapy. The dose of ALA ranged from 1.5 to 7.4 g/day with a median assigned dose of 4.4, 5.4, and 5.4 g/day of ALA for trials that reported HbA1c, FBG, and FBI, respectively. The median duration of the treatment was 3 months, ranging from 2 to 12 months. Seven studies (87.5%) [24–30] were considered high quality (MQS ≥8).
Table 1.
Characteristics of included studies.
Using the Cochrane Risk of Bias Tool (see Supplementary Fig. 1 which illustrates the risk of bias across the included studies), a moderate number of trials had unclear risk of selection bias: 50% (4 trials)[22,25,26,29] had an unclear risk of bias for random sequence generation, and 62.5% (5 trials)[22,24,25,27,29] had an unclear risk of bias for allocation concealment. While half of the studies (4 trials, 50%)[24,27,29,30] had a low risk of performance bias, 2 trials (25%) [26,28] had a high risk of performance bias, meaning they did not mention blinding or only the subjects were blinded. The vast majority of trials (7 trials, 87.5%)[22,24–27,29,30] had a low risk of attrition bias (incomplete outcome data), therefore they were transparent about numbers and reasons for drop-outs. Lastly, 3 studies (37.5%)[22,25,27] had an unclear risk of reporting bias (selective reporting) and 5 studies (62.5%)[24,26,28–30] had a low risk. Funding of trials included agency (7 trials, 87.5%)[22,24,26–30] and agency industry (1 trial, 12.5%).[25]
3.3. Effect on HbA1c
A median dose of 4.4 g/day of ALA for a median duration of 3 months did not significantly affect HbA1c (%) levels compared to control (MD = –.01 [95%: –.32, .31], P = .96; see Fig. 2). There was considerable inter-study heterogeneity (I2 = 91%, P <.00). The “leave-one-out” analysis did not identify any influential trials whose removal altered the pooled summary effect or reduced heterogeneity.
Figure 2.
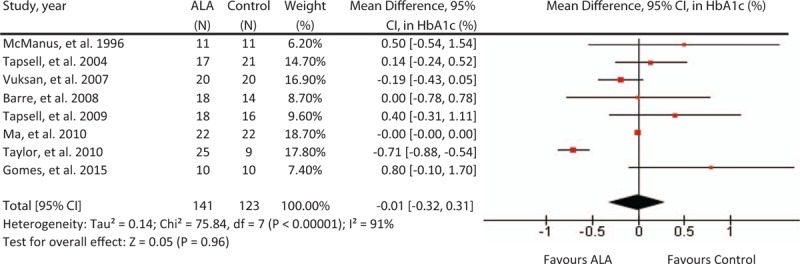
Forest plot of randomized controlled trials investigating ALA on HbA1c (%). Pooled effect estimate (diamond) for HbA1c from 10 trials. Data expressed at MD ± SD, with 95% CIs, using the generic inverse-variance method with random effects model. Between-study heterogeneity quantified by I2 at a significance P <.10. N = number of participants in each treatment group. ALA = alpha-linolenic acid, CI = confidence interval, HbAc1 = glycated hemoglobin, MD = mean difference, SD = standard deviation.
3.4. Effect on FBG
A median dose of 5.4 g/day for a median duration of 3 months did not significantly affect FBG levels (MD = .07, [95% CI: –61, .76], P = .84; Fig. 3). Considerable inter-heterogeneity was present (I2 = 78%, P <.001), and the “leave-one-out” analysis did not reveal any influential trials whose removal significantly affect the summary effect size or degree of heterogeneity.
Figure 3.
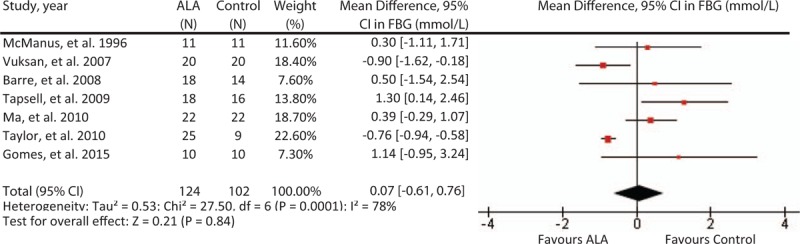
Forest plot of randomized controlled trials investigating ALA on FBG (mmol/L). Pooled effect estimate (diamond) for FBG)from 9 trials. Data expressed at MD ± SD, with 95% CIs, using the generic inverse-variance method with random effects model. Between-study heterogeneity quantified by I2 at a significance P <.10. N = number of participants in each treatment group. ALA = alpha-linolenic acid, CI = confidence interval, FBG = fasting blood glucose, MD = mean difference, SD = standard deviation.
3.5. Effect on FBI
A median dose of 5.4 g/day for a median duration of 3 months did not significantly affect FBI (MD = 7.03, [95% CI: –5.84, 19.89], P = .28; Fig. 4). There was considerable inter-study heterogeneity (I2 = 82%, P <.001). The “leave-one-out” analysis did not identify any influential trials whose removal altered the pooled summary effect or reduced heterogeneity.
Figure 4.
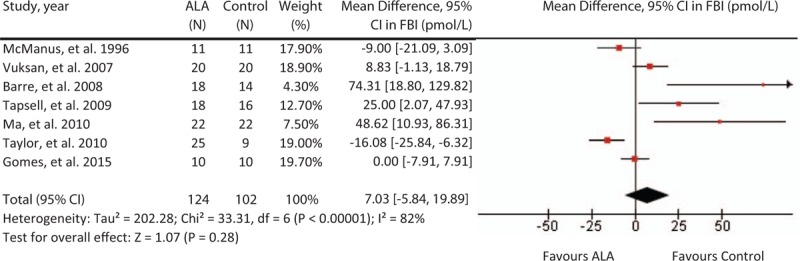
Forest plot of randomized controlled trials investigating ALA on FBI (pmol/L). Pooled effect estimate (diamond) for FBI from 9 trials. Data expressed at MD ± SD, with 95% CIs, using the generic inverse-variance method with random effects model. Between-study heterogeneity quantified by I2 at a significance P <.10. N = number of participants in each treatment group. ALA = alpha-linolenic acid, CI = confidence interval, FBI = fasting blood insulin, HbAc1 = glycated hemoglobin, MD = mean difference, SD = standard deviation.
3.6. Subgroup analysis
There are several possible sources of the heterogeneity for our results, including the varying sources of ALA, dose, and method of intake (supplement or dietary intake). Sources of heterogeneity were explored with continuous subgroup analysis, which revealed dose to be a significant effect modifier for HbA1c and FBG levels, but not for FBI. The results indicate that the treatment effect in HbA1c (P <.02) and FBG (P <.01) was inversely related to ALA dose (see Supplementary Table 2). Subgroup analysis of characteristics treated as categorical predictors (see Supplementary Figures 2–4) revealed no significant influences by dose or other traits: method of intake, endpoint baseline value, duration, ALA source, study design, and MQS, as indicated by P-value. Nonetheless, in analyses of HbA1c and FBG, residual I2 was dramatically reduced to ∼35% when accounting for different ALA sources.
3.7. Publication bias
Funnel plots for HbA1c, FBG, and FBI are displayed in Fig. 5. By visual inspection, the results illustrate a slight asymmetry toward studies reporting a non-beneficial effect on glycemic control, suggesting a lack of publication bias. Egger's and Begg's test indicate a lack of small-study effects, as quantified by P values, except in the analysis on FBI (Eggers; P = .082, Begg's; P = .035). Possible sources could be true heterogeneity, such as differing intensities of ALA interventions. Using Duval and Tweedie's trim-and-fill analysis, we observed “missing studies” in each of the outcome measures (Fig. 6), deriving an adjusted MD of –.25 [95% CI: –.38, –.12], P <.001; I2 = 99.79, P = .00, for our primary outcome of interest, HbA1c (%).
Figure 5.
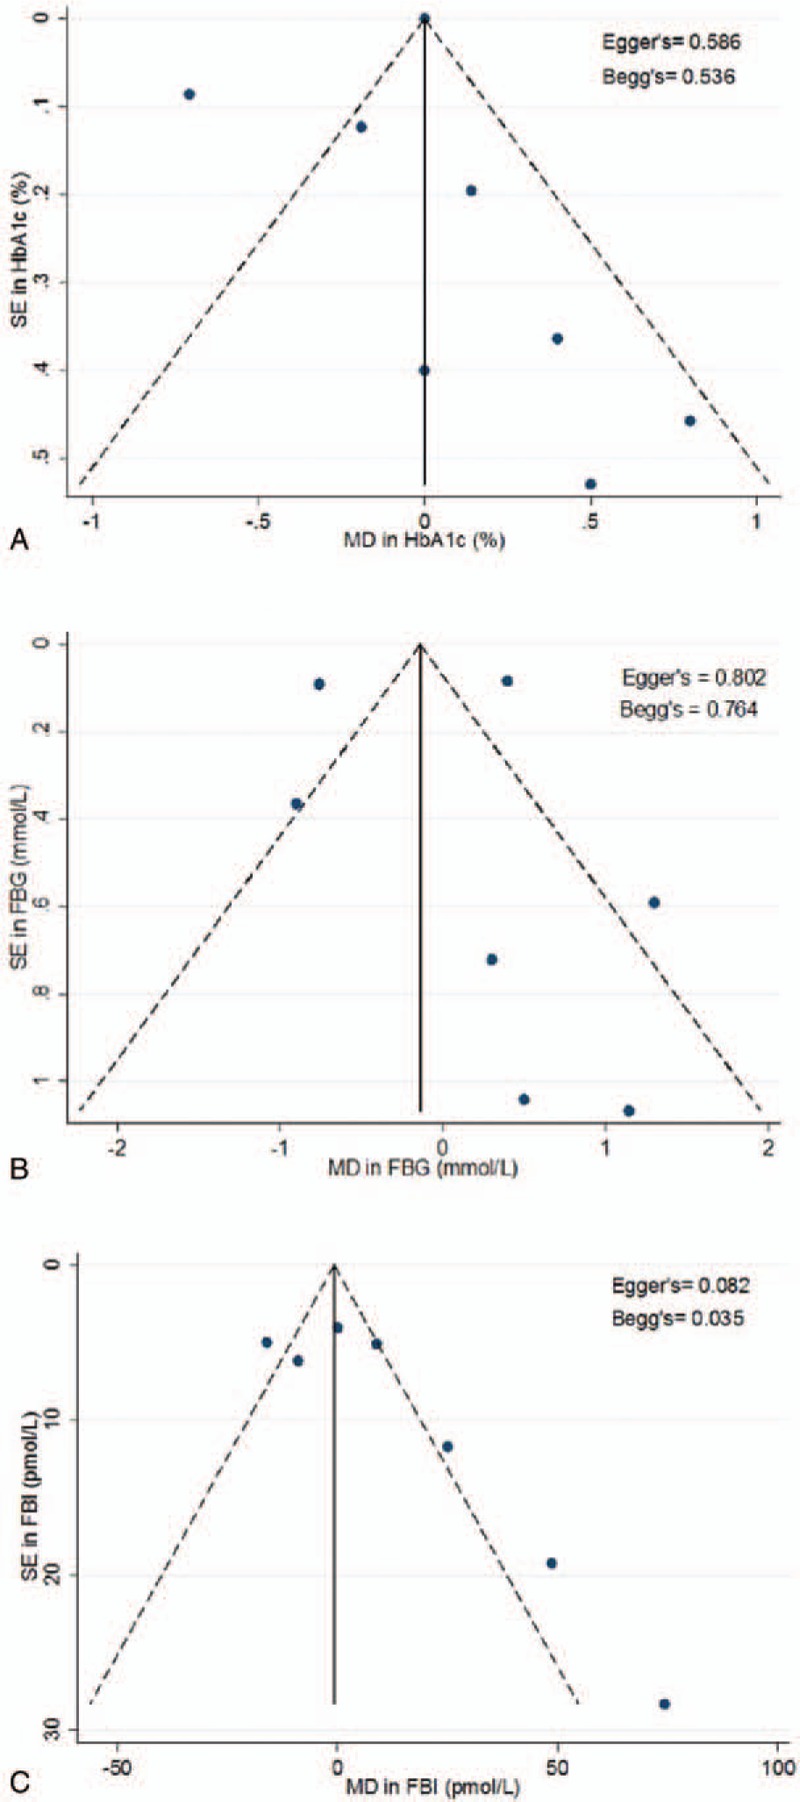
Funnel plots assessing publication bias. The funnel plots represent a visual assessment of publication bias for the studies investigating ALA on (A). HbA1c (%) (B). FBG (mmol/L) (C). FBI (pmol/L). The solid line represents the pooled summary effect expressed as a weighted MD. The dashed lines represent pseudo 95% CIs. Publication bias and small-study effects were quantitatively assessed using Egger's and Begg's test and presented as P-values. ALA = alpha-linolenic acid, CI = confidence interval, FBG = fasting blood glucose, FBI = fasting blood insulin, HbAc1 = glycated hemoglobin, MD = mean difference.
Figure 6.
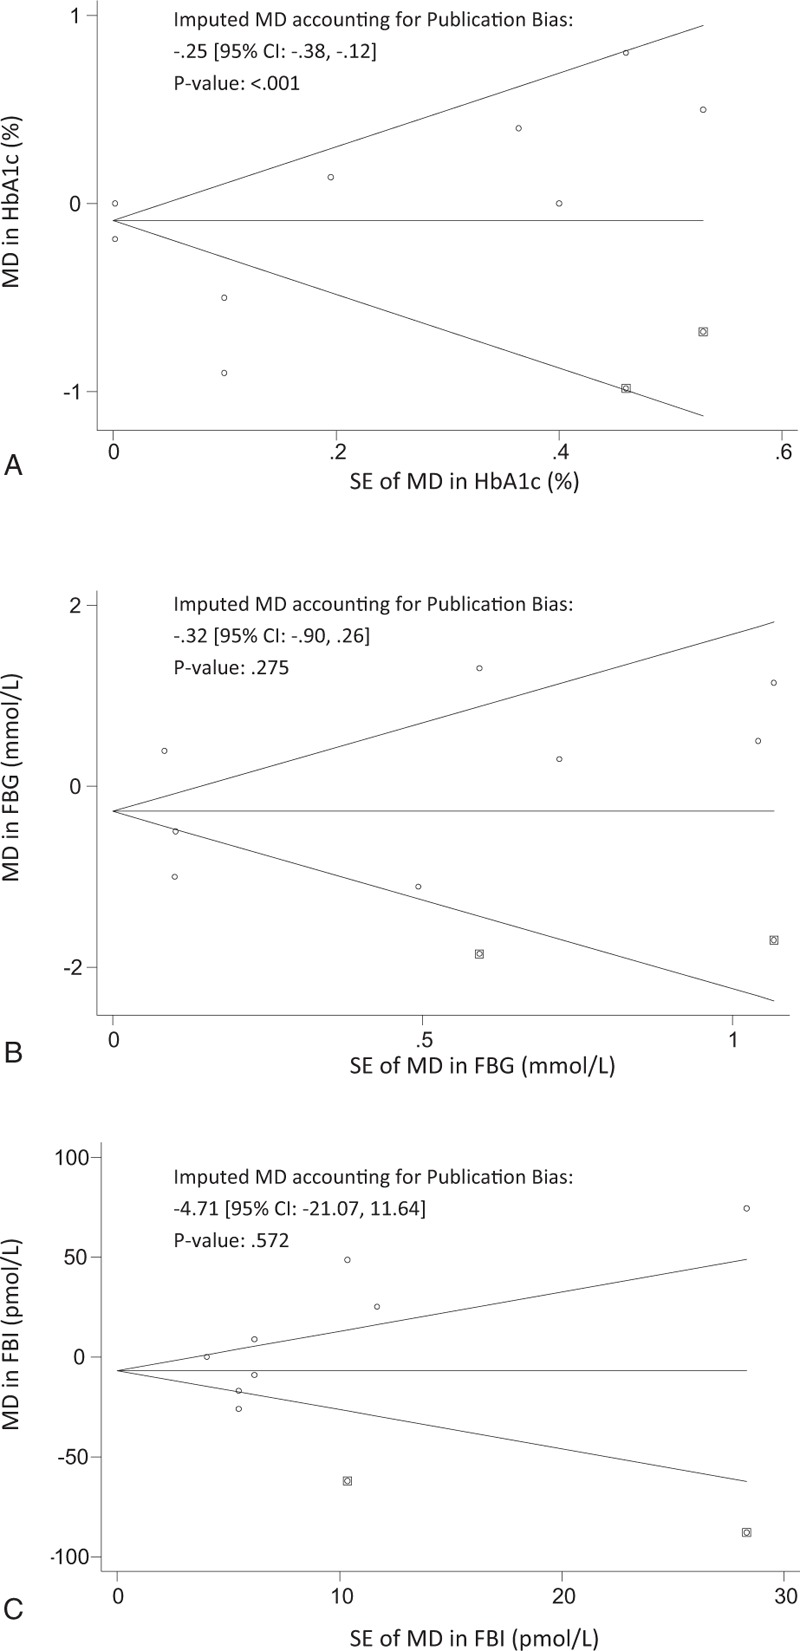
Funnel Plots for correcting Publication bias using trim-and-fill analysis. Funnel plots for trim-and-fill analysis of (A). HbA1c (%) (B). FBG (mmol/L) (C). FBI (pmol/L). The horizontal line represents the pooled effect estimate expressed as a mean difference, and the diagonal lines represent pseudo-95% CIs of the mean difference. Clear circles represent the effect estimates of the included studies, and the black squares represent the imputed studies. CI = confidence interval, FBG = fasting blood glucose, FBI = fasting blood insulin, HbAc1 = glycated hemoglobin.
4. Discussion
This systematic review and meta-analysis of 8 RCTs involving 212 participants with T2DM, with a median ALA dose of 4.4 g/day, found a neutral effect of ALA intake on HbA1c, fasting blood glucose, or fasting blood insulin levels. We observed, however, that ALA dose was correlated with reductions in HbA1c (%) and FBG (mmol/L) outcome measures. A significant reduction in Hba1c (%) was also observed after Duval and Tweedie's trim-and-fill analysis. This is the first meta-analysis of RCTs to assess the effect of ALA on biomarkers of glycemic control exclusively in individuals with T2DM.
Two previously conducted systematic reviews that primarily investigated the effect of ALA on cardiovascular risk markers in a mixed population of participants with and without T2DM provided inconclusive evidence on glycemic markers. A meta-analysis by Wendland et al, [21] observed that ALA intake reduced FBG by .20 mmol/L (95% CI: –.3, –.1, P <.01); however, this estimate was based on 2 trials (N = 127) in nondiabetic, moderately hyperlipidemic participants. Balk et al[43] reported, over 10 years ago, on the effects of 2 ALA intervention trials in individuals without T2DM. A meta-analysis was not performed on the 2 studies that reported FBG (N = 529) because of concerns of validity for 1 study that showed a reduction (MD = –.28, P <.001).[44] The other study was high quality and showed no effect (MD = –.28, P = NS).[45] None assessed HbA1c modification. While our primary analysis did not find an effect of ALA intake on HbA1c or other related glycemic measures, a significant reduction in HbA1c (%) was observed after trim-and-fill analysis was used to impute the missing studies (MD = –.25, 95% CI: –.38, –.12, P <.001). Caution should be taken when interpreting the adjusted effect estimate, as this method may not be reliable in the presence of substantial inter-study heterogeneity, which still remained (I2 = 99.79, P = .00).[31]
The potential of ALA as a blood glucose-lowering dietary component was not supported by our results but should not be discounted based on the totality of available evidence. Preclinical literature suggests that omega-3 PUFAs, including ALA, activate PPARγ and other globally distributed peroxisome proliferation activated receptors.[46] It is believed that PPARγ activation in T2DM may cause significant improvements in whole-body insulin sensitivity, and thus, improvements in parameters of glycemic control.[47] As adipose tissue is a significant modulator of PPARγ's effect on insulin sensitivity and ALA is the most abundant omega-3 in adipose tissue,[48] there may be a connection between ALA intake and insulin sensitivity on a whole-body level. Despite this suggested preclinical link, a clinically meaningful effect on any parameters of glucose regulation within the experimental dose range was not observed. However, a factor that should be considered is the rather low median HbA1c level of 6.8% among participants at baseline. This is indicative of a well-controlled T2DM population receiving effective oral hypoglycemic agents, with perhaps a limited possibility for further improvements.
The mechanistic properties of ALA have yet to be fully understood, and it is unclear whether the null effect of ALA on glycemic control observed in our study is transferable to other omega-3 sources. ALA is a precursor in the desaturation and elongation pathway for the production of the very-long chain metabolites EPA and DHA; however, this degree of conversion remains controversial.[49] There is evidence supporting conversion rates as low as 0.2% to as high as 15% for EPA and DHA altogether,[11,50] although it is generally believed that ALA cannot contribute to substantial amounts of EPA/DHA in the plasma.[48] Due to this metabolic inefficiency, the potential effect stemming from ALA-derived EPA/DHA is questionable. Preclinical data suggest that all 3 sources of omega-3 improve insulin signaling,[46] however, clinical data has shown inconsistency, which may be attributed to different regulation systems between rodents and humans. The most recent systematic review and meta-analysis of marine omega-3 fatty acid supplementation in individuals with T2DM observed that EPA and DHA intake did not have an effect on glycemic control (HbA1c: –.05 [–.20, .11], FPG: .19 [–.01, .39]).[51] The present investigation aimed to synthesize the glycemic effects of ALA intake, which may be distinctive from their downstream EPA and DHA metabolites. However, our results are consistent with clinical findings of marine omega-3 sources, which have not been associated with improvements in glycemic outcomes in T2DM.
Plant sources of omega-3 may be more accessible than marine sources globally, but advocating for increased ALA intake for dietary management of T2DM remains unsupported in light of our results. Considering Americans’ average diet consists of about 1.4 g of ALA/day,[11] the median dose of 4.4 g/day in our meta-analysis may not be representative but can be readily achieved by taking 1 to 2 tablespoons of flax or salba-chia seeds, or about 12 whole walnuts per day.[52] Furthermore, it has been suggested that our diets during the Paleolithic period consisted of a much higher omega-3 to omega-6 fatty acid ratio and our estimated daily intakes were ∼11.4 g ALA/day because of the natural abundance of omega-3 in wild plants, nuts, and berries.[53] Thus, there remains an opportunity to incorporate higher doses into our modern diet to induce physiological benefits. Presently, at the levels administered in the trials of our study, including the highest dose being 7.4 g ALA/day [26,30], safety and adverse effects were not reported. To date, the tolerable upper intake level (UL) has not been established for ALA, and although toxicological data for ALA are limited, little adverse effects have been reported to date.[50] However, there is the potential concern of ALA and prostate cancer risk. In a systematic review and meta-analysis of prospective cohorts (N = 155,503) by Brouwer et al,[54] ALA was associated with a reduced risk of fatal heart disease (RR = .79, 95% CI: .6, 1.04) but was also correlated with an increased risk of prostate cancer (RR = 1.7, 95% CI: 1.12, 2.58). Conversely, a recent meta-analysis of prospective cohorts and case–control studies did not corroborate a significant relationship between ALA and prostate cancer risk (RR: 1.08, 95% CI: .90–1.29), P = .40).[55] The relevance of this association must be further studied, as present findings are complicated with the presence of heterogeneity and remain inconclusive.
The strengths of our study include the high methodological quality of the included trials (87.5% of included studies were graded a MQS ≥8), which suggests a selection of RCTs with properly described methods, sampling, and interventions of high-quality data collection. Second, our analysis included participants that spanned 5 countries, suggesting moderate generalizability of results and reduction of potential confounders that may be present in a single geographical location. Participants were middle-aged (median age = 54 years) and obese or overweight, which is consistent with the T2DM phenotype. Third, the inclusion criteria aimed to encompass all major food sources of ALA, making the results relevant in the context of populations’ derived ALA intake. Furthermore, we acknowledge the effectiveness of incorporating whole foods and dietary pattern approaches in dietary changes, as opposed to single nutrient recommendations.[56] In many cases, the presence of ALA in food represents a marker of other healthy ingredients such as dietary fiber, vegetable protein, minerals, and antioxidants.
Several caveats complicate interpretation of the present findings. One limitation of our study is the presence of considerable heterogeneity (≥75%) across all outcome measures. ALA dose can partially explain this; it was observed to be a significant predictor for both HbA1c and FBG, and accounted for 100% of the heterogeneity (I2) for FBG. The observed inverse relationship suggests that higher ALA intake may be considered in future directions, as dose may be an important factor in determining effect size. Subgroup analysis did not reveal any significant categorical predictors from the method of intake, endpoint baseline value, duration, ALA source, dose above or below 4.4 g/day, study design, or MQS. Nonetheless, heterogeneity was dramatically reduced to ∼35% when the effects of different ALA sources on HbA1c and FBG were considered. It appears in our results that ALA from certain sources such as flaxseed and salba-chia seed are more effective in the reduction of HbA1c and FBG, but this was only supported by 1 trial each. With a small total sample size, it is likely that subgroup analysis did not have sufficient power to detect differences. Additionally, the systematic removal of individual articles did not significantly alter heterogeneity, demonstrating that the inconsistency may be from all trials.
Second, we were unable to assess the risk of bias across several domains of the included studies. Five trials (62.5%) had an unclear risk of allocation concealment (selection bias). This was assigned when studies did not describe methods of concealment in detail for reviewers to assess whether subjects could foresee their allocation to treatments or not. Two (20%) studies had a high risk of performance bias because of lack of blinding or blinding only the participants.
Third, the variability in ALA-containing foods, their respective bioactive components and the differential ALA absorption among individuals may have resulted in potential co-linearity or counteracting of ALA's isolated effect. Although ALA source and method of intake was not identified as an effect modifier in categorical subgroup analysis, again, the analysis remains limited by the small number of studies.
Difficulty in controlling background diet has been a long-standing barrier in the elucidation of ALA effects, especially in ad-libitum diets where differences may lie in macronutrient portions and the intake of high versus low glycemic index carbohydrates. The included trials, however, indicate isocaloric interventions, except 1,[22] and macronutrient fractions that were not markedly different. Furthermore, the intake ratio of different types of fatty acids could alter downstream effects, such as omega-6 competing with omega-3 for shared enzymes in the elongation and desaturation pathway.[53] The use of well-designed RCTs employing ALA supplementation and serum ALA testing in future interventions could further improve the accuracy of gathered data and re-assess ALA efficacy in T2DM.
5. Conclusions
The present analysis, despite including a relatively small number of studies, represents the most comprehensive and updated synthesis of evidence for ALA on glycemic control markers in T2DM. Although the overall effect was neutral, the associations observed between ALA dose and glycemic outcomes, as well as the reduction in HbA1c after adjusting for publication bias, calls for further research on this relationship. While there may be greater benefit from incorporating ALA-containing foods, prioritizing focus on ALA dose-response studies could clarify the need for larger, longer and well-designed RCTs administering newly defined doses. Overall, the relatively low number of existing trials and the presence of unexplained heterogeneity limit our ability to draw definite conclusions; however, further explorations into the role of ALA in T2DM management should be considered.
Acknowledgments
Authors wish to thank the Information Specialist, Teruko Kishibe of Li Ka Shing's International Healthcare Education Centre at St. Michael Hospital for her help in the development of the search strategy.
Supplementary Material
Footnotes
Abbreviations: ALA = alpha-linolenic acid, AMDR = acceptable macronutrient distribution range, CI = confidence interval, DHA = docosahexaenoic acid, EAR = estimated average requirement, EPA = eicosapentanoic acid, FBG = fasting blood glucose, FBI = fasting blood insulin, HbA1c = glycated hemoglobin, HOMA-IR = homeostatic model assessment for insulin resistance, MD = mean difference, MQS = methodological quality score, RCTs = randomized controlled trials, SD = standard deviation, T2DM = type 2 diabetes mellitus, UL = tolerable upper intake level.
Protocol registration: ClinicalTrials.gov identifier, NCT02701894
EJ and DL contributed equally to this work.
Funding: DL's work was supported by the 2016 Keenan Research Student (KRSS) Program Grant and internal funding. JLS was supported by a PSI Foundation Graham Farquharson Knowledge Translation Fellowship, Canadian Diabetes Association (CDA) Clinician Scientist Award, Banting & Best Diabetes Centre Sun Life Financial New Investigator Award, and CIHR INMD/CNS New Investigator Partnership Prize.
COMPETING INTERESTS
In the last 5 years, RdS has served as an external resource person to the World Health Organization's Nutrition Guidelines Advisory Group on trans fats and saturated fats. The WHO paid for his travel and accommodation to attend meetings from 2012 to 2015 to present and discuss this work. He has also done contract research for the Canadian Institutes of Health Research's Institute of Nutrition, Metabolism, and Diabetes, Health Canada, and the World Health Organization for which he received remuneration. He has held a grant from the Canadian Foundation for Dietetic Research as a principal investigator, and is a co-investigator on several funded team grants from Canadian Institutes of Health Research. JLS has received research support from the Canadian Institutes of health Research (CIHR), Canadian Diabetes Association (CDA), PSI Foundation, Calorie Control Council, Banting and Best Diabetes Centre (BBDC), American Society for Nutrition (ASN), Dr. Pepper Snapple Group (investigator initiated, unrestricted donation), INC International Nut and Dried Fruit Council, and The Tate and Lyle Nutritional Research Fund at the University of Toronto. He has received speaker fees and/or honoraria from the Canadian Diabetes Association (CDA), Canadian Nutrition Society (CNS), University of Alabama at Birmingham, Abbott Laboratories, Canadian Sugar Institute, Dr. Pepper Snapple Group, The Coca-Cola Company, Dairy Farmers of Canada, Nutrition Foundation of Italy (NFI), C3 Collaborating for Health, White Wave Foods, Rippe Lifestyle, mdBriefcase, Alberta Milk, Food Minds, PepsiCo, and Pulse Canada. He has ad hoc consulting arrangements with Winston & Strawn LLP, Perkins Coie LLP, and Tate & Lyle. He is a member of the European Fruit Juice Association Scientific Expert Panel. He is on the Clinical Practice Guidelines Expert Committees of the Canadian Diabetes Association (CDA), European Association for the study of Diabetes (EASD), and Canadian Cardiovascular Society (CCS), as well as an expert writing panel of the American Society for Nutrition (ASN). He serves as an unpaid scientific advisor for the Food, Nutrition, and Safety Program (FNSP) and the Technical Committee on Carbohydrates of the International Life Science Institute (ILSI) North America. He is a member of the International Carbohydrate Quality Consortium (ICQC), Executive Board Member of the Diabetes and Nutrition Study Group (DNSG) of the EASD, and Director of the Toronto 3D Knowledge Synthesis and Clinical Trials foundation. His wife is an employee of Unilever Canada. VV holds a research grant from CDA for study of dietary intervention including viscous, soluble fibre and holds the Canadian (2,410,556) and American (7,326,404) patent on medical use of viscous fibre blend for reducing blood glucose for treatment of diabetes, increasing insulin sensitivity, reduction of systolic blood pressure and blood lipids. The other authors have no conflicts of interest related to this manuscript.
Supplemental Digital Content is available for this article.
References
- [1].Dworatzek PD, Arcudi K, Gougeon R, et al. Nutrition therapy. Can J Diabetes 2013;37(suppl 1):S45–55. [DOI] [PubMed] [Google Scholar]
- [2].Fox CS, Golden SH, Anderson C, et al. Update on prevention of cardiovascular disease in adults with type 2 diabetes mellitus in light of recent evidence: a scientific statement from the American Heart Association and the American Diabetes Association. Circulation 2015;132:691–718. [DOI] [PMC free article] [PubMed] [Google Scholar]
- [3].Mozaffarian D, Micha R, Wallace S. Effects on coronary heart disease of increasing polyunsaturated fat in place of saturated fat: a systematic review and meta-analysis of randomized controlled trials. PLoS Med 2010;7:e1000252. [DOI] [PMC free article] [PubMed] [Google Scholar]
- [4].Polyunsaturated Fats. Healthy Eating September 2016; American Heart Association. Available at: http://www.heart.org/HEARTORG/HealthyLiving/HealthyEating/Nutrition/Polyunsaturated-Fats_UCM_301461_Article.jsp#.WCTR7dQrLcs. Accessed June 2016. [Google Scholar]
- [5].Polyunsaturated Fatty Acids (N-6 PUFA). Section 3: Fatty Acids And Cholesterol; Question 4. 2010 Dietary Guidelines Advisory Committee (DGAC) NEL Systematic Reviews; 2010. Available at: https://www.cnpp.usda.gov/sites/default/files/dietary_guidelines_for_americans/2010DGACReport-camera-ready-Jan11-11.pdf. [Google Scholar]
- [6].McEwen B, Morel-Kopp MC, Tofler G, et al. Effect of omega-3 fish oil on cardiovascular risk in diabetes. Diabetes Educator 2010;36:565–84. [DOI] [PubMed] [Google Scholar]
- [7].Mostad IL, Bjerve KS, Bjorgaas MR, et al. Effects of n-3 fatty acids in subjects with type 2 diabetes: reduction of insulin sensitivity and time-dependent alteration from carbohydrate to fat oxidation. Am J Clin Nutr 2006;84:540–50. [DOI] [PubMed] [Google Scholar]
- [8].Brostow DP, Odegaard AO, Koh WP, et al. Omega-3 fatty acids and incident type 2 diabetes: the Singapore Chinese Health Study. Am J Clin Nutr 2011;94:520–6. [DOI] [PMC free article] [PubMed] [Google Scholar]
- [9].Wu JH, Micha R, Imamura F, et al. Omega-3 fatty acids and incident type 2 diabetes: a systematic review and meta-analysis. Brit J Nutr 2012;107(suppl 2):S214–27. [DOI] [PMC free article] [PubMed] [Google Scholar]
- [10].Jenkins DJ, Sievenpiper JL, Pauly D, et al. Are dietary recommendations for the use of fish oils sustainable? CMAJ 2009;180:633–7. [DOI] [PMC free article] [PubMed] [Google Scholar]
- [11].Kris-Etherton PM, Harris WS, Appel LJ. Fish consumption, fish oil, omega-3 fatty acids, and cardiovascular disease. Circulation 2002;106:2747–57. [DOI] [PubMed] [Google Scholar]
- [12].Kelley DS, Vemuri M, Adkins Y, et al. Flaxseed oil prevents trans-10, cis-12-conjugated linoleic acid-induced insulin resistance in mice. Brit J Nutr 2009;101:701–8. [DOI] [PubMed] [Google Scholar]
- [13].Ibrahim A, Natarajan S. Ghafoorunissa. Substituting dietary linoleic acid with alpha-linolenic acid improves insulin sensitivity in sucrose fed rats. Biochim Biophys Acta 2005;1733:67–75. [DOI] [PubMed] [Google Scholar]
- [14].Adachi T, Yanaka H, Kanai H, et al. Administration of perilla oil coated with Calshell increases glucagon-like peptide secretion. Biol Pharm Bull 2008;31:1021–3. [DOI] [PubMed] [Google Scholar]
- [15].Adachi T, Tanaka T, Takemoto K, et al. Free fatty acids administered into the colon promote the secretion of glucagon-like peptide-1 and insulin. Biochem Biophys Res Commun 2006;340:332–7. [DOI] [PubMed] [Google Scholar]
- [16].Opara EC, Hubbard VS, Burch WM, et al. Characterization of the insulinotropic potency of polyunsaturated fatty acids. Endocrinology 1992;130:657–62. [DOI] [PubMed] [Google Scholar]
- [17].Xiong Y, Swaminath G, Cao Q, et al. Activation of FFA1 mediates GLP-1 secretion in mice. Evidence for allosterism at FFA1. Mol Cell Endocrinol 2013;369:119–29. [DOI] [PubMed] [Google Scholar]
- [18].Poudyal H, Panchal SK, Ward LC, et al. Effects of ALA, EPA and DHA in high-carbohydrate, high-fat diet-induced metabolic syndrome in rats. J Nutr Biochem 2013;24:1041–52. [DOI] [PubMed] [Google Scholar]
- [19].Akinkuolie AO, Ngwa JS, Meigs JB, et al. Omega-3 polyunsaturated fatty acid and insulin sensitivity: a meta-analysis of randomized controlled trials. Clin Nutr (Edinburgh, Scotland) 2011;30:702–7. [DOI] [PMC free article] [PubMed] [Google Scholar]
- [20].Egert S, Fobker M, Andersen G, et al. Effects of dietary alpha-linolenic acid, eicosapentaenoic acid or docosahexaenoic acid on parameters of glucose metabolism in healthy volunteers. Ann Nutr Metab 2008;53:182–7. [DOI] [PubMed] [Google Scholar]
- [21].Wendland E, Farmer A, Glasziou P, et al. Effect of alpha linolenic acid on cardiovascular risk markers: a systematic review. Heart (British Cardiac Society) 2006;92:166–9. [DOI] [PMC free article] [PubMed] [Google Scholar]
- [22].Barre DE. The role of consumption of alpha-linolenic, eicosapentaenoic and docosahexaenoic acids in human metabolic syndrome and type 2 diabetes—a mini-review. J Oleo Sci 2007;56:319–25. [DOI] [PubMed] [Google Scholar]
- [23].Hartweg J, Perera R, Montori V, et al. Omega-3 polyunsaturated fatty acids (PUFA) for type 2 diabetes mellitus. Cochrane Database Syst Rev 2008. Cd003205.doi: 10.1002/14651858.CD003205.pub2. [DOI] [PMC free article] [PubMed] [Google Scholar]
- [24].Ma Y, Njike VY, Millet J, et al. Effects of walnut consumption on endothelial function in type 2 diabetic subjects: a randomized controlled crossover trial. Diabetes Care 2010;33:227–32. [DOI] [PMC free article] [PubMed] [Google Scholar]
- [25].Tapsell LC, Gillen LJ, Patch CS, et al. Including walnuts in a low-fat/modified-fat diet improves HDL cholesterol-to-total cholesterol ratios in patients with type 2 diabetes. Diabetes Care 2004;27:2777–83. [DOI] [PubMed] [Google Scholar]
- [26].Taylor CG, Noto AD, Stringer DM, et al. Dietary milled flaxseed and flaxseed oil improve N-3 fatty acid status and do not affect glycemic control in individuals with well-controlled type 2 diabetes. J Am Coll Nutr 2010;29:72–80. [DOI] [PubMed] [Google Scholar]
- [27].McManus RM, Jumpson J, Finegood DT, et al. A comparison of the effects of n-3 fatty acids from linseed oil and fish oil in well-controlled type II diabetes. Diabetes Care 1996;19:463–7. [DOI] [PubMed] [Google Scholar]
- [28].Tapsell LC, Batterham MJ, Teuss G, et al. Long-term effects of increased dietary polyunsaturated fat from walnuts on metabolic parameters in type II diabetes. Eur J Clin Nutr 2009;63:1008–15. [DOI] [PubMed] [Google Scholar]
- [29].Gomes PM, Hollanda-Miranda WR, Beraldo RA, et al. Supplementation of alpha-linolenic acid improves serum adiponectin levels and insulin sensitivity in patients with type 2 diabetes. Nutrition (Burbank, Los Angeles County, CA) 2015;31:853–7. [DOI] [PubMed] [Google Scholar]
- [30].Vuksan V, Whitham D, Sievenpiper JL, et al. Supplementation of conventional therapy with the novel grain Salba (Salvia hispanica L.) improves major and emerging cardiovascular risk factors in type 2 diabetes: results of a randomized controlled trial. Diabetes Care 2007;30:2804–10. [DOI] [PubMed] [Google Scholar]
- [31].The Cochrane Collaboration and John Wiley & Sons Ltd, Cochrane Handbook for Systematic Reviews of Interventions. 2011;http://handbook.cochrane.org/ [Google Scholar]
- [32].Moher D, Liberati A, Tetzlaff J, et al. Preferred reporting items for systematic reviews and meta-analyses: the PRISMA statement. Int J Surg (London, England) 2010;8:336–41. [DOI] [PubMed] [Google Scholar]
- [33].Foster MPP, Caterson ID, Samman S. Effects of zinc and α-linolenic acid supplementation on glycemia and lipidemia in women with type 2 diabetes mellitus: a randomized, double-blind, placebo-controlled trial. J Diabetes Res Clin Metab 2013;2:3. [Google Scholar]
- [34].Foster M, Chu A, Petocz P, et al. Zinc transporter gene expression and glycemic control in post-menopausal women with type 2 diabetes mellitus. J Trace Elem Med Biology 2014;28:448–52. [DOI] [PubMed] [Google Scholar]
- [35].Armbruster DA. Fructosamine: structure, analysis, and clinical usefulness. Clin Chem 1987;33:2153–63. [PubMed] [Google Scholar]
- [36].Juraschek SP, Steffes MW, Miller ER, 3rd, et al. Alternative markers of hyperglycemia and risk of diabetes. Diabetes Care 2012;35:2265–70. [DOI] [PMC free article] [PubMed] [Google Scholar]
- [37].Goldstein DE, Little RR, Lorenz RA, et al. Tests of glycemia in diabetes. Diabetes Care 2004;27:1761–73. [DOI] [PubMed] [Google Scholar]
- [38].Heyland DK, Novak F, Drover JW, et al. Should immunonutrition become routine in critically ill patients? A systematic review of the evidence. JAMA 2001;286:944–53. [DOI] [PubMed] [Google Scholar]
- [39].Elbourne DR, Altman DG, Higgins JP, et al. Meta-analyses involving cross-over trials: methodological issues. Int J Epidemiol 2002;31:140–9. [DOI] [PubMed] [Google Scholar]
- [40].Weinhandl ED, Duval S. Generalization of trim and fill for application in meta-regression. Res Synthesis Meth 2012;3:51–67. [DOI] [PubMed] [Google Scholar]
- [41].Borenstein MHL, Higgins JPT, Rothstein HR. Introduction to Meta-Analysis. UK: John Wiley & Sons, Ltd; 2009. [Google Scholar]
- [42].Moghaddam AS, Entezari MH, Iraj B, et al. The effects of consumption of bread fortified with soy bean flour on metabolic profile in type 2 diabetic women: a cross-over randomized controlled clinical trial. Int J Prev Med 2014;5:1529–36. [PMC free article] [PubMed] [Google Scholar]
- [43].Balk EM, Lichtenstein AH, Chung M, et al. Effects of omega-3 fatty acids on serum markers of cardiovascular disease risk: a systematic review. Atherosclerosis 2006;189:19–30. [DOI] [PubMed] [Google Scholar]
- [44].Singh RB, Dubnov G, Niaz MA, et al. Effect of an Indo-Mediterranean diet on progression of coronary artery disease in high risk patients (Indo-Mediterranean Diet Heart Study): a randomised single-blind trial. Lancet (London, England) 2002;360:1455–61. [DOI] [PubMed] [Google Scholar]
- [45].Finnegan YE, Minihane AM, Leigh-Firbank EC, et al. Plant- and marine-derived n-3 polyunsaturated fatty acids have differential effects on fasting and postprandial blood lipid concentrations and on the susceptibility of LDL to oxidative modification in moderately hyperlipidemic subjects. Am J Clin Nutr 2003;77:783–95. [DOI] [PubMed] [Google Scholar]
- [46].Bhaswant M, Poudyal H, Brown L. Mechanisms of enhanced insulin secretion and sensitivity with n-3 unsaturated fatty acids. J Nutr Biochem 2015;26:571–84. [DOI] [PubMed] [Google Scholar]
- [47].Leonardini A, Laviola L, Perrini S, et al. Cross-talk between PPARgamma and insulin signaling and modulation of insulin sensitivity. PPAR Res 2009;2009:818945. [DOI] [PMC free article] [PubMed] [Google Scholar]
- [48].Arterburn LM, Hall EB, Oken H. Distribution, interconversion, and dose response of n-3 fatty acids in humans. Am J Clin Nutr 2006;83(6 suppl):1467s–76s. [DOI] [PubMed] [Google Scholar]
- [49].Gerster H. Can adults adequately convert alpha-linolenic acid (18:3n-3) to eicosapentaenoic acid (20:5n-3) and docosahexaenoic acid (22:6n-3)? Int J Vitamin Nutr Res 1998;68:159–73. [PubMed] [Google Scholar]
- [50].Kim KB, Nam YA, Kim HS, et al. Alpha-linolenic acid: nutraceutical, pharmacological and toxicological evaluation. Food Chem Toxicol 2014;70:163–78. [DOI] [PubMed] [Google Scholar]
- [51].Chen C, Yu X, Shao S. Effects of omega-3 fatty acid supplementation on glucose control and lipid levels in type 2 diabetes: a meta-analysis. PloS One 2015;10:e0139565. [DOI] [PMC free article] [PubMed] [Google Scholar]
- [52].Rodriguez-Leyva D, Dupasquier CM, McCullough R, et al. The cardiovascular effects of flaxseed and its omega-3 fatty acid, alpha-linolenic acid. Can J Cardiol 2010;26:489–96. [DOI] [PMC free article] [PubMed] [Google Scholar]
- [53].Simopoulos AP. An increase in the omega-6/omega-3 fatty acid ratio increases the risk for obesity. Nutrients 2016;8:128. [DOI] [PMC free article] [PubMed] [Google Scholar]
- [54].Brouwer IA, Katan MB, Zock PL. Dietary alpha-linolenic acid is associated with reduced risk of fatal coronary heart disease, but increased prostate cancer risk: a meta-analysis. J Nutr 2004;134:919–22. [DOI] [PubMed] [Google Scholar]
- [55].Carleton AJ, Sievenpiper JL, de Souza R, et al. Case-control and prospective studies of dietary alpha-linolenic acid intake and prostate cancer risk: a meta-analysis. BMJ Open 2013;3:pii: e002280. [DOI] [PMC free article] [PubMed] [Google Scholar]
- [56].Sievenpiper JL, Dworatzek PD. Food and dietary pattern-based recommendations: an emerging approach to clinical practice guidelines for nutrition therapy in diabetes. Can J Diabetes 2013;37:51–7. [DOI] [PubMed] [Google Scholar]
Associated Data
This section collects any data citations, data availability statements, or supplementary materials included in this article.