Abstract
The aim of this study was to compare the value of superb microvascular imaging (SMI) in carpal tunnel syndrome (CTS) with that of color Doppler ultrasonography (CDUS) and power Doppler ultrasonography (PDUS).
Fifty patients with symptomatic CTS and 25 healthy volunteers were enrolled. The cross-sectional area (CSA), CDUS score, PDUS score, and SMI score of the median nerve (MN) at the carpal tunnel were recorded. The value of different ultrasonography (US) diagnostic strategies was calculated.
The blood flow display ratio in the MN of the healthy volunteers had no statistical difference between CDUS, PDUS, and SMI (20%, 32%, and 48%, respectively, P >.05). The blood flow display ratio for SMI in patients was significantly higher than that of CDUS and PDUS (90%, 52%, and 60%, respectively, P <.005). The accuracy of SMI score ≥2 (79%) was much higher than that of CDUS and PDUS (61% and 63%, respectively, P <.05). Comprehensive consideration of SMI and CSA, CSA≥10.5 mm2, and/or SMI score ≥2 has the highest accuracy (83%), significantly higher than that of CSA combination with CDUS or PDUS (68% and 69%, respectively, P <.05).
SMI is more sensitive to display the blood flow in the MN with CTS than CDUS and PDUS. It might significantly improve the diagnosis value for CTS.
Keywords: carpal tunnel syndrome, median nerve, musculoskeletal, peripheral neuropathies, ultrasonography
1. Introduction
Carpal tunnel syndrome (CTS) is a common peripheral entrapment neuropathy, that is, the median nerve (MN) is pressured at the carpal tunnel which causes symptom related to nerve damage.[1,2] The diagnosis of CTS relies on symptom, physical sign and electrodiagnostic testing (EDT).[3] However, some diseases, such as polyneuropathy and cervical radiculopathy, can also have similar clinical performance.[4–6] Physical examinations, Tinel testing and Phalen testing for example, lack objective judgment criterion. EDT can provide objective diagnosis basis, which has very high specificity. However, it will cause 10% to 25% false negative, especially for early CTS.[7,8] Furthermore, some people refuse or couldn’t tolerate it because of its invasive nature.
High-frequency grey scale ultrasonography (US) can clearly show the MN and surrounding structures, which provides valuable information for clinical treatment. Generally, an increased nerve cross-sectional area (CSA) is the main objective criterion for diagnosis CTS on US. However, the cut-off value for CSA differs from 8.5 to 15 mm2 in different studies.[9–12] The uncertainty of the diagnosis criterion affects its value. In addition, research found that the sensitivity was low for diagnosis replying on CSA alone.[13] Some other criterions derived from CSA, such as the difference or ratio of MN at wrist and forearm showing higher sensitivities, were described only in few researches[14,15] and haven’t been used in clinical practice.
The MN is provided by a rich anastomotic system of epineural and endoneural blood vessels, which extends vertically from epineuria to fascicular.[16] An animal model of entrapment neuropathy has shown an increased production of vascular endothelial growth factor, which indicates the increasing of intranerval microvascular density.[17] Some researchers evaluated the accuracy of color Doppler US (CDUS) and power Doppler US (PDUS) in the diagnosis of CTS, but came to different and even contradictory results.[13,18–20] The patients enrolled in these studies had different characteristics may be partially responsible for the disagreement. However, the more important reason may be that these Doppler technologies have low sensitivity for the blood flow. Therefore, they cannot show small, low speed blood flow signals.[21] Contrast-enhanced ultrasound can improve the display effect, but ultrasound contrast agents need injecting. Presently, there is only 1 study about contrast-enhanced ultrasound of the MN on Macaca fascicularis,[22] human study has not yet been reported.
Superb microvascular imaging (SMI) is a latest ultrasound technology to display blood flow signals in real time, developed by Toshiba. It uses self-adaptive algorithm and can differentiate low-speed blood flow signal and tissue motion artifact. Comparing to traditional Doppler technique, SMI was reported to have higher sensitivity for blood flow than CDUS and PDUS in some small organs.[23–26] But, to the best of our knowledge, the value of SMI in detecting intranerval blood flow has not yet been investigated. The purpose of this research is to evaluate the appearance of SMI of the MN in healthy volunteers and patients with CTS and to compare the diagnostic value of SMI with CDUS and PDUS.
2. Materials and methods
This research was approved by the hospital ethics committee and written consent was obtained from all participants.
All subjects were examined in the sitting position with their hands in a supine position and fingers semiextended. We used an Aplio 500 ultrasound machine (Toshiba, Tokyo, Japan) with an 18 MHz linear-array probe. Continuous transverse and longitudinal scan for the MN was performed. We applied the model of musculoskeletal. In the grayscale mode, frame rate: 6, aplipure: 5, precision: 3, frequency: diff T18.0. Focus was set at the level of the MN. Gray gain was adjusted to 80 to 90 to optimize the image brightness. CSA of the MN was determined by tracing a continuous line including the epineurium on a transverse scan at the distal wrist crease, that is, proximal to the retinaculum, where was usually the most swollen part of the MN in CTS. The average value of the results of 3 times was adopted.
Then we performed CDUS, PDUS, and SMI. We adjusted the PRF to a low level for the detection of low-flow vessels, usually the number at the upper left corner of the image was displayed as 4.7 (in CDUS and PDUS modes) and 1.9 (in SMI mode). In the CDUS and PDUS mode, the PRF couldn’t be adjusted as low as in SMI model, otherwise there would be an artifact from the organization movement caused by arterial pulsation. This experience has been obtained in previous work. The color gain was adjusted to the maximum level, usually from 35 to 45, which did not produce clutter or noisy artifact.
We evaluated a blood flow score from 0 to 3, according to the richness of the blood flow signal within the MN in a longitudinal scan. Figure 1 shows the detailed criterion in SMI: 0 score, no blood flow; 1 score, 1 to 2 spot blood flow; 2 score, more than 2 spot blood flow or 1 to 2 strip blood flow (longer than 1 mm); and 3 score, more than 2 strip blood flow. The scoring criteria of the CDUS, PDUS, and SMI modes were the same. Each wrist US examination lasted about 6 minutes.
Figure 1.
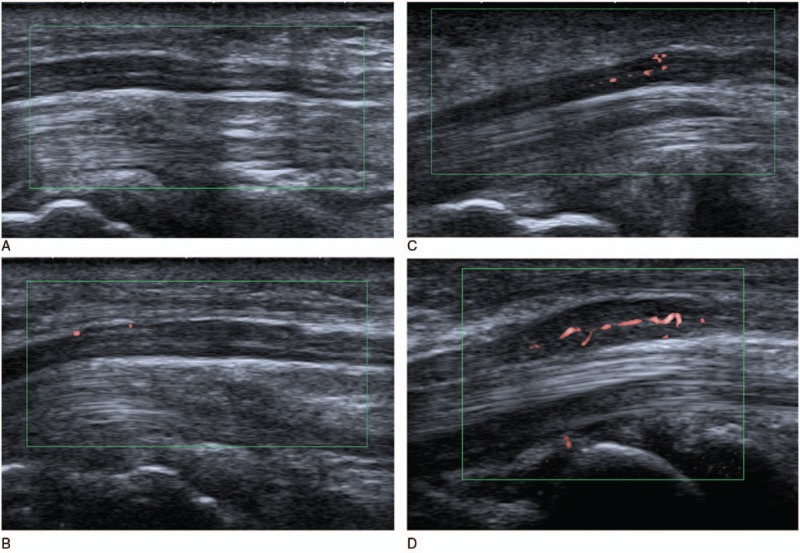
SMI score for the MN. (A) 0 score, no blood flow detected within MN; (B) 1 score, 2 spot blood flow within MN; (C) 2 score, more than 2 spot blood flow within MN; (D) 3 score, more than 2 strip blood flow within MN. MN = median nerve, SMI = superb microvascular imaging.
We conducted a preliminary study of 20 clinically diagnosed CTS patients to evaluate the interobserver reliability for the blood flow score between 2 radiologists. Observer A (JC) and observer B (LC) had 5 and 2 years of experience in musculoskeletal ultrasound, respectively. All the patients had the characteristic clinical symptoms, such as numbness for median nerve dominant finger and emission pain. Positive results for Tinel or Phalen testing and EDT increased the diagnostic performance. EDT diagnostic criteria in our hospital were as follows: motor latencies >4.0 ms, amplitudes <6.3 uv, sensory latencies >3.5 ms, amplitudes <20.0 uv, and motor conduction velocity <55 m/s. Patients with metabolic disease such as diabetes and chronic renal failure, a history of wrist trauma, rheumatism, a bifid median nerve or persistent median artery, a history of previous wrist surgery, and any symptoms of cervical radiculopathy were excluded.
Then the clinical research including patient group and control group was performed prospectively in our institution. Inclusion and exclusion criteria for the patient group were the same as the preliminary study. The control group was made up of asymptomatic healthy volunteers. All US examinations were performed by radiologist (JC) between October 2015 and February 2016. Time interval between US and EDT was 2 to 7 days (mean 4 days) without any treatment. There was no any adverse event from our experiment.
Totally, there were consecutive 79 participants in the clinical research. Some studies suggested that anatomical variations may be prone to CTS,[27,28] so, 3 patients with bifid median nerve and 1 healthy volunteer with persistent median artery were excluded from the statistics (Fig. 2). There were 50 cases in the patient group. One symptomatic wrist was observed in each case. If both sides had symptom, the more severe side was observed. If both sides had similar severity, dominant side was observed. In the control group, 25 dominant hands were observed. The radiologist was blinded to the medical history of the participants.
Figure 2.
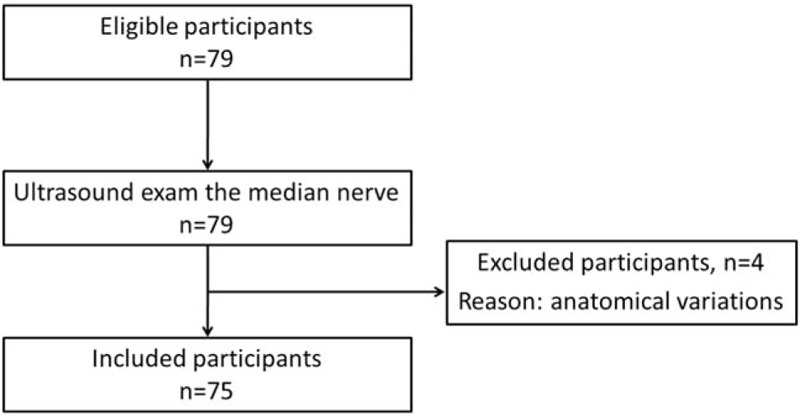
Flowchart of participants selection.
2.1. Statistical analysis
Statistical analysis was performed using SPSS software (version 18.0, SPSS Inc. Chicago, IL). Differences were analyzed using the Student t-test, and χ2 test. P <.05 was considered to indicate a significant difference. Interobserver agreement of blood flow score for each sonographic technique was assessed using kappa statistics. The receiver operating characteristic (ROC) curve was used to determine the cutoff value for the CSA of MN. The sensitivity, specificity, likelihood ratio (LR), and accuracy have been calculated with 95% confidence interval (CI).
3. Results
The interobserver reliability was estimated according to the preliminary study, and the results showed a good level of agreement. Kappa coefficients for CDUS, PDUS, and SMI were 0.779, 0.716, and 0.846, respectively.
The common clinical data of the participants are shown in Table 1. There were no significant different for age, sex, and body mass index (BMI) between patient group and control group. The CSA of the MN at the distal wrist crease was significantly larger in patient group than that of control group (mean 12.16 mm2 vs mean 9.16 mm2, P <.001).
Table 1.
Clinical characteristics of patient group and control group.
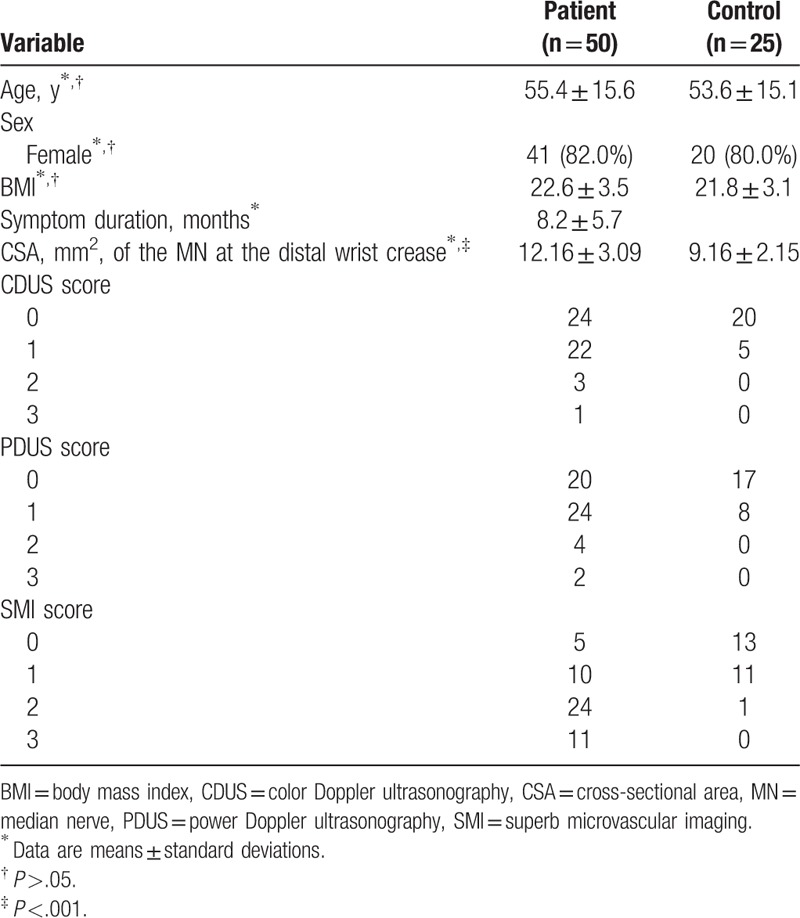
In patient group, the blood flow display ratio of CDUS (26/50, 52%) in the MN was not significantly different when compared to that of PDUS (30/50, 60%). The blood flow display ratio of SMI (45/50, 90%) was significantly higher than that of CDUS and PDUS (P <.005) (Fig. 3). In control group, the blood flow display ratio of CDUS, PDUS, and SMI were 20%, 32%, and 48%, respectively, without statistical significance (P >.05).
Figure 3.
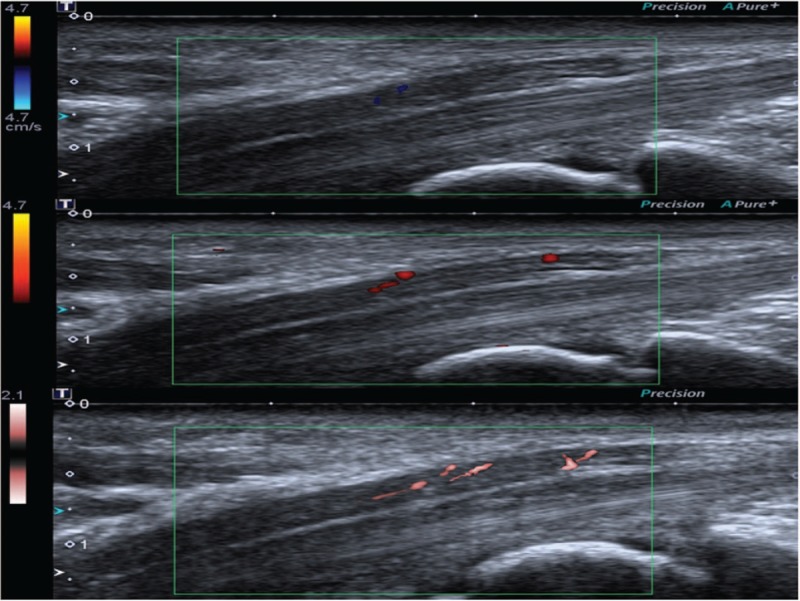
Ultrasound images of the MN at the same level from a 65-year-old female CTS patient, which shows score 1 by CDUS, score 2 by PDUS, and score 3 by SMI. CDUS = color Doppler ultrasonography, CTS = carpal tunnel syndrome, PDUS = power Doppler ultrasonography, SMI = superb microvascular imaging.
Figure 4 shows the ROC curve of the MN's CSA at the distal wrist crease. The cut-off value of the CSA was 10.5 mm2 with a sensitivity of 64%, a specificity of 76%, and an area under the ROC curve of 0.78 (95% CI: 0.68 to 0.89).
Figure 4.
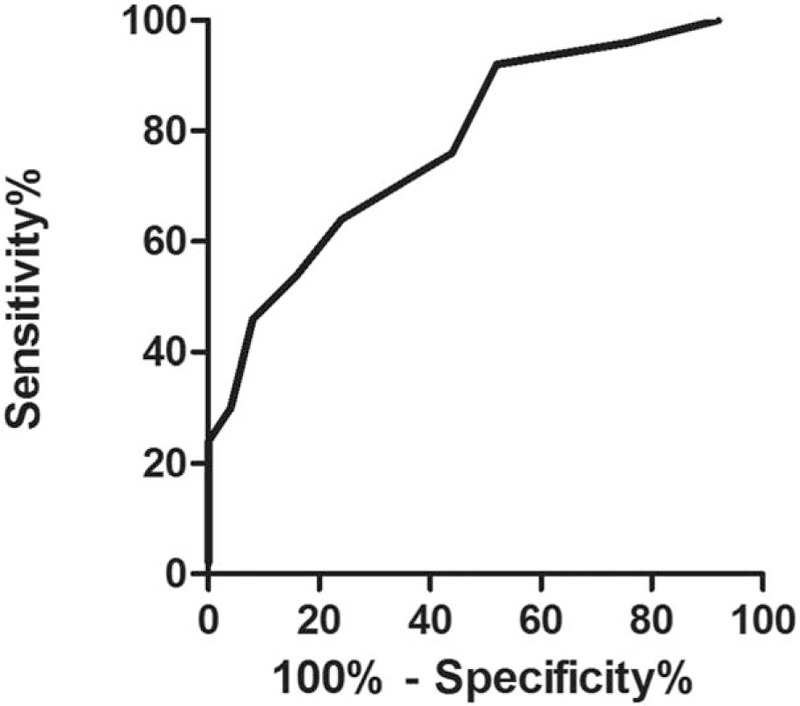
ROC curve of CSA at the distal wrist crease. CSA = cross-sectional area, ROC = receiver operating characteristic.
The positive rate of different US diagnostic criteria in patient group and control group is shown in Table 2. The sensitivity, specificity, LR, and accuracy of different US diagnostic criteria for CTS are shown in Table 3.
Table 2.
Positive rate of different US diagnostic criteria in patient group (n = 50) and control group (n = 25).
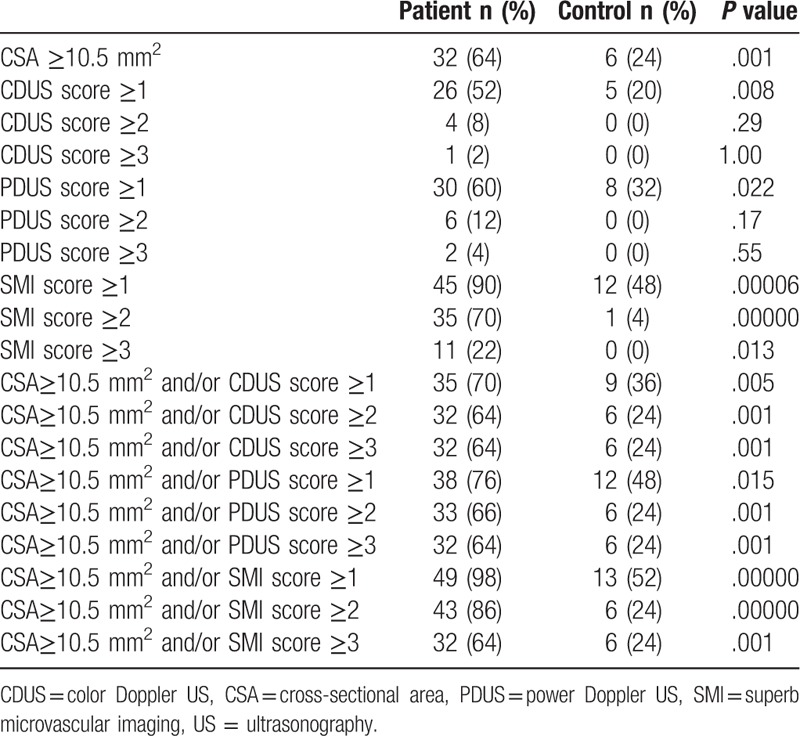
Table 3.
Sensitivity, specificity, LR, and accuracy of different US diagnostic criteria for CTS.
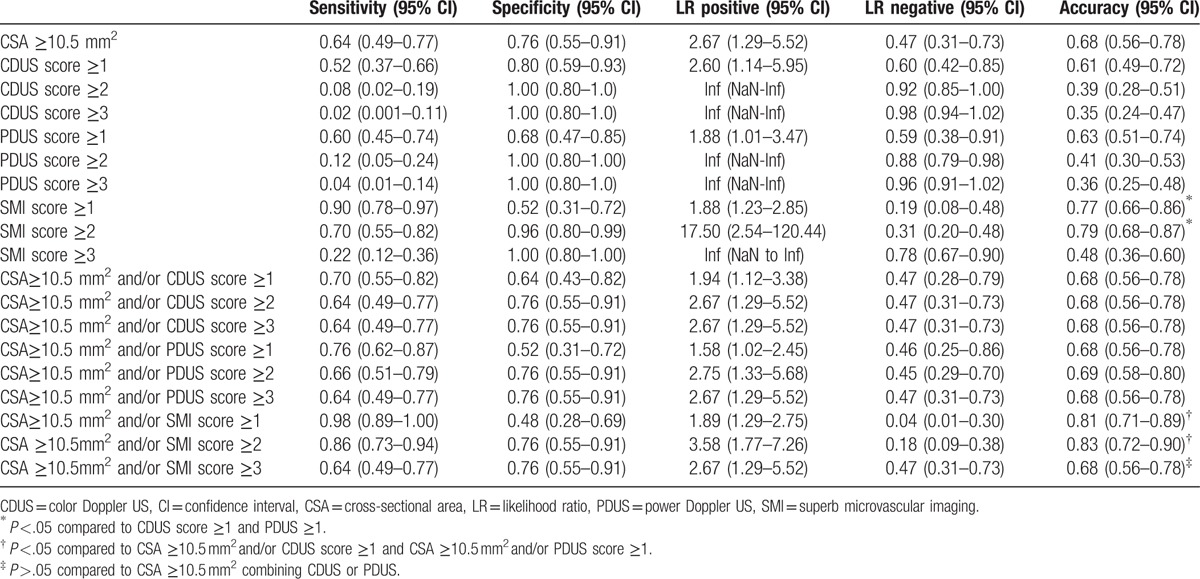
If SMI ≥3 or CDUS/PDUS ≥2/3 were considered as the diagnostic criteria, the sensitivity and accuracy were low, varying 0.02 to 0.22 and 0.35 to 0.48, respectively. Of all the other US diagnostic strategies, CSA ≥10.5 mm2 and/or SMI ≥1 and SMI ≥1 had the highest sensitivity (98% and 90%, respectively). SMI ≥2 had the highest specificity (96%). While CSA ≥10.5 mm2 and/or SMI ≥2 and CSA ≥10.5 mm2 and/or SMI ≥1 had the highest accuracy (83% and 81%, respectively). The accuracy of SMI score ≥1 and SMI score ≥2 (77% and 79%, respectively) was higher than the highest accuracy of CDUS and PDUS (61% and 63%, P <.05). The accuracy of CSA ≥10.5 mm2 and/or SMI score ≥1 and CSA ≥10.5 mm2 and/or SMI score ≥2 (81% and 83%, respectively) was higher than the highest accuracy of CSA ≥10.5 mm2 combination with CDUS or PDUS (68% and 69%, respectively, P <.05). The accuracy of CSA ≥10.5 mm2 and/or SMI ≥3 (68%) was not significantly higher than that of CSA ≥10.5 mm2 combining with CDUS or PDUS (68% and 69%, respectively, P >.05).
4. Discussion
The diagnosis of CTS mainly relies on clinic symptoms and EDT. Due to the lack of specificity of symptoms and 10% to 25% false negative rate of EDT,[7,8] the quality stands Subcommittee of the American Academy of Neurology has recommended using US as one of the diagnosis tools since 1990s.[29] The increasement of the MN's CSA is the classic standard of gray US. This is caused by an increase in the pressure of the nerve which causes venous congestion and a limited axoplasm flow of the nerve. Prior studies have shown that the CSA's cut-off value varies a lot. The common cut-off value was 10 to 11 mm2 with a sensitivity of 57% to 97% and specificity of 65% to 97%,[11,30–33] In our study, the CSA cut-off value was 10.5 mm2, the sensitivity was 64%, and the specificity was 76%, which was similar to the previous reports.
In addition to grayscale US, Doppler US showed the blood flow signal in the MN of the CTS increased when compared to healthy people. The increase of the microvessel density in the MN of CTS was confirmed by pathology.[17] Schwann cell production of vascular endothelial growth factor is responsible for the increased vascularity and Schwann cell proliferation associated with chronic nerve compression. However, the diagnostic value of Doppler technique reported in the literatures was not consistent, which affected the confidence of clinicians. Ghasemi-Esfe et al[20] reported that color Doppler had the higher diagnosis value with a sensitivity of 81% and a specificity of 90%, comparing with CSA (69% and 94%, respectively). Joy et al's[13] research suggested that Doppler had higher sensitivity than CSA, especially for those patients with unidentified clinic symptoms, the sensitivity increased from 30% to 73%. However, Dejaco et al[34] reported that Doppler's sensitivity (47.4%) was lower than that of grayscale US (90.9%). Ultrasound machine has 2 kinds of Doppler technologies, that is, color Doppler and power Doppler. Generally, power Doppler is considered to be more sensitive to display blood flow signals within the tissue. However, to our knowledge, 2 researches using power Doppler to diagnose CTS had lower sensitivity comparing to the other 3 researches using color Doppler (0.48, 0.41 vs 0.80, 0.83, 0.95).[18,20,34–36] The reasons for the distinction include the difference of inclusion criteria, severity, judgment criterion of imaging, device, and parameters. Another possibility is that the Doppler technique itself is insufficient to detect the blood flow in the nerve. One research showed that the blood flow display ratio was 0% (0/33) in normal MN.[35] In the study of the correlation between color Doppler and CTS severity, Mohammadi et al[37] found that the blood flow display ratio was only 54.4% (49/90) even in CTS patients. Most experiments also only determined whether there was blood flow signal in the compressed nerve,[13,18,35,37] only 1 previous research studied power Doppler score in CTS, which got a sensitivity of 47.4%, using score ≥2 to diagnose CTS.[34] There was less experience of intranerval blood flow than rheumatoid synovitis.[38,39] The main reason is that the blood flow of nerve is more small and slow.
In our control group, the blood flow display ratio of CDUS, PDUS, and SMI had no statistical difference (P >.05), but with a trend of increasing (20%, 32%, and 48%, respectively). In patient group, the blood flow display ratio of SMI was 90%, higher than that of CDUD and PDUS (52% and 60%, respectively), with statistical difference (P <.005). CDUS and PDUS score mainly focused on 0 and 1, only 5 and 8 cases scored 2 and 3, respectively. CDUS or PDUS ≥2 or 3 had low sensitivity, which was not suitable for diagnosis criterion. SMI significantly increased the results of 2 and 3 score, the SMI score distribution was more balanced. The accuracies for CDUS ≥1 and PDUS ≥1 were 61% and 63%, respectively, similarly to that of CSA ≥10.5 mm2 (68%). If combining CSA ≥10.5 mm2 and CDUS or PDUS ≥1, there was an insignificant but important increase in sensitivity (from 64% to 70% or 76%, respectively), even though the accuracy was not improved.
To the best of our knowledge, there was no report of SMI in CTS. We analyzed the diagnosis results using different SMI criteria. SMI score ≥2 achieved the highest accuracy (79%) and gave consideration to both sensitivity (70%) and specificity (96%). At the same time, its positive LR (=sensitivity/1-specificity) reached 17.5. SMI score ≥1 had the highest sensitivity (90%) but the accuracy (77%) was slightly down. SMI score ≥3 had the highest specificity (100%), but the sensitivity was too low (22%). Due to the convenient, noninvasive characteristics of US, SMI score ≥3 is not suitable as a diagnostic standard for screening tests.[40] If we combined SMI and CSA, CSA ≥10.5 mm2 and/or SMI score ≥2 had the highest accuracy (83%), which was significantly higher than that of CSA ≥10.5 mm2 and/or CDUS ≥1 or CSA ≥10.5 mm2 and/or PDUS ≥1 (68% and 68%, respectively).
SMI is a new imaging mode to detect blood flow developed by Toshiba Medical Systems. Employing an advanced Doppler algorithm with a new level of sensitivity and frame rate for imaging of the microvasculature, there will be no need for contrast enhancement. When compared with conventional color Doppler and power Doppler, the sensitivity and finer detail of the microvessels can be visualized with SMI appears significantly better. The ability of SMI to scan at high frame rates is important. The potential clinical value of this advanced technology and how it could significantly change clinical management were illustrated in several researches.[23–26] In our study, SMI provided improved results for the evaluation of the blood flow in the MN compared to the CDUS and PDUS. SMI technology has already been included in the commercial machine.
Our study had several limitations. First, the intranerval blood flow distributes in 3 dimensions, but we only analyzed the blood signal on a longitudinal plane, which didn’t reflect the overall intranerval blood supply. Three-dimensional ultrasound technology can reveal the complete intranerval blood distribution. Second, the judgment of SMI score was semiquantitative, even though good agreement among the observers was also observed, it still lacked objective data. Using software to analyze the ratio of color blood pixel can improve this. Third, all patients were diagnosed by symptoms, physical signs, and EDT results. We excluded those who had no symptoms, or those mild patients who had normal EDT results, which may overestimate the sensitivity in this research. Forth, SMI technology is presently only installed in some models of Toshiba equipment, not all ultrasonic instruments have this function. But such instruments have been commercially available, and the price is similar to that of conventional instruments.
This is the initial result for SMI in CTS. This technique shows better display capability for blood flow signal in the MN than CDUS and PDUS. This indicates that SMI may be a useful tool for diagnose CTS. However, it still needs more large series of studies. Further researches are necessary to access the relationship between richness of blood flow of SMI and length of medical history, disease severity, and EDT result.
Footnotes
Abbreviations: BMI = body mass index, CDUS = color Doppler US, CSA = cross-sectional area, CTS = carpal tunnel syndrome, EDT = electrodiagnostic testing, LR = likelihood ratio, MN = median nerve, PDUS = power Doppler US, ROC = receiver operating characteristic, SMI = superb microvascular imaging, US = ultrasonography.
JC and LC are the co-first authors. They contributed equally to this article.
BH and L-XJ are the co-corresponding authors. They contributed equally to this article.
Authors’ contributions: JBL, BH, and LXJ were guarantors of integrity of the entire study. JC and LC carried out the study design and manuscript editing. LW carried out the data analysis. RW participated in the design of the study and manuscript preparation. JC and RW carried out the statistical analysis. All authors read and approved the final manuscript.
Funding: This work was financially supported by National Nature Science Foundation of China (81371574), SJTU Medicine Engineering Interdisciplinary Research Fund (YG2013MS53), Shanghai talent developing fund (201452), and Experimental Animal Funding of Shanghai Science and Technology Commission (15140901400).
The authors have no conflicts of interest to disclose.
References
- [1].Aboonq MS. Pathophysiology of carpal tunnel syndrome. Neurosciences (Riyadh) 2015;20:4–9. [PMC free article] [PubMed] [Google Scholar]
- [2].Jakubowicz B, Aner M. Carpal tunnel syndrome. J Pain Palliat Care Pharmacother 2010;24:162–3. [DOI] [PubMed] [Google Scholar]
- [3].Masson PW, Michell AW. Clinical examination versus electrodiagnostic assessment of severity of median nerve pathology in carpal tunnel syndrome. J Clin Rheumatol 2016;22:45–6. [DOI] [PubMed] [Google Scholar]
- [4].Ito E, Sonoo M, Iwanami T, et al. Can palm stimulation differentiate diabetic polyneuropathy from carpal tunnel syndrome. J Clin Neurophysiol 2014;31:169–74. [DOI] [PubMed] [Google Scholar]
- [5].Jeong DH, Kim CH. The quantitative relationship between physical examinations and the nerve conduction of the carpal tunnel syndrome in patients with and without a diabetic polyneuropathy. Ann Rehabil Med 2014;38:57–63. [DOI] [PMC free article] [PubMed] [Google Scholar]
- [6].Lo SF, Chou LW, Meng NH, et al. Clinical characteristics and electrodiagnostic features in patients with carpal tunnel syndrome, double crush syndrome, and cervical radiculopathy. Rheumatol Int 2012;32:1257–63. [DOI] [PubMed] [Google Scholar]
- [7].Roll SC, Case-Smith J, Evans KD. Diagnostic accuracy of ultrasonography vs. electromyography in carpal tunnel syndrome: a systematic review of literature. Ultrasound Med Biol 2011;37:1539–53. [DOI] [PubMed] [Google Scholar]
- [8].Jablecki CK, Andary MT, Floeter MK, et al. Practice parameter: electrodiagnostic studies in carpal tunnel syndrome. Report of the American Association of Electrodiagnostic Medicine, American Academy of Neurology, and the American Academy of Physical Medicine and Rehabilitation. Neurology 2002;58:1589–92. [DOI] [PubMed] [Google Scholar]
- [9].Descatha A, Huard L, Aubert F, et al. Meta-analysis on the performance of sonography for the diagnosis of carpal tunnel syndrome. Semin Arthritis Rheum 2012;41:914–22. [DOI] [PubMed] [Google Scholar]
- [10].Mohammadi A, Afshar A, Etemadi A, et al. Diagnostic value of cross-sectional area of median nerve in grading severity of carpal tunnel syndrome. Arch Iran Med 2010;13:516–21. [PubMed] [Google Scholar]
- [11].Klauser AS, Halpern EJ, De Zordo T, et al. Carpal tunnel syndrome assessment with US: value of additional cross-sectional area measurements of the median nerve in patients versus healthy volunteers. Radiology 2009;250:171–7. [DOI] [PubMed] [Google Scholar]
- [12].Lee D, van Holsbeeck MT, Janevski PK, et al. Diagnosis of carpal tunnel syndrome. Ultrasound versus electromyography. Radiol Clin North Am 1999;37:859–72. x. [DOI] [PubMed] [Google Scholar]
- [13].Joy V, Therimadasamy AK, Chan YC, et al. Combined Doppler and B-mode sonography in carpal tunnel syndrome. J Neurol Sci 2011;308:16–20. [DOI] [PubMed] [Google Scholar]
- [14].Klauser AS, Abd EMM, Halpern EJ, et al. Sonographic cross-sectional area measurement in carpal tunnel syndrome patients: can delta and ratio calculations predict severity compared to nerve conduction studies. Eur Radiol 2015;25:2419–27. [DOI] [PubMed] [Google Scholar]
- [15].Hobson-Webb LD, Massey JM, Juel VC, et al. The ultrasonographic wrist-to-forearm median nerve area ratio in carpal tunnel syndrome. Clin Neurophysiol 2008;119:1353–7. [DOI] [PubMed] [Google Scholar]
- [16].Mawrin C, Schutz G, Schroder JM. Correlation between the number of epineurial and endoneurial blood vessels in diseased human sural nerves. Acta Neuropathol 2001;102:364–72. [DOI] [PubMed] [Google Scholar]
- [17].Gupta R, Gray M, Chao T, et al. Schwann cells upregulate vascular endothelial growth factor secondary to chronic nerve compression injury. Muscle Nerve 2005;31:452–60. [DOI] [PubMed] [Google Scholar]
- [18].Ghasemi-Esfe AR, Khalilzadeh O, Mazloumi M, et al. Combination of high-resolution and color Doppler ultrasound in diagnosis of carpal tunnel syndrome. Acta Radiol 2011;52:191–7. [DOI] [PubMed] [Google Scholar]
- [19].Vanderschueren GA, Meys VE, Beekman R. Doppler sonography for the diagnosis of carpal tunnel syndrome: a critical review. Muscle Nerve 2014;50:159–63. [DOI] [PubMed] [Google Scholar]
- [20].Ghasemi-Esfe AR, Khalilzadeh O, Vaziri-Bozorg SM, et al. Color and power Doppler US for diagnosing carpal tunnel syndrome and determining its severity: a quantitative image processing method. Radiology 2011;261:499–506. [DOI] [PubMed] [Google Scholar]
- [21].Anderson T, McDicken WN. The difference between colour Doppler velocity imaging and power Doppler imaging. Eur J Echocardiogr 2002;3:240–4. [DOI] [PubMed] [Google Scholar]
- [22].Evans KD, Volz KR, Pargeon RL, et al. Use of contrast-enhanced sonography to investigate intraneural vascularity in a cohort of Macaca fascicularis with suspected median mononeuropathy. J Ultrasound Med 2014;33:103–9. [DOI] [PMC free article] [PubMed] [Google Scholar]
- [23].Machado P, Segal S, Lyshchik A, et al. A novel microvascular flow technique: initial results in thyroids. Ultrasound Q 2015;32:67–74. [DOI] [PubMed] [Google Scholar]
- [24].Ma Y, Li G, Li J, et al. The diagnostic value of superb microvascular imaging (SMI) in detecting blood flow signals of breast lesions: a preliminary study comparing SMI to color Doppler flow imaging. Medicine (Baltimore) 2015;94:e1502. [DOI] [PMC free article] [PubMed] [Google Scholar]
- [25].Zhan J, Diao XH, Jin JM, et al. Superb microvascular imaging—a new vascular detecting ultrasonographic technique for avascular breast masses: a preliminary study. Eur J Radiol 2016;85:915–21. [DOI] [PubMed] [Google Scholar]
- [26].Karaca L, Oral A, Kantarci M, et al. Comparison of the superb microvascular imaging technique and the color Doppler techniques for evaluating children's testicular blood flow. Eur Rev Med Pharmacol Sci 2016;20:1947–53. [PubMed] [Google Scholar]
- [27].Bagatur AE, Yalcinkaya M, Atca AO. Bifid median nerve causing carpal tunnel syndrome: MRI and surgical correlation. Orthopedics 2013;36:e451–6. [DOI] [PubMed] [Google Scholar]
- [28].Kasius KM, Claes F, Meulstee J, et al. Bifid median nerve in carpal tunnel syndrome: do we need to know. Muscle Nerve 2014;50:835–43. [DOI] [PubMed] [Google Scholar]
- [29].Practice parameter for carpal tunnel syndrome (summary statement). Report of the Quality Standards Subcommittee of the American Academy of Neurology. Neurology 1993;43:2406–9. [PubMed] [Google Scholar]
- [30].Buchberger W, Judmaier W, Birbamer G, et al. Carpal tunnel syndrome: diagnosis with high-resolution sonography. AJR Am J Roentgenol 1992;159:793–8. [DOI] [PubMed] [Google Scholar]
- [31].Ashraf AR, Jali R, Moghtaderi AR, et al. The diagnostic value of ultrasonography in patients with electrophysiologicaly confirmed carpal tunnel syndrome. Electromyogr Clin Neurophysiol 2009;49:3–8. [PubMed] [Google Scholar]
- [32].Leonard L, Rangan A, Doyle G, et al. Carpal tunnel syndrome—is high-frequency ultrasound a useful diagnostic tool. J Hand Surg Br 2003;28:77–9. [DOI] [PubMed] [Google Scholar]
- [33].Wong SM, Griffith JF, Hui AC, et al. Carpal tunnel syndrome: diagnostic usefulness of sonography. Radiology 2004;232:93–9. [DOI] [PubMed] [Google Scholar]
- [34].Dejaco C, Stradner M, Zauner D, et al. Ultrasound for diagnosis of carpal tunnel syndrome: comparison of different methods to determine median nerve volume and value of power Doppler sonography. Ann Rheum Dis 2013;72:1934–9. [DOI] [PubMed] [Google Scholar]
- [35].Akcar N, Ozkan S, Mehmetoglu O, et al. Value of power Doppler and gray-scale US in the diagnosis of carpal tunnel syndrome: contribution of cross-sectional area just before the tunnel inlet as compared with the cross-sectional area at the tunnel. Korean J Radiol 2010;11:632–9. [DOI] [PMC free article] [PubMed] [Google Scholar]
- [36].Mallouhi A, Pulzl P, Trieb T, et al. Predictors of carpal tunnel syndrome: accuracy of gray-scale and color Doppler sonography. AJR Am J Roentgenol 2006;186:1240–5. [DOI] [PubMed] [Google Scholar]
- [37].Mohammadi A, Ghasemi-Rad M, Mladkova-Suchy N, et al. Correlation between the severity of carpal tunnel syndrome and color Doppler sonography findings. AJR Am J Roentgenol 2012;198:W181–4. [DOI] [PubMed] [Google Scholar]
- [38].Zheng G, Wang L, Jia X, et al. Application of high frequency color Doppler ultrasound in the monitoring of rheumatoid arthritis treatment. Exp Ther Med 2014;8:1807–12. [DOI] [PMC free article] [PubMed] [Google Scholar]
- [39].Ellegaard K, Torp-Pedersen S, Terslev L, et al. Ultrasound colour Doppler measurements in a single joint as measure of disease activity in patients with rheumatoid arthritis—assessment of concurrent validity. Rheumatology (Oxford) 2009;48:254–7. [DOI] [PubMed] [Google Scholar]
- [40].Fowler JR, Maltenfort MG, Ilyas AM. Ultrasound as a first-line test in the diagnosis of carpal tunnel syndrome: a cost-effectiveness analysis. Clin Orthop Relat Res 2013;471:932–7. [DOI] [PMC free article] [PubMed] [Google Scholar]


