Supplemental Digital Content is available in the text
Keywords: CT, CT scanner, histogram analysis, image filtration, radiomics, texture
Abstract
Quantitative computed tomography (CT) texture analyses for images with and without filtration are gaining attention to capture the heterogeneity of tumors. The aim of this study was to investigate how quantitative texture parameters using image filtering vary among different computed tomography (CT) scanners using a phantom developed for radiomics studies.
A phantom, consisting of 10 different cartridges with various textures, was scanned under 6 different scanning protocols using four CT scanners from four different vendors. CT texture analyses were performed for both unfiltered images and filtered images (using a Laplacian of Gaussian spatial band-pass filter) featuring fine, medium, and coarse textures. Forty-five regions of interest were placed for each cartridge (x) in a specific scan image set (y), and the average of the texture values (T(x,y)) was calculated. The interquartile range (IQR) of T(x,y) among the 6 scans was calculated for a specific cartridge (IQR(x)), while the IQR of T(x,y) among the 10 cartridges was calculated for a specific scan (IQR(y)), and the median IQR(y) was then calculated for the 6 scans (as the control IQR, IQRc). The median of their quotient (IQR(x)/IQRc) among the 10 cartridges was defined as the variability index (VI).
The VI was relatively small for the mean in unfiltered images (0.011) and for standard deviation (0.020–0.044) and entropy (0.040–0.044) in filtered images. Skewness and kurtosis in filtered images featuring medium and coarse textures were relatively variable across different CT scanners, with VIs of 0.638–0.692 and 0.430–0.437, respectively.
Various quantitative CT texture parameters are robust and variable among different scanners, and the behavior of these parameters should be taken into consideration.
1. Introduction
Cancers are heterogeneous, and several cancer subtypes arise within a particular organ. Specific cancers are genetically heterogeneous,[1] and such heterogeneity causes resistance to treatment.[2] The use of medical images plays an important role in the evaluation of cancers. Information such as the size, border, shape, and texture of the tumor can be evaluated using medical images. However, many of these features, excluding size, have previously been evaluated in subjective or qualitative manners and have not been sufficient to properly capture the heterogeneity of cancers.[3] Radiomics, the process by which a large amount of quantitative information is extracted from medical images, has recently gained attention. This process is expected to offer discrimination between intratumoral or intertumoral heterogeneity and the longitudinal monitoring of tumors.[3–6]
Texture is an important feature of a tumor. Several methods are now available to analyze a tumor's texture quantitatively.[5,7] Alongside the promising aspects of quantitative assessment, attention should be paid to the issue of scanner variability in relation to the parameters, including tube voltage, tube current, pixel resolution, and etc. Although radiologists are accustomed to differences in image quality across different protocols or scanners in visual assessment, quantitative texture parameter values are affected directly by scanner variance.[4] The effect of this variability on several parameters has already been investigated for unfiltered computed tomography (CT) images. According to Mackin et al,[8] some quantitative texture parameters without filtering are susceptible to differences in scanning protocols or CT scanners. Thus, the quantification of heterogeneity must take into account the potential impact of variation in CT image acquisition parameters.[9]
Recently, studies regarding the texture based on histogram analyses in images processed with Laplacian of Gaussian filter have been reported. Some clinical studies have reported the usefulness of features in filtered images in association with the differentiation of tumor subtypes,[10–12] survival of patient with tumors,[13,14] and assessment of the efficacy of treatments on tumors.[15] Use of Laplacian of Gaussian filter is associated with image noise reduction and can improve the utility of the heterogeneity measures.[16] However, through image filtration, the degree of scanner variability in each texture parameter has not been investigated until now.
How parameters derived from histogram analyses in images with and without filtration are affected by different scanners in standard-of-care scanning protocols is indispensable for near future radiomics era. And a phantom study would be preferable for assessing these issues; because patient anatomy would change between CT scans, and several scans are associated with increased radiation exposure to patients.
In view of this, we aimed to investigate the degree to which the results of quantitative texture analysis using image filtering are affected by differences in CT scanners using a phantom with various texture features developed for the study of radiomics.
2. Materials and methods
This study investigated the variability of quantitative texture analyses among CT scanners using a phantom and did not require institutional review board approval.
2.1. Phantom
The phantom used in this study was comprised of 10 different cartridges (See Supplemental Fig. 1 which shows the positioning process of the phantom in CT scan) representing wide range of textures found in human tissues. It was created for the purpose of image texture analysis and was used in a previous study.[8] The size of each cartridge was 10.1 × 10.1 × 3.2 cm3. The 10 cartridges consisted of the following components: cartridge A, three-dimensional (3D) printed acrylonitrile butadiene styrene plastic with a fill level of 50%; cartridge B, 3D printed acrylonitrile butadiene styrene plastic with a fill level of 40%; cartridge C, 3D printed acrylonitrile butadiene styrene plastic with a fill level of 30%; cartridge D, 3D printed acrylonitrile butadiene styrene plastic with a fill level of 20%; cartridge E, a block of natural sycamore wood; cartridge F, compressed and glued rubber particles; cartridge G, natural cork; cartridge H, solid acrylic; cartridge I, dense cork; and cartridge J, 3D printed solid material made of a plaster-based power held together by resin (See Supplemental Fig. 2 which shows the images of cartridges of the phantom). A 3D printer (MakerBot Replicator 2 3D; MakerBot Industries LLC, Brooklyn, NY) (for cartridges A–D), a proprietary bonding agent (Ecoborder, Tampa, FL) (for cartridge F), and Colorbond (3D Systems, Inc., Rock Hill, SC) (for cartridge J) were used to create some of these cartridges. Further information regarding the cartridges is provided in Table 1.
Table 1.
Information regarding the cartridges.

2.2. CT image acquisition
Six CT scans were performed using 4 different CT scanners: scan T1, Aquilion ONE (Toshiba Medical Systems, Tochigi, Japan) at hospital A; scan G1, Discovery CT750 HD (GE Healthcare, Waukesha, WI) at hospital A; scans P1 and P2, Brilliance 64 (Philips Healthcare, Best, The Netherlands) at hospital B; and scans S1 and S2, SOMATOM Emotion (Siemens Healthcare, Forchheim, Germany) at hospital C. The phantom was placed such that its center was the same as the isocenter of the CT scanner and the long axis of the phantom perpendicular to the gantry (See Supplemental Fig. 1 which shows the positioning process of the phantom in CT scan). All scans were performed using a helical mode. A tube voltage of 120 kVp was used in all scans except for S1 (110 kVp) and S2 (130 kVp), because 120 kVp could not be used with this scanner. A fixed tube current was used, and the effective tube current (= (tube current) × (gantry rotation time)/(pitch)) was 115–180 mAs for all 6 scans. The tube current may not be strictly identical across the different hospitals in daily clinical practice, even if the same scanner is used. To reflect this, 2 different levels were used with the Brilliance 64 scanner: scan P1 (120 mAs) and scan P2 (160 mAs). For image reconstruction, the field of view (FOV) was set to be identical for all scans (300 mm). For the reconstruction algorithm, a filtered back projection was used for all scans. In addition, kernels for soft tissue (FC03 for scan T1, standard for scan G1, B for scans P1 and P2, and B41 s medium + for scans S1 and S2) were used for all scans. Further information regarding the scanning parameters and image reconstruction parameters for the 6 scans are provided in Table 2.
Table 2.
Scanning and reconstruction parameters for each scan.

2.3. Image analysis
The CT images were analyzed by a radiologist (K.Y., with 6 years of imaging experience) using quantitative texture analysis software (TexRAD; TexRAD Ltd., part of Feedback Plc., Cambridge, UK). Texture analyses using this software comprised two stages. First, images were processed using Laplacian of Gaussian spatial band-pass filters with different spatial scaling factors (SSFs). In this study, unfiltered images (we describe such images as having an SSF of 0 mm hereafter) and filtered images with SSFs of 2, 4, and 6 mm were included for analysis. Texture parameters in filtered images with SSFs of 2 mm, 4 mm, and 6 mm indicate fine, medium, and coarse textures, respectively. Second, histogram analyses were performed for both unfiltered and filtered images. In these analyses, the parameters of the mean, standard deviation (SD) (width of the histogram), entropy (indicator of irregularity), skewness (asymmetry of the histogram), and kurtosis (pointiness of the histogram) were measured. [9] Hereafter, we describe these parameters in images with or without filtering by adding the SSF values after the name of the parameter (e.g., the mean in unfiltered images as mean0 and entropy in filtered images with SSF of 4 mm as entropy4). We placed nine square regions of interest (ROIs) with a size of approximately 2 × 2 cm2 per single image slice. ROIs were established for five image slices per cartridge. Thus, 45 ROIs were placed for each cartridge. To ensure that the size and location of the ROIs were identical across different slices and scans, the copy and paste function was used. Measurements of the 45 ROIs were averaged to obtain texture parameters (T(x,y)) for each cartridge (x) of the phantom in a specific scan (y). For ease of understanding the following statistics, an example of data is shown in Fig. 1. To evaluate scanner variability, the interquartile range (IQR) of T(x,y) among the 6 scans (IQR(x)) was calculated for each cartridge of the phantom. IQR(x) is highly dependent on the value of T(x,y). Therefore, we used the variability of T(x,y) across the different cartridges as a control to establish the index for evaluation of scanner variability across the different types of parameters. For each scan, the IQR of T(x,y) among the 10 different cartridges (IQR(y)) was calculated, and the median value of IQR(y) for the 6 scans (using this IQR as a control, IQRc) was then calculated. The scanner variability index for a cartridge of the phantom (VI(x)) was defined by dividing IQR(x) by IQRc. The median VI(x) was calculated among the 10 cartridges and was defined as the variability index (VI) for a specific parameter.
Figure 1.
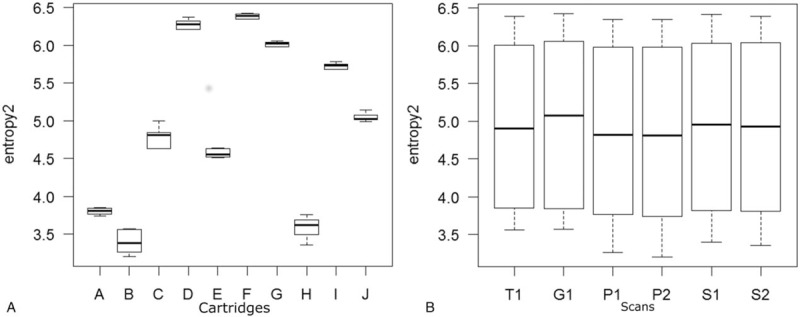
Boxplots for entropy2. (A) For each cartridge of the phantom, interquartile ranges (IQR(x)), median, and maximum/minimum values of entropy2 among 6 scans are described as a box, a thick line, and a whisker, respectively. (B) For each scan, interquartile ranges (IQR(y)), median, and maximum/minimum values of entropy2 among 10 phantoms are described as a box, a thick line, and a whisker, respectively. Median value of IQR(y) for the 6 scans (IQRc) was used as a control to calculate variability index. IQR = interquartile range.
A robust z score (R(x,y)) for T(x,y) for a specific cartridge with a specific scan was calculated as follows [17–19]:
R(x,y) = (T(x,y) – T(x))/(0.7413 × IQR(x)),
where T(x) represents the median T(x,y) among the 6 scans for a specific cartridge. The IQR(x) multiplied by 0.7413 provides a normalized IQR for T(x,y) among the 6 scans for a specific cartridge. The number of 0.7413 is derived from the fact that the 50% of the data (from the 25th percentile to the 75th percentile) exist within the range of
Mean ± 0.6745 × SD
for a data set which follows normalized distribution. Therefore, the following formula hold true for such data set:
IQR = 2 × 0.6745 × SD
⇔ SD = IQR/1.3489 = 0.7413 × IQR
Like the z score, the absolute value of R(x,y) indicates the extent to which T(x,y) differs from the median value among the different scans. Using robust z scores, hierarchical cluster analyses were performed for parameters in unfiltered and filtered images.
3. Results
The T(x) for each cartridge of the phantom is described in Table 3. The 10 cartridges had various textures in unfiltered CT images, with mean0 varying from −825 (cartridge D) to 508 (cartridge J), SD0 from 5.1 (cartridge H) to 119.1 (cartridge D), entropy0 from 3.04 (cartridge H) to 5.74 (cartridge D), skewness0 from −0.58 (cartridge B) to 0.24 (cartridge I), and kurtosis0 from −1.26 (cartridge D) to 0.74 (cartridge I).
Table 3.
Median of the texture parameters among all scans for each phantom cartridge.
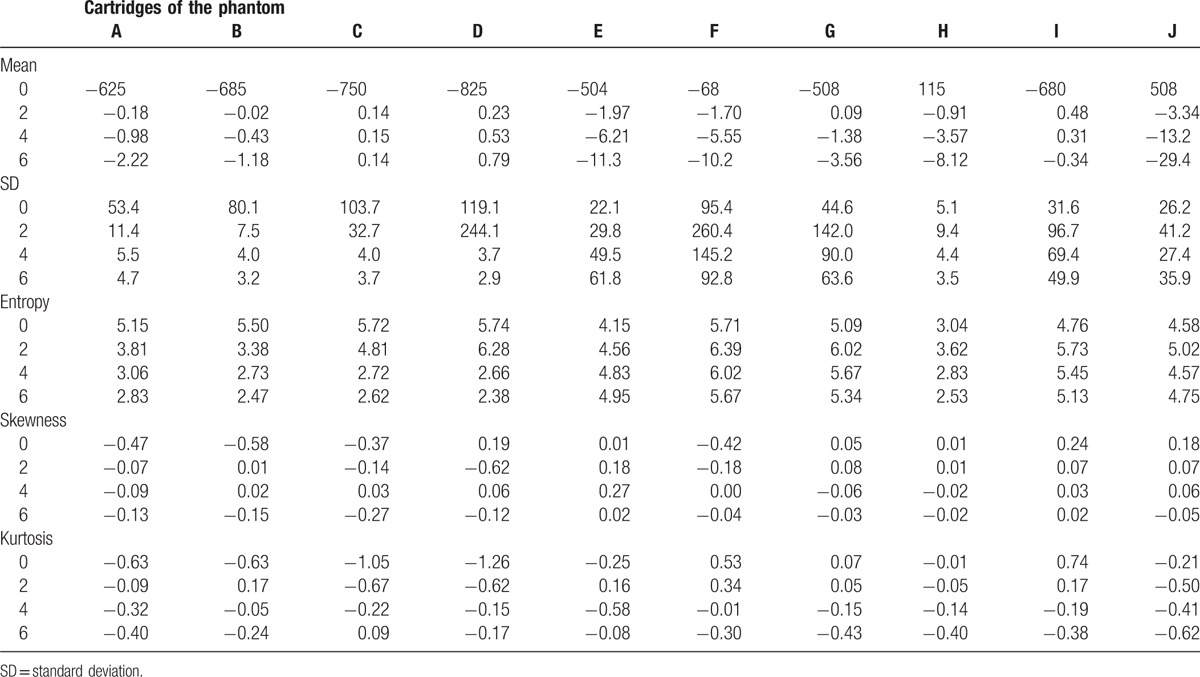
The VI values are shown in Table 4. For mean0, SD2, SD4, SD6, entropy2, entropy4, and entropy6, the VI was less than 0.05. The VI value for the mean was small in the unfiltered image (mean0) compared with those in the filtered images (mean2, mean4, and mean6) (0.097–0.146). In terms of SD and entropy, the VI values were small in filtered images (SD2, SD4, SD6, entropy2, entropy4, and entropy6) compared with those in the unfiltered image (SD0 and entropy0) (0.108–0.134). For skewness and kurtosis in the processed images (with image filtration featuring medium to coarse textures), the VI was relatively large (0.638–0.692 and 0.430–0.437, respectively).
Table 4.
Scanner variability index for each texture parameter.

The VI(x) for each cartridge of the phantom is described as a color map in Fig. 2. In some cartridges, VI(x) was larger than 1 for skewness4, skewness6, kurtosis0, kurtosis4, and kurtosis6. This indicates greater scanner variability than the variability of different objects regarding these parameters. Mean0, SD6, entropy2, entropy4, and entropy6 were relatively robust for all cartridges.
Figure 2.
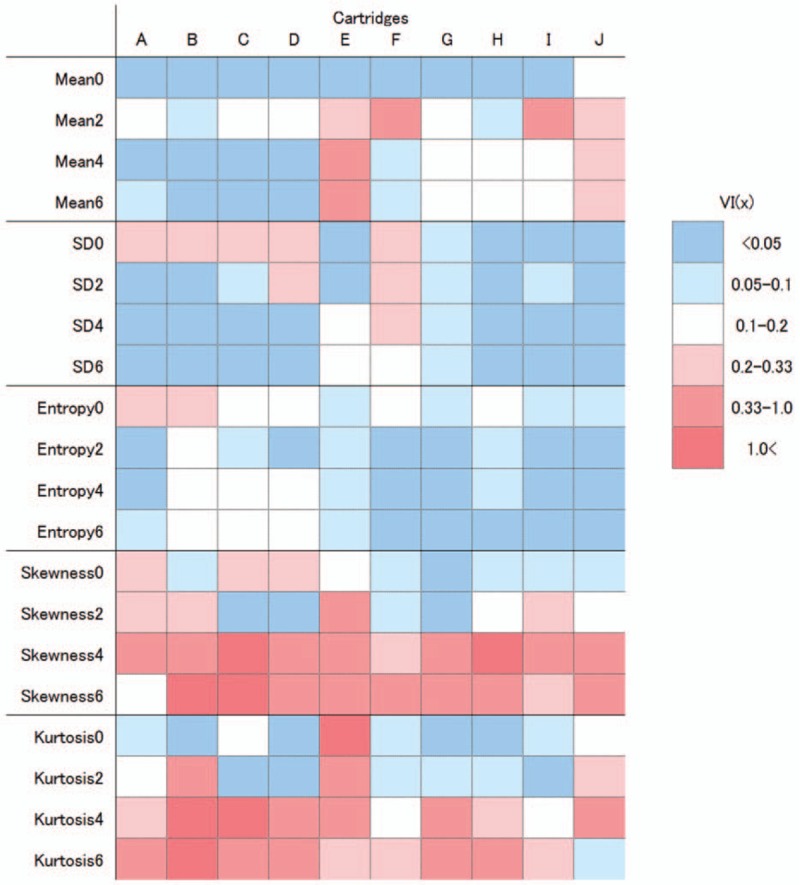
Color map of the scanner variability for each phantom cartridge (VI(x)). Columns indicate the 10 cartridges. The dark and light blue colors indicate VI(x) values of less than 0.05 and 0.05–0.1, respectively. Light, medium, and dark red colors indicate VI(x) values of 0.2–0.33, 0.33–1.0, and greater than 1.0, respectively.
Hierarchical clustering dendrograms and values for R(x,y) as a color map are presented in Fig. 3 and Fig. 4, respectively. Tube voltage had relatively large effect on mean0 compared with scanner variability (Fig. 3A). However, for other parameters including SD0, the effects of tube voltage and tube current were relatively small compared with that of scanner variability (Fig. 3B–J). All R(x,y) values for mean0, SD0–6, and entropy0–6 were within the range −3.0 to 3.0 (Fig. 4). In terms of mean 2–6, skewness and kurtosis, some values of R(x,y) were considerably different from T(x), with a robust z score greater than 3.0 or less than −3.0 (Fig. 4). For mean 2–6, T1 tended to show high values compared with other scanners.
Figure 3.
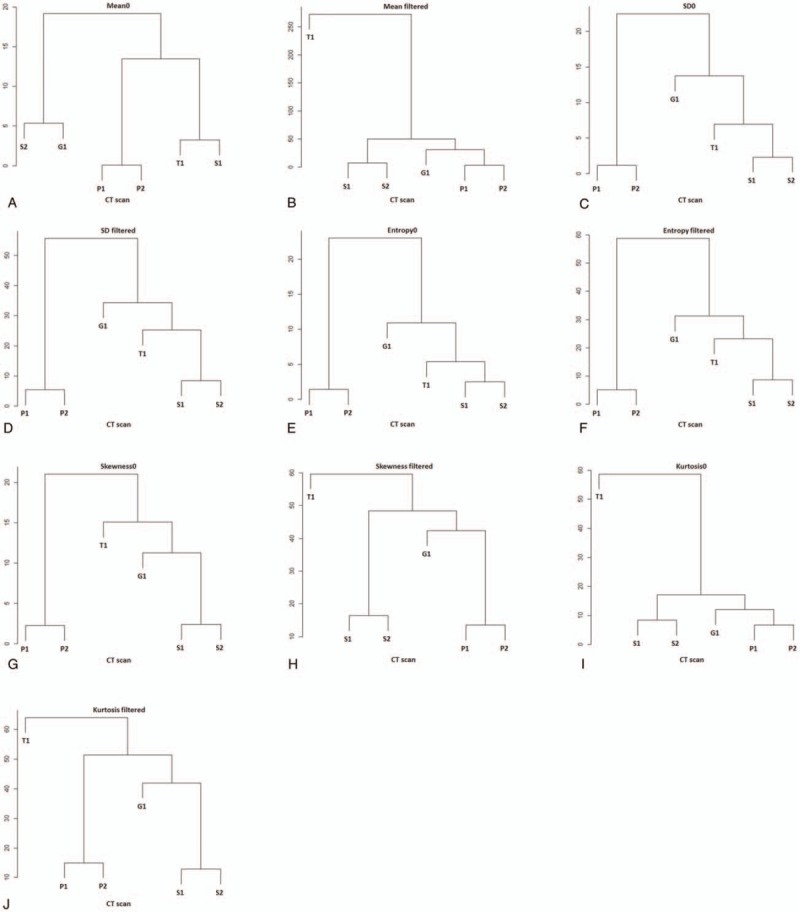
Hierarchical clustering dendrograms for parameters in unfiltered and filtered images. Note that the S1 and S2 or P1 and P2 are clustered closest for all dendrograms indicating that the effect of tube current (P1 vs P2) and tube voltage (S1 vs S2) on parameters is relatively small compared with that of computed tomography scanner, except for mean0 (A).
Figure 4.
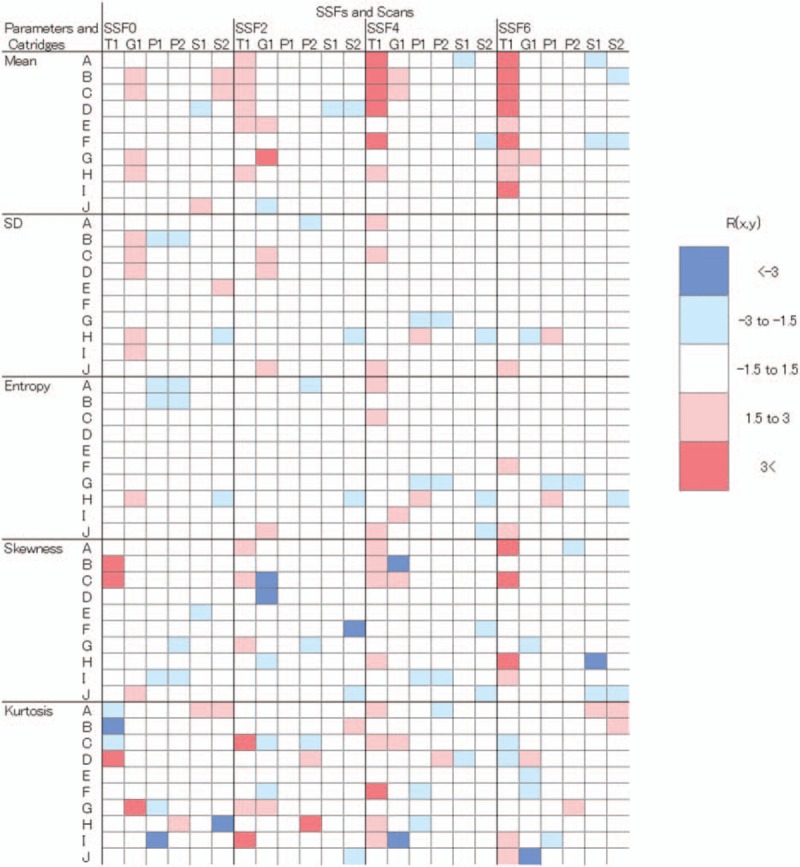
Color maps of the robust z scores (R(x,y)) for each phantom cartridge with scans. For each matrix, rows indicate the 10 cartridges, and columns indicate the 6 scans. Light and dark blue colors indicate R(x,y) values of less than −3 and −3 to −1.5, respectively. Light and dark red colors indicate R(x,y) values of more than 3 and 3 to 1.5, respectively.
4. Discussion
CT texture analyses using filtered images have been gaining attention, as they reportedly provide clinically useful information.[10–15] However, for such studies, how quantitative texture parameters differ among CT scans and whether the reported study results could be directly applicable to clinical situations have been unclear. We found that the mean in unfiltered images and the entropy and SD in filtered images were relatively robust among different scanners. However, the skewness and kurtosis in filtered images with medium to coarse SSF were variable across different scanners. Our data would help radiologists in applying results of articles regarding histogram analyses for images with and without filtration to clinical settings, and would help researchers conducting studies with this technique in designing the studies and in interpretation of data.
Several different methods are available for quantitative texture analysis.[5,7] One such method is based on histogram analysis of values from each pixel, and several parameters, such as the mean, SD, entropy, skewness, and kurtosis, are measured. This type of method, termed first-order statistics, does not take the relationships between neighboring pixels into account. With higher order statistics, texture is analyzed by comparing neighboring pixels for similarity and dissimilarity, and parameters such as busyness and coarseness are calculated.[7] A further method, which analyzes texture for filtered (using Laplacian of Gaussian filter) as well as unfiltered images,[20] enables the analysis of fine to coarse textures. In this study, we evaluated scanner variability using this latter method.
The texture parameter of SD indicates variance from the mean value of the grayscale. For unfiltered images, this parameter is usually used as an indicator of image noise if measured in theoretically homogeneous areas. Therefore, in general, the value of SD0 is thought to be affected by image noise in addition to differences among CT scanners. Image noise itself is affected by tube current. In this study, two tube current levels were used for the Brilliance 64 scanner. From cluster analyses, the effect of small difference of tube current on SD0 was found to be relatively small compared with that of scanner variability in this study.
The SD in filtered images was less variable compared with that in unfiltered images. A Gaussian filter uses a weighted average using a normal distribution type weighting factor and renders images smooth. A Laplacian filter uses secondary differentiation of the grayscale of pixels and identifies edges. A Laplacian of Gaussian filter, which was convolved with the original image in this study, has a circularly symmetric “Mexican hat”-like distribution.[7] It is possible that the effects of image noise were reduced in filtered images, and this might have resulted in reduced variance in the SD of filtered images among different scanners.
Entropy is an indicator of inhomogeneity, and its clinical relevance has been reported in other studies.[12–15] Entropy in filtered images was relatively less variable compared with that in unfiltered images. The behavior of this parameter across unfiltered and filtered images was similar to that of the SD. Therefore, entropy might also be affected by photon noise, the effect of which might have been reduced by image filtering.
The mean in unfiltered CT images (i.e., mean0) is equal to the average CT attenuation within the ROI. Tube voltage alters CT attenuation. Because of the limitation of the scanner itself, a different tube current was used for scan S1 (110 kVp) and scan S2 (130 kVp). And because evaluation of the effect of special protocols, such as reduced tube voltage (e.g., 80 kVp) or aggressive tube current reduction on quantitative texture analysis, was not the main theme of this study, the difference in tube voltage from that used normally (120 kVp) was kept minimal. This small difference of tube voltage was actually found to have relatively large effect on mean0 compared with scanner variations. CT attenuation also varies when the tube current is reduced aggressively (a volume CT dose index [CTDIvol] level less than 1 mGy),[21,22] while a small difference in the tube current does not significantly affect CT attenuation.[23] Aggressively reduced tube currents were not used in this study (the CTDIvol was in the range 9.5–20.4 mGy). And the effect of small difference of tube current on mean0 was found to be relatively small compared with scanner variability. The difference in the CT scanner also affects CT attenuation.[23] In our study, the scanner variability was relatively small for mean0 compared with that for other parameters. On the contrary, the mean in filtered images was found to be relatively variable among different scans compared with that in unfiltered images. And we need to recognize that mean 2–6 values in Toshiba CT are relatively high compared with other scanners.
For skewness0–6 and kurtosis0–6 in some cartridges, scanner variance exceeded the variance among cartridges. The difference in the scanner and reconstruction algorithm might have affected these results. For images processed using medium to coarse filters, skewness and kurtosis were variable with a VI of 0.430–0.692. Researchers should take this variance into account in interpreting the data associated with these parameters if several CT scanners are included for analysis. And cares should be taken for applying the reported results regarding these variable parameters to actual clinical settings if there is a difference in CT scanners.
The variability of the mean, SD, and entropy in unfiltered images has been described by a previous report.[8] Mackin et al evaluated scanner variability, comparing the variability of CT texture for non-small cell lung cancer (NSCLC). Although their study design differs from ours, the reported scores for scanner variability in their study corresponded to 8.972 for busyness, 1.633 for coarseness, 0.326 for entropy, 0.124 for the mean, and 0.116 for SD. Compared with the variance among 20 NSCLCs, busyness and coarseness were more variable across scans, while entropy, mean, and SD were less variable across scans. The relatively low scanner variabilities for mean, SD, and entropy do not conflict with the results of our study.
Some limitations should be acknowledged in the current study. First, we evaluated scanner variability for CT texture using a radiomics phantom. Ideally, it is better to evaluate the difference in CT texture parameters among different scanners for tumors or organs in comparison with the degree of difference among clinically relevant groups. However, such a study design requires exposing patients to increased radiation exposure. Second, to evaluate the difference in quantitative texture parameters among CT scanners, it is better to set identical scanning and reconstruction parameters across scanners. Because the FOV is known to affect the CT texture parameter in unfiltered images,[8] we set an identical FOV across different scans. Slice thickness is also known to affect texture parameters in unfiltered images when it is widely different (1.25 mm vs 5 mm).[24] However, because of the limitations of the CT scanners, some parameters including slice thickness could not be set as identical among the different scans. Instead, we attempted to replicate daily clinical situations for CT scanning, adopting some of the scanning or reconstruction parameters used in daily clinical practice. And we also tried to keep the difference of slice thickness among CT scans minimal (2.5–3 mm). Third, the study design was not based on the hypothesis testing approach. This was because we thought that showing the fundamental data (the degree of variability in each parameter derived from histogram analyses for images with and without filtration) would be preferable to the hypothesis testing approach (whether or not the parameters are universally applicable across scanners). Fourth, we investigated how texture parameters are affected across scanners in standard-of-care scanning protocols. Future studies on how these parameters are affected at special scanning protocols (e.g., reduced-dose CT and considerably different tube voltages) are expected. Finally, we did not evaluate the effect of iterative reconstruction on quantitative CT texture parameters. Iterative reconstruction is gaining attention, especially for reducing radiation exposure to patients without compromising image quality. However, the details of their algorithms and achievable radiation dose reduction levels differ from vendor to vendor. Therefore, we thought it would be better to evaluate them focusing on one vendor not across different vendors. Future study investigating the effect of iterative reconstruction algorithms on quantitative CT texture analyses focusing on each vendor is expected.
In conclusion, the quantitative CT texture parameters of the mean in unfiltered images and the SD and entropy in filtered images were relatively robust among different scans; however, skewness and kurtosis were variable in filtered images featuring medium to coarse textures. The behavior of these quantitative CT texture parameters among different scans should be taken into consideration when interpreting results of studies regarding quantitative texture analyses or when applying reported study results to clinical situations.
Supplementary Material
Acknowledgments
The authors acknowledge Makoto Watanabe, Yoshiaki Yokoyama, and Kenji Ino for their assistance in scanning the phantom with computed tomography.
Footnotes
Abbreviations: 3D = three-dimensional, CT = computed tomography, CTDIvol = a volume computed tomography dose index, FOV = field of view, IQR = interquartile range, NSCLC = nonsmall cell lung cancer, R(x,y) = robust z score for texture parameters for a specific cartridge with a specific scan, ROI = region of interest, SD = standard deviation, SSF = spatial scaling factor, T(x,y) = texture parameters for each cartridge of the phantom in a specific scan, VI = variability index.
The authors have no funding and conflicts of interest to disclose.
Supplemental Digital Content is available for this article.
References
- [1].Vogelstein B, Papadopoulos N, Velculescu VE, et al. Cancer genome landscapes. Science 2013;339:1546–58. [DOI] [PMC free article] [PubMed] [Google Scholar]
- [2].Hricak H. Oncologic imaging: a guiding hand of personalized cancer care. Radiology 2011;259:633–40. [DOI] [PubMed] [Google Scholar]
- [3].Gatenby RA, Grove O, Gillies RJ. Quantitative imaging in cancer evolution and ecology. Radiology 2013;269:8–15. [DOI] [PMC free article] [PubMed] [Google Scholar]
- [4].Fletcher JG, Leng S, Yu L, et al. Dealing with uncertainty in CT images. Radiology 2016;279:5–10. [DOI] [PubMed] [Google Scholar]
- [5].Gillies RJ, Kinahan PE, Hricak H. Radiomics: images are more than pictures, they are data. Radiology 2016;278:563–77. [DOI] [PMC free article] [PubMed] [Google Scholar]
- [6].Thrall JH. Trends and developments shaping the future of diagnostic medical imaging: 2015 Annual Oration in Diagnostic Radiology. Radiology 2016;279:660–6. [DOI] [PubMed] [Google Scholar]
- [7].Davnall F, Yip CS, Ljungqvist G, et al. Assessment of tumor heterogeneity: an emerging imaging tool for clinical practice? Insights Imaging 2012;3:573–89. [DOI] [PMC free article] [PubMed] [Google Scholar]
- [8].Mackin D, Fave X, Zhang L, et al. Measuring computed tomography scanner variability of radiomics features. Invest Radiol 2015;50:757–65. [DOI] [PMC free article] [PubMed] [Google Scholar]
- [9].Ganeshan B, Miles KA. Quantifying tumour heterogeneity with CT. Cancer Imaging 2013;26:140–9. [DOI] [PMC free article] [PubMed] [Google Scholar]
- [10].Skogen K, Ganeshan B, Good C, et al. Measurements of heterogeneity in gliomas on computed tomography relation ship to tumor grade. J Neurooncol 2013;111:213–9. [DOI] [PubMed] [Google Scholar]
- [11].Ganeshan B, Goh V, Mandeville HC, et al. Non-small cell lung cancer: histopathologic correlates for texture parameters at CT. Radiology 2013;266:326–36. [DOI] [PubMed] [Google Scholar]
- [12].Lubner MG, Stabo N, Abel EJ, et al. CT textural analysis of large primary renal cell carcinomas: pretreatment tumor heterogeneity correlates with histologic findings and clinical outcomes. AJR Am J Roentgenol 2016;207:96–105. [DOI] [PubMed] [Google Scholar]
- [13].Ng F, Ganeshan B, Kozarski R, et al. Assessment of primary colorectal cancer heterogeneity by using whole-tumor texture analysis: contrast-enhanced CT texture as a biomarker of 5-year survival. Radiology 2013;266:177–84. [DOI] [PubMed] [Google Scholar]
- [14].Yip C, Landau D, Kozarski R, et al. Primary esophageal cancer: heterogeneity as potential prognostic biomarker in patients treated with definitive chemotherapy and radiation therapy. Radiology 2014;270:141–8. [DOI] [PubMed] [Google Scholar]
- [15].Goh V, Ganeshan B, Nathan P, et al. Assessment of response to tyrosine kinase inhibitors in metastatic renal cell cancer: CT texture as a predictive biomarker. Radiology 2011;261:165–71. [DOI] [PubMed] [Google Scholar]
- [16].Ganeshan B, Hosur A, Skogen K, Tasker F, Dizdarevic S, Miles KA. Multi-parametric FDG PET-CT in thoracic malignancies: opportunities for combined prognostic imaging biomarkers. Presented at: UK Radiological Congress 2012, Manchester, UK. [Google Scholar]
- [17].Puwastien P. Issues in the development and use of food composition databases. Public Health Nutr 2002;5:991–9. [DOI] [PubMed] [Google Scholar]
- [18].Tripathy SS, Saxena RK, Gupta PK. Comparison of statistical methods for outlier detection in proficiency testing data on analysis of lead in aqueous solution. Am J Theor Appl Stat 2013;2:233–42. [Google Scholar]
- [19].Huynh H, Meyer P. Use of robust z in detecting unstable items in item response theory models. Pract Assess Res Eval 2010;15:1–8. [Google Scholar]
- [20].Miles KA, Ganeshan B, Hayball MP. CT texture analysis using the filtration-histogram method: what do the measurements mean? Cancer Imaging 2013;13:400–6. [DOI] [PMC free article] [PubMed] [Google Scholar]
- [21].Yasaka K, Katsura M, Sato J, et al. Comparison of new and conventional versions of model-based iterative reconstruction in reduced-dose computed tomography for diagnosis of hepatic steatosis. Jpn J Radiol 2016;34:339–48. [DOI] [PubMed] [Google Scholar]
- [22].Yasaka K, Katsura M, Akahane M, et al. Dose-reduced CT with model-based iterative reconstruction in evaluations of hepatic steatosis: How low can we go? Eur J Radiol 2014;83:1063–8. [DOI] [PubMed] [Google Scholar]
- [23].Birnbaum BA, Hindman N, Lee J, et al. Multi-detector row CT attenuation measurements: assessment of intra- and interscanner variability with an anthropomorphic body CT phantom. Radiology 2007;242:109–19. [DOI] [PubMed] [Google Scholar]
- [24].Zhao B, Tan Y, Tsai WY, et al. Exploring variability in CT characterization of tumors: a preliminary phantom study. Transl Oncol 2014;7:88–93. [DOI] [PMC free article] [PubMed] [Google Scholar]
Associated Data
This section collects any data citations, data availability statements, or supplementary materials included in this article.


