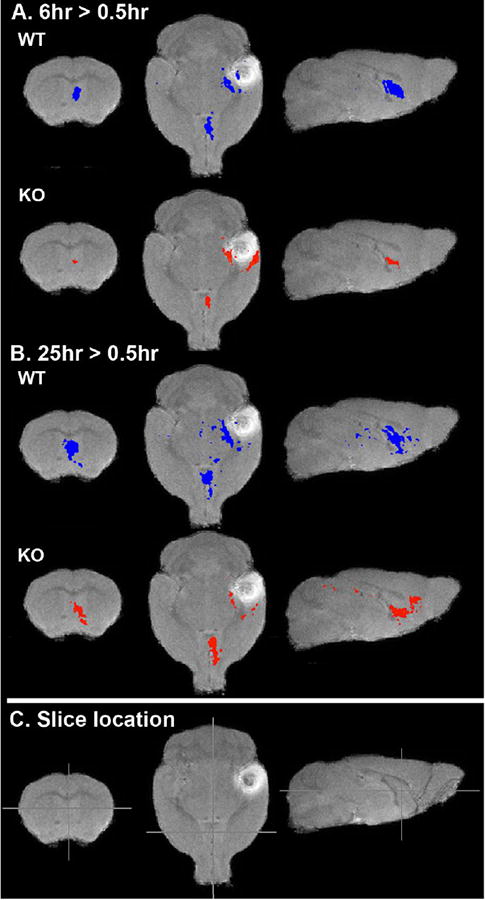
Figure 4.

Within genotype comparisons of transport from the injection site to the basal forebrain in KLC-KO and their wild-type littermates at 6 hour and 25 hour greater than 0.5 hour post-injection. Shown are slices from 3D-voxel-wise statistical parametric maps of paired T-tests (T-maps) comparing voxels with significant intensity increases between time-points for each genotype as indicated. Increases at 6 hours compared to 0.5 hour post-injection (6hr > 0.5hr), and for 25 hours greater that 0.5 hour (25hr >0.5hr) are overlaid on a grayscale image of the minimal deformation atlas for WT at 0.5 hour post-injection. A. The pattern of intensity increases at 6 hours compared with 0.5 hour for each genotype (blue, wild-type littermates; red KLC-KO) p=0.0001 (uncorr.). B. Voxels with increased intensity at 25 hours greater than 0.5 hour post-injection. p=0.0001 (uncorr.) (25hr > 0.5hr). C. Cross-hairs indicate the positions of slices shown in A and B. Note that at this p value, the forebrain appears to have more signal in wild-type than KLC-KO and that signal in the KLC-KO appears to have progressed further anteriorly at 25 hours post injection.
