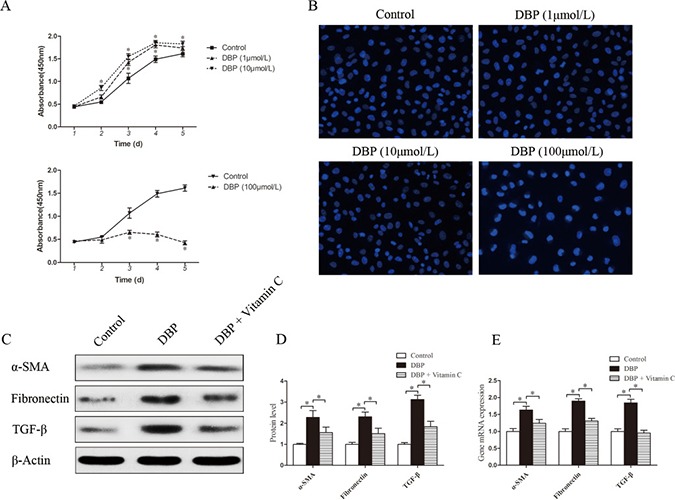
Figure 3. DBP promotes the proliferation and activation of NRK49F cells at a sublethal dose.

(A) CCK-8 cell proliferation assays showing different proliferation between NRK49F cells exposed to various concentrations of DBP (1, 10, 100 μmol/L). (B) Hoechst 33342 dye stained images of NRK49F cells exposed to various concentrations of DBP (1, 10, 100 μmol/L). (C) Western blot showing different α-SMA, fibronectin and TGF-β protein levels of NRK49F cells in DBP-exposed, vitamin C-exposed group and unexposed controls. (D) Densitometric quantification of α-SMA, fibronectin and TGF-β proteins levels of NRK49F cells in DBP-exposed, vitamin C-exposed group and unexposed controls. (E) Real-time PCR assessed the expression of α-SMA (Acta), fibronectin (Fn) and TGF-β (Tgfb) of NRK49F cells in DBP-exposed, vitamin C-exposed group and unexposed controls. Data represent mean ± SD. n = 6 rats per group, *P < 0.05.
