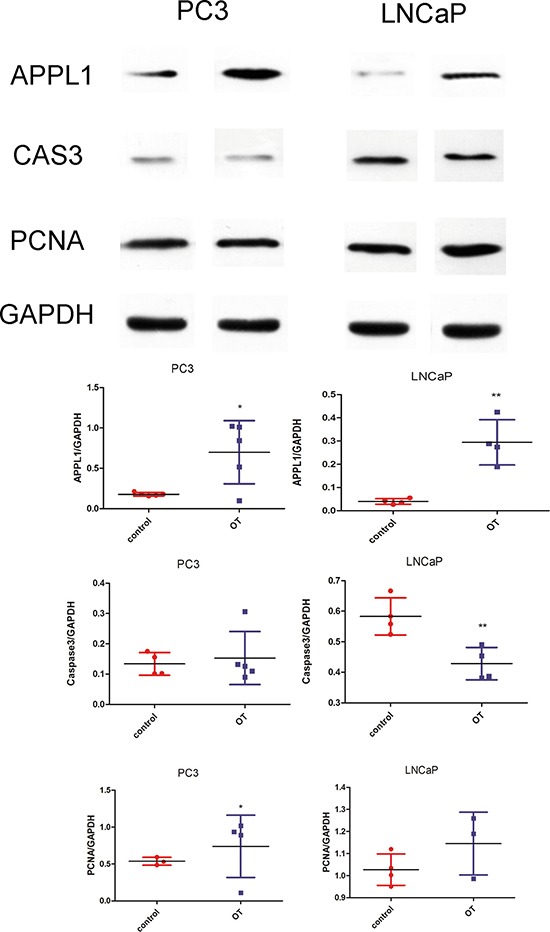
Figure 5. Western blot analysis of the cell markers in the PC3 and LNCaP cell lines.

Oxytocin elevates APPL1 expression in PC3 and LNCaP cell lines. Caspase-3 was significantly decreased in the LNCaP cells by oxytocin. In the PCNA analysis, oxytocin increases the expression in PC3 cells significantly. All the values are shown as means ± SD. *P < 0.05, **P < 0.01 (compared with the control group) OT: oxytocin (50 nM) treated group; C: control group which was treated with PBS.
