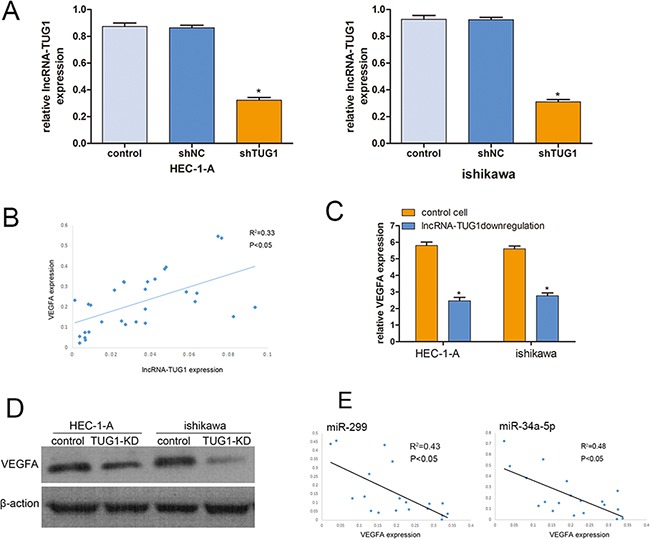
Figure 2. Knockdown lncRNA-TIG1 in EC cells.

A. HEC-1-A and ishikawa cells were transfected with lncRNA-TUG1 siRNA and control siRNA for 48 h. qRT-PCRs were conducted to detect lncRNA-TUG1 levels. The data were shown as fold increase compared with control group. Data are mean ± SEM, normalized to GAPDH. B. The linear correlations between the lncRNA-TUG1expression levels and VEGFA mRNA were tested. The relative expression value was normalized by GAPDH expression level. C. The expression of VEGFA was detected after downregulated lncRNA-TUG1. D. The protein levels of VEGFA was assessed in HEC-1-A cells and ishikawa cells by Western blot. E. The linear correlations between the miR-299 and miR-34a-5p expression levels and VEGFA mRNA were tested.
