Abstract
The Mars Organic Analyzer (MOA), a microfabricated capillary electrophoresis (CE) instrument for sensitive amino acid biomarker analysis, has been developed and evaluated. The microdevice consists of a four-wafer sandwich combining glass CE separation channels, microfabricated pneumatic membrane valves and pumps, and a nanoliter fluidic network. The portable MOA instrument integrates high voltage CE power supplies, pneumatic controls, and fluorescence detection optics necessary for field operation. The amino acid concentration sensitivities range from micromolar to 0.1 nM, corresponding to part-per-trillion sensitivity. The MOA was first used in the lab to analyze soil extracts from the Atacama Desert, Chile, detecting amino acids ranging from 10–600 parts per billion. Field tests of the MOA in the Panoche Valley, CA, successfully detected amino acids at 70 parts per trillion to 100 parts per billion in jarosite, a sulfate-rich mineral associated with liquid water that was recently detected on Mars. These results demonstrate the feasibility of using the MOA to perform sensitive in situ amino acid biomarker analysis on soil samples representative of a Mars-like environment.
Keywords: amino acid analysis, astrobiology, capillary electrophoresis, microfabrication
Extraterrestrial life on Mars or elsewhere most likely requires three fundamental elements: liquid water, organic molecules capable of forming combinatorial polymers, and a redox energy source (1). The Mars Global Surveyor imaged features attributed to aqueous seeps (2), and the Mars Exploration Rovers recently detected mineralogical signs of liquid water (3). Opportunity observed rocks with layering patterns that could have been formed by water, the Mössbauer spectrometer detected significant concentrations of jarosite, an iron-sulfate mineral that is only formed in the presence of liquid water, and the alpha-particle x-ray spectrometer detected abundant sulfates (3). These observations point to the existence of a liquid habitat on Mars that could have supported life.
Attempts have already been made to detect organic molecules on Mars. The Viking landers carried pyrolysis gas chromatograph/mass spectrometers (GCMS) that did not detect significant organic molecules (4). This result does not preclude the presence of organic molecules on Mars because of the difficulty of detecting low levels of organics in situ in a highly oxidizing environment (1, 5). It has been suggested that the Viking pyrolysis GCMS would not have detected even high concentrations of the remnants of organisms in soil because of the low volatility of organic oxidation products (5); similar difficulties were encountered when duplicating the Viking experiments in an arid terrestrial environment (6). In addition, water and CO2 interfere with the detection of likely organic pyrolysis products, resulting in an elevated detection limit of ≈10 ppm (7). Improved instrumentation must be developed that is capable of sensitive detection and analysis of key biomarkers from Mars-like soils.
Microfabricated microfluidic technology has advanced chemical and biochemical analysis dramatically over the past decade (8), producing miniaturized high-speed instruments for nucleic acid analysis (9), clinical assays, diagnostics, and pathogen detection (10). Amino acids are also readily analyzed by such microchip systems (11–13). Furthermore, amino acids are key biomarkers for life based on polyamino acids (1), and analysis of amino acid chirality provides a means to distinguish between biotic and abiotic production (11, 13). These accomplishments provide the foundation for the development of advanced microdevices and robust, portable instrumentation for amino acid detection and analysis. We present here a microfabricated chip and portable capillary electrophoresis (CE) instrument called the Mars Organic Analyzer (MOA) and demonstrate its ability to analyze amino acids from Mars-like soils.
Materials and Methods
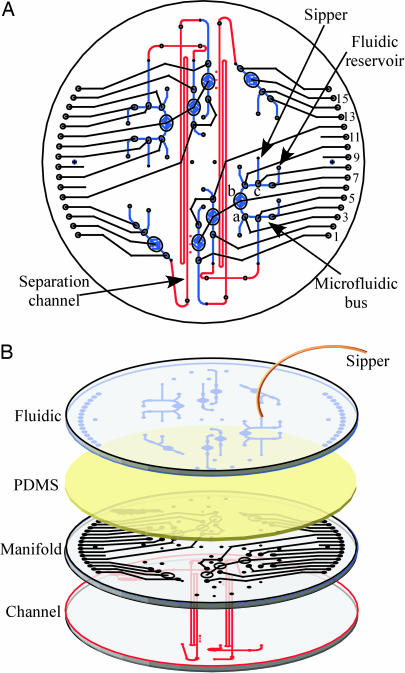
Fabrication and Assembly of Microchip. Multilayer microdevices were constructed as described in refs. 13–15. Briefly, 10-cm-diameter, D263 glass wafers (Precision Glass and Optics, Santa Ana, CA) were patterned as indicated in Fig. 1 and developed. The pattern is etched 20 μm deep for the separation channel and fluidic features and 70 μm deep for the manifold features. Both folded separation channels are 21.4 cm long and 110 μm wide, with 1.2-cm-long, 70-μm-wide cross-injection channels. The manifold wafer is blank on the bottom and patterned with the pneumatic manifold features for vacuum/pressure lines and displacement chambers on the top. The fluidic wafer contains discontinuous channels patterned on its bottom surface to form valves. Vias and electrical, fluidic, and pneumatic access ports were drilled with diamond-tipped drill bits. The channel and manifold layers were aligned and thermally bonded to form the all-glass separation channels. Holes were punched through the 254-μm-thick polydimethylsiloxane (PDMS) membrane for vias and electrical reservoirs. The bonded wafer stack and PDMS membrane were UV–ozone cleaned, and the activated face of the PDMS membrane was applied to the top of the stack, sealing the manifold features. The fluidic layer was then aligned and fixed to the unactivated surface of the PDMS membrane. The sipper was coupled to the fluidic wafer by gluing a NanoPort to the sipper reservoir.
Fig. 1.
Microdevice for amino acid analysis. (A) Top view showing registration of the CE channel (red), pneumatic manifold (black), and fluidic bus wafers (blue). (B) Expanded view showing the microfabricated device assembly. The channel features are formed by thermally bonding the etched glass channel and manifold wafers. The manifold and fluidic wafers are held together by the PDMS membrane to create on-chip valves, pumps, and reservoirs.
Microdevice Design and Operation. The microdevice shown in Fig. 1 contains an array of 34 membrane valves and eight pumps (14). The valves comprise an etched displacement chamber on the top surface of the manifold wafer, a PDMS membrane layer, and a discontinuous channel structure on the bottom of the fluidic wafer. Applying a vacuum to the displacement chamber draws the membrane down, allowing connection of the fluidic channels. By placing three individually addressed valves in a row, a self-priming pump is created. The microfabricated valves are also used to create a bus for routing fluids to the sample reservoir. For example, by appropriate pneumatic actuation of lines 3, 6, and 8, fluid can be pumped from the fluidic reservoir out through the capillary sipper to the sample entry point. Actuation of lines 5, 6, and 8 pumps the sample back into the bus, where it can be diluted or directed to the separation channel for analysis.
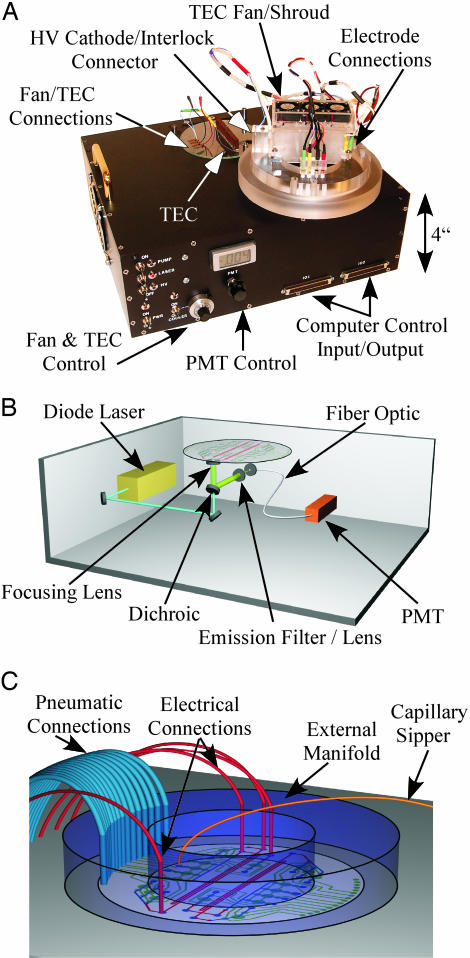
Instrumentation. The portable CE instrument is shown in Fig. 2 along with a close-up schematic of the optical diagram and the chip manifold. The functions integrated within the MOA instrument include the laser excitation and optical detection system, production and control of electrophoresis potentials, actuation of the microfluidic valves and pumps, and control of the electrophoresis temperature.
Fig. 2.
Instrument for amino acid analysis. (A) The MOA instrument contains electrophoresis power supplies, laser-induced fluorescence detection, a TEC for temperature control, and pneumatic actuation solenoids. (B) Schematic of the instrument showing confocal excitation and detection optics. (C) Close-up of the external manifold. Pneumatic and electrical connections extend out the bottom of the external manifold to interface with the microchip. The sipper extends out the top of the device for sample introduction. The device has a mass of ≈11 kg and a peak power utilization of 15 W.
Optical excitation is accomplished by directing the output of a 400-nm diode laser (CrystaLaser, Reno, NV) through a 430-nm dichroic beam splitter to an objective lens (Fig. 2B). The planar face of the composite objective with a numerical aperture of ≈0.9 is placed against the bottom of the microchip, and the excitation light is focused 0.7 mm from the interface to form a 10- to 20-μm spot in the channel. The fluorescence is gathered by the objective, reflected by the dichroic, and passed through 430-nm long-pass and 522-nm band-pass filters. Confocal detection is accomplished by focusing the output into a 100-μm-diameter fiber-optic-coupled photomultiplier.
The instrument also contains power supplies, pneumatic components to control the valves and pumps, and a thermoelectric cooler (TEC) for keeping the separation channel at 8°C. Three miniature high-voltage power supplies provide the –15 kV and –3 kV electrophoresis potentials, and one HV solid-state switch enables floating the anode. Two rotary pumps are used to provide pneumatic pressure and vacuum that is routed by a bank of 16 computer-controlled solenoids.
The manifold shown in Fig. 2C clamps the microdevice to the instrument and provides electrical and pneumatic connections. Four insulated HV lines connect to the CE electrodes, which extend into 0.318-cm-thick PDMS moats for the cathode, anode, sample, and waste reservoirs. Pneumatic control is achieved by a tubing ribbon that extends from the bank of solenoids to the external manifold. The external manifold also supports the removable TEC and fans.
Analysis of Atacama Samples. Soil samples were collected from the Atacama Desert, Chile, and stored in sterile plastic bags. The sample (≈300 mg) was added to glass test tubes previously annealed at 500°C. An internal standard (5 μl of 1 mM racemic norleucine) was added to each soil sample, and vapor-phase acid hydrolysis was performed (16). After hydrolysis, the HCl residue was vaporized, and the hydrolyzed solid sample was brought up in 1 ml doubly distilled H2O (ddH2O) and centrifuged.
Desalting of the amino acid supernatant was performed by using AG50-X8 cation-exchange resin (Bio-Rad). Metals were first eluted with 6 ml of 0.1 M oxalic acid, pH 7 (17). Amino acids were eluted with 2.5 M ammonium hydroxide and dried. The residue was brought up in 100 μl of ddH2O, and 25-μl aliquots were separated for analysis. We added 10 μl of 0.4 M borate buffer, pH 9.5, to the aliquots, and the samples were dried down. The samples were brought up in 20 μl of ddH2O, dried to fully remove residual ammonia, and brought up in 10 μl of ddH2O for derivatization. Samples analyzed by HPLC were labeled with o-phthaldialdehyde N-acetyl-l-cysteine and run on a reverse-phase HPLC (18).
For analysis by the MOA instrument, the 10 μl samples were combined with 25 μl of 6.6 mM fluorescamine in acetone (13), reacted for 20 min, and the acetone was removed by evaporation. The samples were then diluted to 100 μl with ddH2O for injection. Separations were performed with the sample and waste at –2.65 kV, the anode at 0 V, and the cathode at –15 kV. All samples were injected in triplicate and standard deviations were used to calculate error bars.
Analysis of Jarosite Samples. Samples of jarosite were collected in the Panoche Valley, CA (N 36° 37.215; W 120° 39.229) (19). The samples were ground, and 1 g was placed in the Mars Organic Detector (MOD) for sublimation (20, 21). The MOD chamber was pumped down to ≈5 mtorr (1 torr = 133 Pa), and the sample was taken through a “pulsed” heating sequence optimized to remove water vapor (20 min at ≈50°C, 30 min between 50–110°C, and 10 min at 120°C) followed by heating at 250°C for 10 min to sublime amino acids and amines onto an aluminum disk spin-coated with fluorescamine and held at 0°C. Blanks were taken through the same analysis procedure. To acquire the sample from MOD, 60 μl of 50 mM borate buffer, pH 8.4, was pumped by the MOA out the sipper onto the disk. After 60 s, the solution was drawn back through the sipper and 30 μl was directed to the channel for analysis.
For the laboratory analyses, collected samples (250 mg) were acid-hydrolyzed and desalted as above. Half of the 100 μl total collected fraction was used for HPLC, and 25 μl was used for CE analysis.
Results
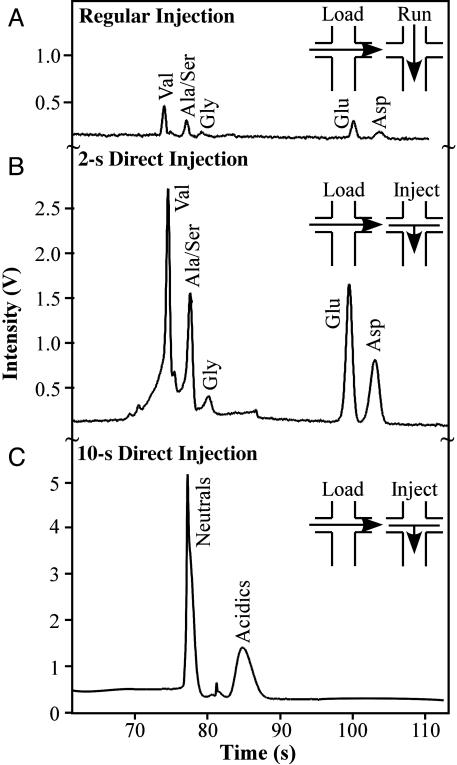
The performance of the MOA was characterized by determining the limit of detection by using three injection schemes (Fig. 3).
Fig. 3.
Injection techniques for amino acid analysis. (A) The standard process involves a 10-s cross-injection from sample to waste at –2.5 kV followed by the run stage. (B) A 2-s direct injection is performed by first executing a cross-injection followed by a 2-s injection from sample, waste, and anode to the cathode at –15 kV. (C) Extension of the direct injection for 10 s increases the signal strength 100-fold with reduced resolution.
First, a cross-injection was performed from sample to waste for 10 s to present an unbiased population of amino acids in the intersection. The resulting separation resolved the amino acids in the 100-fold diluted Mars 7 Standard (equimolar concentrations of valine, aminoisobutyric acid, alanine, serine, glycine, glutamic and aspartic acid; 1 mM total amino acid concentration) with signal-to-noise ratios (S/N) of ≈18 (valine). The number of theoretical plates, N, for the alanine/serine peak was 110,000, and it was baseline-resolved from the glycine peak (resolution, R = 2.1). This injection technique provided sufficient resolution for chiral separations, and the resulting spectra were identical to those reported in ref. 13. Performing a 2-s direct injection immediately after the 10-s cross-injection (Fig. 3B) resulted in a 10-fold increase in signal over the cross-injection, and all amino acids were still resolved (Nala/ser = 42,500; Rala/ser-gly = 1.2). A direct injection of 10 s gave a 100-fold increase in signal over the cross-injection but resulted in loss of individual amino acid resolution; however, the separation of neutral and acidic residues was preserved (Nneutrals = 48,000; Rneutrals-acidics = 4.7).
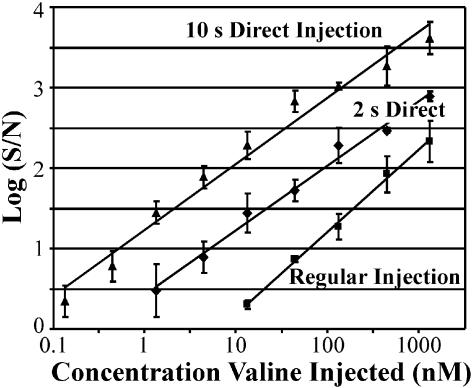
The limit of detection for each injection technique was found through serial dilutions of the Mars 7 Standard, performed before labeling. The MOA gave a linear response over a dynamic range of four orders of magnitude. The limit of detection (S/N = 3) of valine was 13 nM for the 10-s cross-injection, 1.3 nM for the 2-s direct injection, and 130 pM for the 10-s direct injection (Fig. 4).
Fig. 4.
S/N for detection of valine with the different injection techniques. The regular injection can detect valine down to 13 nM (S/N = 3), the limit of detection for the 2-s direct injection was 1.3 nM, and the limit of detection for the 10-s direct injection was 130 pM.
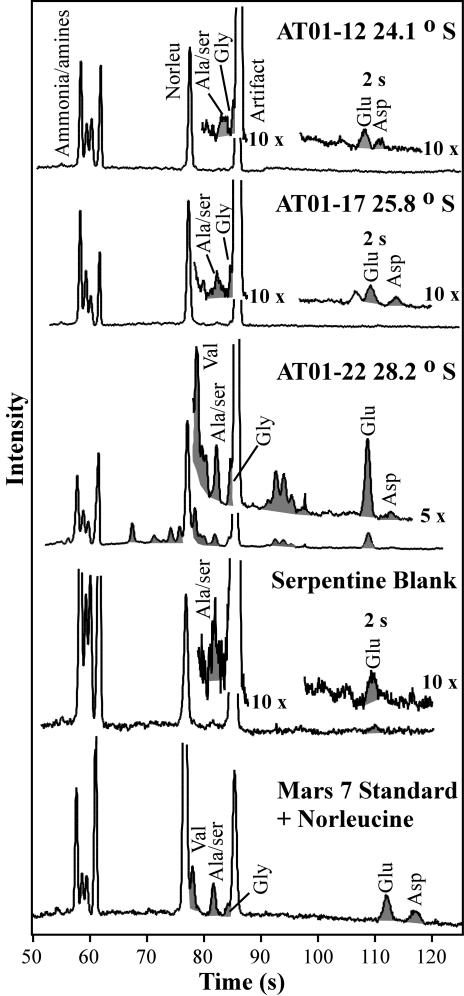
The MOA instrument was next characterized in the lab by analyzing aqueous extracts from Atacama Desert soils (Fig. 5). In all of the traces shown in Fig. 5, including the serpentine blank, three dominant peaks were observed: the internal norleucine standard, an amino acid extraction artifact, and a set of early peaks due to ammonia and small amines. The ammonia peak is a residue of desalting with ammonium hydroxide. In the northern and midlatitude samples, low levels of alanine/serine, glycine, glutamic acid, and aspartic acid could only be detected above the serpentine blank with a 2-s direct injection. In the southern-most sample (AT01-22), several amino acids were present, including valine, alanine/serine, glycine, glutamic acid, and aspartic acid, which can be assigned by comparison with the Mars 7 Standard (Fig. 5, bottom trace).
Fig. 5.
Amino acid analysis of aqueous extracts of Atacama Desert soil samples performed by the MOA. The samples are arranged by latitude, with the top sample being the most northern site in the Atacama Desert. All traces have been scaled to identical norleucine internal standard intensity. Full traces are generated by using the cross-injection procedure; indicated expansions of the acidic regions are from the 2-s direct injection, whereas all other expansions are from the 10-s cross-injections.
Table 1 compares CE and HPLC results on identical Atacama samples. Both analysis techniques revealed amino acids in the 10- to 70-parts-per-billion (ppb) range in the northernmost and midlatitude samples. Differences in concentrations were due to the error inherent in analyzing samples with amino acid levels at or near the serpentine blank and the variability of CE injections with samples that have high salt concentrations. In the southernmost sample, amino acids were detected in the high ppb range. The CE results for the combined valine/γ-aminobutyric acid peak were ≈0.17 ppm above the concentration of γ-aminobutyric acid in the HPLC analysis, whereas the glutamic acid results agreed within error. The CE and HPLC results for alanine/serine, glycine, and aspartic acid agreed within a factor of three (including error limits). The norleucine internal standard allows calculation of extraction/derivatization efficiency. The efficiencies varied from 6% for the blank to 37% for the southernmost sample (CE) and from 14% to 50% for HPLC. The reduced efficiency for the CE analysis was likely caused by the sensitivity of fluorescamine to the labeling conditions and reduced injection efficiency with the higher salt concentrations intrinsic to aqueous extraction.
Table 1. Atacama amino acid analyses.
| Concentration, ppm
|
|||
|---|---|---|---|
| Sample | Amino acid | HPLC | CE |
| AT01-12 24.1°S | Ala/Ser | 0.031 ± 0.003 | 0.009 ± 0.006* |
| Gly | Below blank | 0.03 ± 0.03 | |
| Glu | 0.052 ± 0.005 | Below blank | |
| Asp | Below blank | 0.01 ± 0.01* | |
| AT01-17 25.8°S | Ala/Ser | 0.027 ± 0.003 | 0.01 ± 0.02 |
| Gly | Below blank | 0.02 ± 0.04 | |
| Glu | 0.072 ± 0.007 | Below blank | |
| Asp | Below blank | 0.01 ± 0.01* | |
| AT01-22 28.2°S | Val | Below blank | † |
| γ-ABA | 0.39 ± 0.04 | 0.56 ± 0.04† | |
| Ala/Ser | 0.51 ± 0.05 | 0.17 ± 0.02 | |
| Gly | 0.073 ± 0.007 | 0.32 ± 0.07 | |
| Glu | 0.42 ± 0.04 | 0.36 ± 0.07 | |
| Asp | 0.14 ± 0.01 | 0.04 ± 0.01 | |
All values are serpentine-blank corrected. Below blank, below concentration of serpentine blank.
Determined by 2-s direct injection.
Valine and γ-aminobutyric acid (γ-ABA) coelute in the CE separation but are resolved by HPLC.
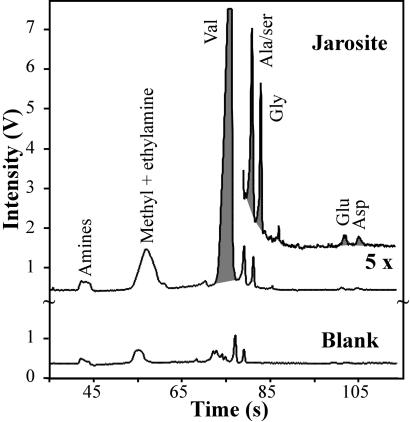
Field tests of the MOA were performed on jarosite samples obtained from Panoche Valley, CA. Two jarosite samples were collected: one sample was scraped off a sandstone base, and the second was a solid homogeneous vein. The samples were confirmed to be jarosite by x-ray diffraction. Samples were ground, sublimed, and labeled by MOD and analyzed in situ by using the portable CE instrument. The traces in Fig. 6 show that the MOA detected low levels of methyl and ethylamine (≈5 ppb), alanine/serine (0.4 ppb), glycine (0.2 ppb), glutamic acid (0.07 ppb), and aspartic acid (0.13 ppb), as well as a significant concentration of valine (≈100 ppb) from the solid jarosite sample. Concentrations of amino acids detected in the jarosite scraping were very similar. The blank showed much lower levels of amines and all amino acids.
Fig. 6.
Analysis of the solid jarosite sample from the Panoche Valley, with the MOA instrument in the field. Samples were prepared by sublimation from sample powder by using the MOD followed by analysis with the MOA by employing a 2-s direct injection.
Subsequent analyses of both jarosite samples were completed in the laboratory by performing aqueous extraction (Table 2). The solid vein sample was extracted in duplicate, and the values were averaged; the scraping sample was extracted once. High concentrations of all amino acids were detected in the jarosite scraping by HPLC (190–640 ppb) and CE (130–470 ppb). The homogeneous solid vein sample exhibited generally lower concentrations of 12–160 ppb. This difference may have been caused by a higher level of organic contamination of the jarosite scraping. The higher overall concentrations found in the aqueous extractions versus sublimation were due to the reduced extraction efficiency for the sublimation process. Valine was a notable exception to this trend. The CE and HPLC results agreed within 30% (including error limits) for all but two amino acids. The lower concentrations found by CE for glutamic acid (scraping) and glycine (pure sample) were probably due to better resolution of these amino acids from overlapping peaks in the CE traces.
Table 2. Panoche jarosite amino acid analysis.
| Concentration, ppb
|
|||
|---|---|---|---|
| Sample | Amino acid | HPLC | CE |
| Field-sublimed solid vein | Val | Not run | ≈100 ± 30* |
| Ala/Ser | Not run | 0.4 ± 0.2* | |
| Gly | Not run | 0.20 ± 0.09* | |
| Glu | Not run | 0.07 ± 0.03* | |
| Asp | Not run | 0.13 ± 0.08* | |
| Laboratory-extracted scraping | Val | 240 ± 20 | 230 ± 10 |
| Ala/Ser | 640 ± 60 | 470 ± 50 | |
| Gly | 330 ± 30 | 220 ± 50 | |
| Glu | 380 ± 40 | 130 ± 10 | |
| Asp | 190 ± 20 | 170 ± 20 | |
| Laboratory-extracted solid vein | Val | 60 ± 30 | 94 ± 9 |
| Ala/Ser | 170 ± 40 | 160 ± 10 | |
| Gly | 121 ± 10† | 12 ± 2 | |
| Glu | 40 ± 40 | 79 ± 5 | |
| Asp | 60 ± 20 | 65 ± 5 | |
All values are serpintine-blank corrected.
Concentrations are based on an assumed 100% extraction efficiency. Actual concentrations are likely to be higher.
Coelutes with extraction artifact.
Discussion
The ground-breaking Viking experiments and their subsequent reanalysis led to the conclusion that more sensitive methods for biomarker detection will be needed. Furthermore, the debate over the origin of magnetite and polyaromatic hydrocarbons in the ALH84001 meteorite (22–24) illustrates that unambiguous biomarkers must be agreed on and analyzed in situ. Although different approaches have been proposed (25), amino acids are uniquely useful biomarkers in the search for extinct or extant life because they are critical components of terrestrial life and their enantiomeric ratios can be used to determine their origins. The MOA developed here exploits the most modern lab-on-a-chip technologies to achieve the goal of highly sensitive amino acid biomarker detection and to demonstrate analyses of relevant samples from the Atacama Desert, Chile, and in the Panoche Valley, CA.
The MOA uses a microfabrication paradigm that combines four wafer layers for effective fluidic transport by means of reliable PDMS pneumatic membrane valves (14) and CE microchannels for high-efficiency amino acid separations. Our efficiencies and resolutions are approaching the theoretical maxima (26) and are equal to those reported in ref. 13, which indicates that the separation capability of the portable MOA instrument is equivalent to that of our lab-based system. In addition, the three different CE injection techniques allow linear analysis over a >1,000-fold concentration range. The sensitivity of the portable system is 4-fold better than that of our previous laboratory system (13). The increased sensitivity is due to optimized design and close proximity of the high numerical aperture objective to the microchannel. Based on our limits of detection (13 nM to 130 pM), a 1-g soil sample, and assuming 100% extraction efficiency, we calculate a limiting sensitivity of 50 to 0.5 parts per trillion, a 1,000-fold improvement over Viking (1, 4).
The Atacama Desert is known for highly oxidized soils with extremely low levels of bacterial life (6, 27) and thus is an excellent Mars analog site for evaluating instrumentation. GCMS analysis of a north–south transect in the Atacama examined the formic acid/benzene ratio, both of which are generated by the pyrolysis of organics (6). In the most arid region, high ratios were detected, indicating that the organic matter is highly oxidized. In the southernmost site, the ratio was significantly lower, and pyrolysis released a mixture of organic compounds from bacteria and/or biomolecules. Similarly, bacterial colony-forming units per gram of soil were <10 at the northernmost site and increased to 106 at the southernmost site (6).
The MOA was used in the laboratory to analyze extracts from Atacama Desert soils. Low but significant concentrations (≈10 ppb) of amines and amino acids were observed in the northernmost sample, which rose to ≈500 ppb in the southernmost sample. These increases correlated with the trends in formic acid/benzene ratios and in colony-forming units per gram (6). The high salt concentrations in the aqueous extract interfered with labeling and injection, preventing the CE instrument from operating at its limiting sensitivity with these samples, but we were still able to detect amino acids in even the most arid northern samples.
The MOA and the MOD were then brought together for a complete sample-to-result analysis of amino acids in the field. Amino acids isolated through the MOD sublimation process are more compatible with CE analysis because salts that interfere with the labeling and injection process are not volatile. We selected the Panoche Valley site for our test because of the presence of jarosite deposits. Jarosite samples of different apparent homogeneity were analyzed, and amino acids were detected at 70 parts per trillion to 100 ppb in both samples. These results demonstrate that amines and amino acids can be extracted from sulfate-rich soils, such as jarosite, and analyzed by using the MOD-MOA instrumentation. Because these terrestrial amino acids were expected (and found by HPLC) to be predominantly homochiral (l), chiral CE analysis was not performed.
Our analysis of the aqueous extracts of the jarosite samples illustrates two key points. First, the MOA results and the traditional HPLC amino acid analyses are completely consistent. In most cases, the values agreed to within 10–30%; when larger deviations were observed, they resulted from the resolution of interfering species by the MOA that could not be resolved with HPLC. Second, there are significant differences in the extraction/derivatization efficiencies of the aqueous and sublimation techniques. Depending on the amino acid, sublimation can be up to 1000-fold less efficient than aqueous extraction. This reduction is most likely intrinsic to the sublimation process itself, because the natural sample matrix can form ionic bonds with acidic amino acids (21), and alanine and glycine can decompose to form methyl and ethylamine. Finally, the vapor pressure of valine is up to 3-fold greater than that of the other amino acids (28) potentially explaining its enhanced relative appearance. The extraction efficiencies can be significantly improved by performing a subcritical water extraction to isolate the amino acids from the background matrix before sublimation (29).
The results presented here advance the technology readiness of the MOA by performing laboratory and field analyses of relevant samples from and in Mars-like sites. We have demonstrated parts-per-trillion limits of detection and have successfully detected and analyzed amino acids from soils considered to be at the dry limit of microbial survival on Earth (6). The MOA has also been successfully field tested on soils containing jarosite, a sulfate-rich mineral recently detected on Mars. The MOA is currently in development for the European Space Agency Exo-Mars mission as a component of the Mars Astrobiology Probe (http://astrobiology.berkeley.edu).
Acknowledgments
Microfabricated devices were constructed in the University of California, Berkeley, Microfabrication Facility. We thank Henry Chan, the Chemistry Electronics Shop, and the Chemistry Machine Shop (University of California, Berkeley) for help in constructing the portable analysis instrument; Ron Amundson for introducing the Panoche Valley site; and Rafael Navarro-Gonzalez (Universidad Nacional Autónoma de Mexico, Mexico City, Mexico) for providing the Atacama samples. This research was supported by National Aeronautics and Space Administration Grant NNG04GB75G, National Aeronautics and Space Administration–University of California at San Diego Grant NAG512139, and by a Jet Propulsion Laboratory Fabrication Award. P.E. was supported by Netherlands Organization for Scientific Research VI Grant 016.023.003. A.M.S. was supported in part by an National Sciences and Engineering Research Council of Canada Postgraduate Scholarship B.
This paper was submitted directly (Track II) to the PNAS office.
Abbreviations: CE, capillary electrophoresis; MOA, Mars Organic Analyzer; PDMS, polydimethylsiloxane; TEC, thermoelectric cooler; ddH2O, doubly distilled water; MOD, Mars Organic Detector; S/N, signal-to-noise ratio; ppb, parts per billion.
References
- 1.Bada, J. L. (2001) Proc. Natl. Acad. Sci. USA 98, 797–800. [DOI] [PMC free article] [PubMed] [Google Scholar]
- 2.Malin, M. C. & Edgett, K. S. (2003) Science 302, 1931–1934. [DOI] [PubMed] [Google Scholar]
- 3.Squyres, S. W., Arvidson, R. E., Bell, J. F., Brückner, J., Cabrol, N. A., Calvin, W., Carr, M. H., Christensen, P. R., Clark, B. C., Crumpler, L., et al. (2004) Science 306, 1698–1703. [DOI] [PubMed] [Google Scholar]
- 4.Biemann, K., Oro, J., Toulmin, P., Orgel, L. E., Nier, A. O., Anderson, D. M., Simmonds, P. G., Flory, D., Diaz, A. V., Rushneck, D. R., et al. (1977) J. Geophys. Res. 82, 4641–4658. [Google Scholar]
- 5.Benner, S. A., Devine, K. G., Matveeva, L. N. & Powell, D. H. (2000) Proc. Natl. Acad. Sci. USA 97, 2425–2430. [DOI] [PMC free article] [PubMed] [Google Scholar]
- 6.Navarro-Gonzalez, R., Rainey, F. A., Molina, P., Bagaley, D. R., Hollen, B. J., de la Rosa, J., Small, A. M., Quinn, R. C., Grunthaner, F. J., Caceres, L., et al. (2003) Science 302, 1018–1021. [DOI] [PubMed] [Google Scholar]
- 7.Glavin, D. P., Schubert, M., Botta, O., Kminek, G. & Bada, J. L. (2001) Earth Planet. Sci. Lett. 185, 1–5. [Google Scholar]
- 8.Auroux, P. A., Iossifidis, D., Reyes, D. R. & Manz, A. (2002) Anal. Chem. 74, 2637–2652. [DOI] [PubMed] [Google Scholar]
- 9.Paegel, B. M., Emrich, C. A., Wedemayer, G. J., Scherer, J. R. & Mathies, R. A. (2002) Proc. Natl. Acad. Sci. USA 99, 574–579. [DOI] [PMC free article] [PubMed] [Google Scholar]
- 10.Lagally, E. T., Scherer, J. R., Blazej, R. G., Toriello, N. M., Diep, B. A., Ramchandani, M., Sensabaugh, G. F., Riley, L. W. & Mathies, R. A. (2004) Anal. Chem. 76, 3162–3170. [DOI] [PubMed] [Google Scholar]
- 11.Hutt, L. D., Glavin, D. P., Bada, J. L. & Mathies, R. A. (1999) Anal. Chem. 71, 4000–4006. [DOI] [PubMed] [Google Scholar]
- 12.Harrison, D. J., Fluri, K., Seiler, K., Fan, Z. H., Effenhauser, C. S. & Manz, A. (1993) Science 261, 895–897. [DOI] [PubMed] [Google Scholar]
- 13.Skelley, A. M. & Mathies, R. A. (2003) J. Chromatogr. 1021, 191–199. [DOI] [PubMed] [Google Scholar]
- 14.Grover, W. H., Skelley, A. M., Liu, C. N., Lagally, E. T. & Mathies, R. A. (2003) Sens. Actuators B 89, 315–323. [Google Scholar]
- 15.Simpson, P. C., Woolley, A. T. & Mathies, R. A. (1998) J. Biomed. Microdevices 1, 7–26. [Google Scholar]
- 16.Kvenvolden, K. A., Peterson, E. & Brown, F. S. (1970) Science 169, 1079–1082. [DOI] [PubMed] [Google Scholar]
- 17.Amelung, W. & Zhang, X. (2001) Soil Biol. Biochem. 33, 553–562. [Google Scholar]
- 18.Zhao, M. & Bada, J. L. (1995) J. Chromatogr. A 690, 55–63. [DOI] [PubMed] [Google Scholar]
- 19.Strawn, D., Doner, H., Zavarin, M. & McHugo, S. (2002) Geoderma 108, 237–257. [Google Scholar]
- 20.Kminek, G., Bada, J. L., Botta, O., Glavin, D. P. & Grunthaner, F. (2000) Planet. Space Sci. 48, 1087–1091. [Google Scholar]
- 21.Glavin, D. P. & Bada, J. L. (1998) Anal. Chem. 70, 3119–3122. [DOI] [PubMed] [Google Scholar]
- 22.McKay, D. S., Gibson, E. K., Thomas-Keprta, K. L., Vali, H., Romanek, C. S., Clemett, S. J., Chillier, X. D. F., Maechling, C. R. & Zare, R. N. (1996) Science 273, 924–930. [DOI] [PubMed] [Google Scholar]
- 23.Bada, J. L., Glavin, D. P., McDonald, G. D. & Becker, L. (1998) Science 279, 362–365. [DOI] [PubMed] [Google Scholar]
- 24.McKay, C. P., Friedmann, E. I., Frankel, R. B. & Bazylinsky, D. A. (2003) Astrobiology 3, 263–270. [DOI] [PubMed] [Google Scholar]
- 25.Cady, S. L., Farmer, J. D., Grotzinger, J. P., Schopf, J. W. & Steele, A. (2003) Astrobiology 3, 351–368. [DOI] [PubMed] [Google Scholar]
- 26.Effenhauser, C. S., Manz, A. & Widmer, H. M. (1993) Anal. Chem. 65, 2637–2642. [Google Scholar]
- 27.McKay, C. P., Friedmann, E. I., Gomez-Silva, B., Caceres-Villanueva, L., Andersen, D. T. & Landheim, R. (2003) Astrobiology 3, 393–406. [DOI] [PubMed] [Google Scholar]
- 28.Svec, H. J. & Clyde, D. D. (1965) J. Chem. Eng. Data 10, 151–152. [Google Scholar]
- 29.Yoshida, H., Terashima, M. & Takahashi, Y. (1999) Biotechnol. Prog. 15, 1090–1094. [DOI] [PubMed] [Google Scholar]


