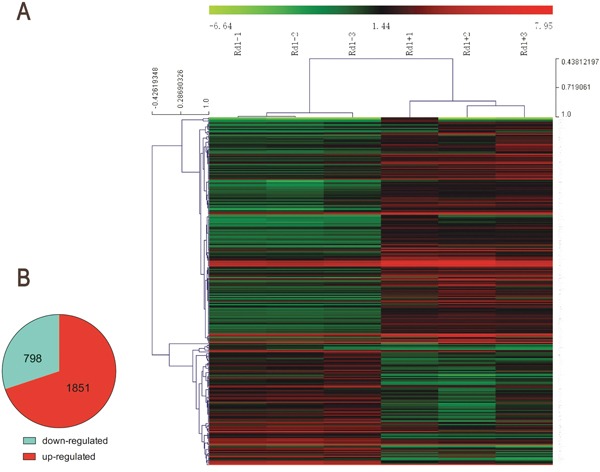
Figure 7. Microarray analysis of T0 affected gene expression in rd1 mice retina at P14.

(A) Heat map of the top 296 differentially expressed genes (intensity D-value>2100) in 6 rd1 mice exposed to T0 or vehicle as determined by microarray analysis. Red: up-regulation; green: down-regulation. (B) Total differentially expressed genes (P≤0.05, absolute fold change≥|±1|).
