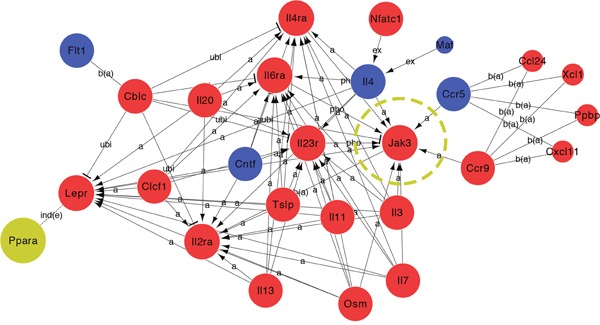
Figure 9. Global Signal Transduction Network analyses of DEGs in the JAK-STAT pathway in the retina of T0 treated rd1 mice at P14.

27 DEGs were analyzed by global signal transduction network. Expression levels were shown in blue (down-regulated) and red (up-regulated) while PPAR gene expression didn't get significantly changed. JAK3 plays an important role and carried a strong capability of mediating in the activated pathway.
