Abstract
The formation of bovine skeletal muscle involves complex developmental and physiological processes that play a vital role in determining the quality of beef; however, the regulatory mechanisms underlying differences in meat quality are largely unknown. We conducted transcriptome analysis of bovine muscle tissues to compare gene expression profiles between embryonic and adult stages. Total RNAs from skeletal muscle of Qinchuan cattle at fetal and adult stages were used to construct libraries for Illumina next-generation sequencing using the Ribo-Zero RNA sequencing (RNA-Seq) method. We found a total of 19,695 genes to be expressed in fetal and adult stages, whereby 3,299 were expressed only in fetal, and 433 only in adult tissues. We characterized the role of a candidate gene (GosB), which was highly (but differentially) expressed in embryonic and adult skeletal muscle tissue. GosB increased the number of myoblasts in the S-phase of the cell cycle, and decreased the proportion of cells in the G0/G1 phase. GosB promoted the proliferation of myoblasts and protected them from apoptosis via regulating Bcl-2 expression and controlling the intracellular calcium concentration. Modulation of GosB expression in muscle tissue may emerge as a potential target in breeding strategies attempting to alter myoblast numbers in cattle.
Keywords: bovine, muscle, RNA-seq, GosB, apoptosis
INTRODUCTION
The development and growth of skeletal muscle-the primary target of agricultural meat production-is a complex process, and the regulatory mechanisms underlying differences in meat quality are still poorly understood [1, 2]. During prenatal and very early postnatal development, muscle growth in vertebrates depends on an increasing number of muscle fibers (hyperplasia) [3, 4]. Once that growth phase has been completed, numbers of fibers remain constant, but the fiber volume continues to increase (hypertrophy) [3, 4]. As a matter of course, these processes influence the meat quality of livestock [1, 5]. Domestication of wild bovids and subsequent selection for desirable phenotypic traits, crossing, and inbreeding, have led to dramatic phenotypic differences between breeds, with some cattle breeds being optimized for meat or milk production, while others were selected for labor purposes. Our current study was motivated by current problems of the Chinese beef cattle industry that faces problems as numerous traditional Chinese cattle breeds were originally used for labor purposes rather than mean production [2]. Here, we take a first step to explore developmental genetic mechanisms underlying the remarkably high meat quality of Qinchuan cattle. This breed ranks among the top five Chinese yellow cattle breeds in terms of meat quality with a high muscle fat content [2, 6]. It also shows a high tolerance to roughage feeding and general stress resistance [2, 6]. High-throughput RNA sequencing (RNA-Seq) provides a powerful tool to identify genomic variation that is associated with divergent phenotypic traits and thus, allows insights into the molecular mechanisms underlying the domestication process [2, 7]. In this study, we used the Ribo-Zero RNA-Seq method—a novel technology that can capture both coding RNA and noncoding RNA from intact or fragmented RNA samples [8, 9]—to compare whole transcriptomes of bovine embryonic and adult skeletal muscle tissue in unprecedented depth. Our study may serve as a starting point for future research programs comparing different breeds or breeding stocks.
In the second part of our study, we focused on GosB, which was found to be highly (but differentially) expressed in embryonic and adult skeletal muscle tissue (see Results), as a candidate gene and explored its role in cattle muscle development. The activator protein 1 (AP-1) family of transcription factors comprises various combinations of Fos (Fos, GosB, Fra-1, and Fra-2) and Jun proteins (c-Jun, JunB, and JunD) which upon dimer formation regulate myoblast differentiation and influence adipocyte commitment [10, 11]. The AP-1 transcription complex was shown to be involved in muscle differentiation: myocyte enhancer factor 2 (MEF2) is expressed during muscle differentiation and activates the transcription of the c-Jun promoter, which dimerizes with Fra-2. The resulting heterodimer activates the transcription of structural ‘muscle genes’ and myogenic regulatory factors, such as MyoD [12]. Although GosB, as another protein contained in members of the AP-1 family, was found to be highly expressed in bovine skeletal muscle, whether and how GosB plays a role during bovine muscle development is currently not well understood. In GosB transgenic mice, GosB stimulates fibroblast proliferation and cell cycle progression by directly or indirectly inducing cyclin D1 transcription [13]. The GosB products, especially ΔGosB, appear to regulate cell proliferation, cell differentiation and cell death in rat embryo cell [14–16]. For instance, ΔGosB overexpression activates the proliferation of quiescent Rat-a cells to exit the G1-phase and initiate DNA replication, and induces delayed apoptosis in Rat-a cells dependent on regulating the release of mitochondrial cytochrome c followed by the activation of Caspase-9 and -3 [16]. These observations suggest that GosB has anti-apoptotic and proliferation-enhancing effects, thus regulating cell survival. However, the roles of GosB in regulating bovine myoblast proliferation and apoptosis are poorly understood.
In this study, an extensive and reliable transcriptomic dataset was obtained from embryonic and adult skeletal muscle samples of Qinchuan cattle using the Ribo-Zero RNA-Seq approach. The high-quality sequence data allowed us to identify candidate genes related to muscle development in cattle. We also performed Gene Ontology (GO) analysis and compared differentially regulated genes to genes annotated in the Kyoto Encyclopedia of Genes and Genomes (KEGG) to explore interactions and reaction networks of those genes. We then focused on GosB as a candidate gene to explore its role in myoblast proliferation and apoptosis. We found that GosB promoted myoblasts proliferation and protected the cells from apoptosis by regulating the intracellular calcium concentration. Our study will provide new insights into the genetic mechanisms underlying the exceptional meat quality of Qinchuan cattle, and also provides a foundation to further improve the meat quality of Qinchuan cattle and other Chinese cattle breeds.
RESULTS
Gene expression profiles of bovine muscle tissue at different developmental stages
In total, we obtained 73,229,494 to 89,035,574 and 64,312,418 to 105,185,382 clean reads from the libraries from embryonic tissues (n = 3) and tissues from adult cattle (n = 3), respectively. Filtering and removal of sequence reads with adapters and low quality reads resulted in 50-62 and 54-89 million mapped clean reads, respectively (Table 1). The proportion of mapped sequence reads aligned to exonic regions was markedly lower in embryonic samples (54.5%) than in adult samples (92.2%). Conversely, the percentage of mapped reads aligned to intron regions was dramatically higher at the embryonic stage (29.2%) compared to the adult stage (3.3%; Figure 1a).
Table 1. Summary of reads mapping to the bovine reference genome.
| Samples | Embryo1 | Embryo2 | Embryo3 | Adult1 | Adult2 | Adult3 |
|---|---|---|---|---|---|---|
| Raw reads | 111,340,382 | 106,866,166 | 134,501,982 | 139,160,360 | 101,780,186 | 101,084,070 |
| Clean reads | 80,480,570 | 73,229,494 | 89,035,574 | 105,185,382 | 64,312,418 | 68,886,634 |
| Mapped reads | 54,979,060 | 49,922,182 | 62,333,225 | 88,546,667 | 53,810,383 | 58,188,271 |
| Mapping ratio | 68.31% | 68.17% | 70.01% | 84.18% | 83.67% | 84.47% |
| Uniquely mapped reads | 50,334,911 | 45,233,401 | 57,170,376 | 86,082,724 | 52,330,653 | 56,687,937 |
| Uniquely mapping ratio | 62.54% | 61.77% | 64.21% | 81.84% | 81.37% | 82.29% |
Figure 1. Features of unigenes in bovine muscle tissue.
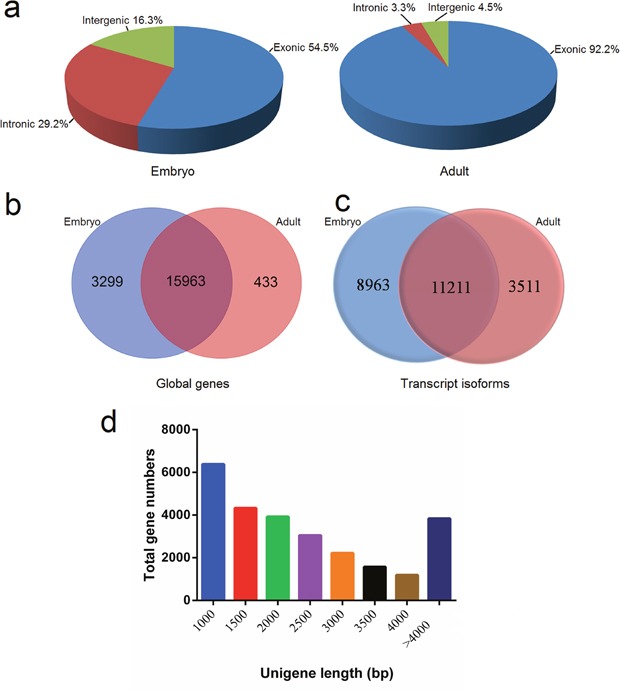
(a) Genomic origin of bovine muscle unigenes at embryonic and adult stages; Venn diagram of globally transcribed genes (b) and transcript isoforms (c) expressed at two developmental stages; (d) Size distribution of the unigenes.
We found a total of 19,695 genes to be expressed in both the embryo and adult stages, while 3,299 and 433 genes were present only in embryonic and adult stages, respectively (Figure 1b). While the term “gene” conventionally refers to cases of one or a few transcript isoforms that share mature spliced exons, the term “transcript” means any genomic locus transcribed into RNA molecules. Isoforms from the same gene encoding different proteins can have specific functions in the spatio-temporal regulation of developmental processes [8]. In this study, 23,685 transcript isoforms were detected, and 20,174, and 14,722 transcripts were present in the embryonic and adult samples, respectively. Moreover, 8,963, and 3,511 transcripts were specific to the embryonic and adult stages, respectively (Figure 1c). The length of unigenes in this study was assessed through by the following standard metrics: minimum length, maximum length, mean length, median length, N50-value, and total length (Table 2). The average length of unigenes was 2,373 bp, while the median length was 1,808 bp. The size distribution is shown in Figure 1d; we found that the size of most genes was no more than 3,000 bp.
Table 2. Assembly results of unigenes.
| Item | Unigene | Min length | Mean length | Median length | N50 | Max length | Total length |
|---|---|---|---|---|---|---|---|
| Numeber | 19,695 | 201 | 2,373 | 1,808 | 3,166 | 103,350 | 62,870,079 |
Alternative splicing (AS) generates complex proteomes and thus, plays a vital role in the mammalian development and growth [8]. We analyzed alternative splicing dynamics using ASprofile and detected 57,184 to 58,393 and 55,632 to 57,859 splicing events in the libraries from embryonic and adult developmental stages, respectively (Table 3). To further elucidate the mechanisms of alternative splicing, all splicing events were divided into 12 different types, including exon skipping (SKIP) and cassette exons (MSKIP), retention of single (IR) and multiple (MIR) introns, alternative exon ends (AE), alternative transcription start sites (TSS), alternative transcription termination site (TTS), and so forth. Notably, TSS and TTS were the dominant mechanisms of alternative splicing (> 70% of cases) in both embryonic and adult samples.
Table 3. Types and numbers of different alternative splicing events.
| AS category | Embryo 1 | Embryo 2 | Embryo 3 | Adult 1 | Adult 2 | Adult 3 |
|---|---|---|---|---|---|---|
| AE | 2,443(4.18%) | 1,996(3.49%) | 2,267(3.89%) | 2,772(4.78%) | 2,597(4.65%) | 2,551(4.59%) |
| IR | 1,798(3.09%) | 1,968(3.44%) | 1,720(2.95%) | 918(1.59%) | 774(1.39%) | 678(1.22%) |
| MIR | 258(0.44%) | 322(0.56%) | 301(0.52%) | 81(0.14%) | 64(0.11%) | 76(0.14%) |
| MSKIP | 1,037(1.78%) | 872(1.52%) | 949(1.63%) | 1,256(2.17%) | 1,185(2.12%) | 1,200(2.16%) |
| SKIP | 5,040(8.63%) | 4,200(7.34%) | 5,068(8.69%) | 6,680(11.55%) | 6,454(11.56%) | 6,506(11.69%) |
| TSS | 23,592(40.4%) | 23,413(40.94%) | 23,760(40.73%) | 22,616(39.09%) | 21,879(39.18%) | 21,799(39.18%) |
| TTS | 21,266(36.42%) | 21,557(37.70%) | 21,349(36.60%) | 20,609(35.62%) | 20,179(36.13%) | 20,130(36.18%) |
| XAE | 510(0.87%) | 504(0.88%) | 516(0.88%) | 511(0.88%) | 491(0.88%) | 462(0.83%) |
| XIR | 452(0.77%) | 515(0.91%) | 445(0.76%) | 328(0.57%) | 288(0.52%) | 277(0.50%) |
| XMIR | 110(0.19%) | 106(0.19%) | 118(0.20%) | 74(0.13%) | 59(0.11%) | 64(0.12%) |
| XMSKIP | 703(1.2%) | 655(1.15%) | 682(1.17%) | 711(1.23%) | 658(1.18%) | 669(1.20%) |
| XSKIP | 1,184(2.03%) | 1,076(1.88%) | 1,159(1.98%) | 1,303(2.25%) | 1,219(2.17%) | 1,220(2.19%) |
| Total | 58,393(100%) | 57,184(100%) | 58,334(100%) | 57,859(100%) | 55,847(100%) | 55,632(100%) |
Identification of differentially expressed genes
A clustered heatmap of differentially expressed genes along with a Pearson correlation is shown in Figure 2a. To further explore the potential functions of differentially expressed genes, we compared transcript abundances of both developmental stages using a scatter plot (Figure 2b). Pairwise comparison of gene abundances during muscle development exhibited that several genes showed variation in expression patterns, and many genes were more expressed at the embryonic stage.
Figure 2. Differentially expressed genes in bovine muscle tissues.
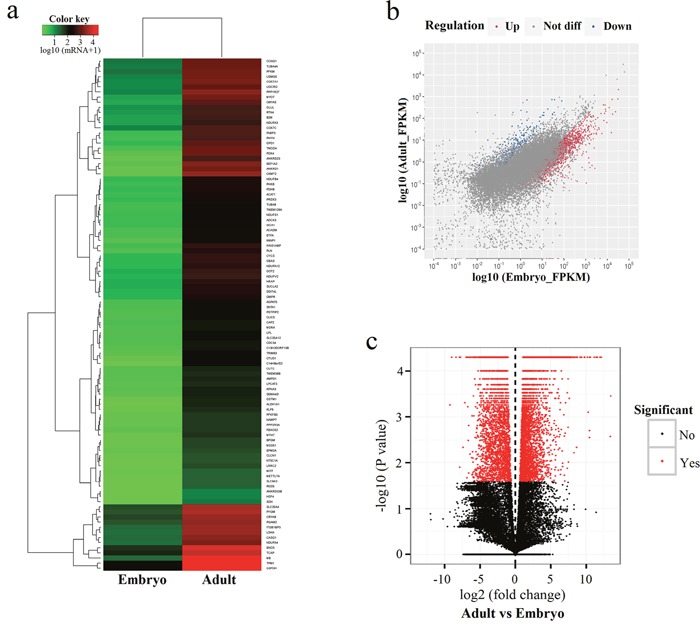
(a) Heat map of 100 most differentially expressed genes comparing embryonic and adult stages; (b) Scatter plot showing the correlation of gene expression levels between embryonic and adult stages; (c) Volcano plots were constructed using fold-change values and p-values. Vertical lines correspond to 2-fold up- and down-regulation when comparing the two developmental stages.
We found 5,288 unigenes to be significantly differently expressed (P < 0.05) at the embryonic and adult stages; all differentially expressed genes are provided in Supplementary Table 2. 4,766 unigenes were up-regulated in samples from adult tissues compared to embryonic samples, while 482 unigenes were down-regulated with at least 2 fold-change in expression levels (Figure 2c). The top 10 unigenes that were up-regulated at the adult stage compared to the embryonic stage are exhibited in Table 4 (FPKM > 2). XLOC_276182 (CKMT2) was the most up-regulated unigene (5,299.06-fold increase in expression at the adult stage compared to the embryonic stage), followed by XLOC_194704 (ANKRD1, 2,846.84-fold increase) and XLOC_054863 (EEF1A2, 2,813.28-fold increase). The top 10 down-regulated differentially expressed genes are shown in Table 5 (FPKM > 2). The most strongly down-regulated unigene was XLOC_119825 (MYL4, 223.38-fold decreas at the adult stage compared to the embryonic stage), followed by XLOC_309473 (ARHGAP36, 106.72-fold decrease). The up-regulated differentially expressed gene with the highest overall level of expression (FPKM = 62083.6) was XLOC_170404 (7SK) with a 4.54-fold increase in expression levels in adult samples, and the down-regulated differentially expressed gene with the highest overall expression level (FPKM = 733.7) was IGF2 with a 26.33-fold decrease in expression levels (Table 6).
Table 4. The top 10 up-regulated unigenes at the adult stage compared to the embryonic stage.
| ID | Annotatedgene | Adult (FPKM) | Embryo (FPKM) | log2(Adult/Embryo) | P-value |
|---|---|---|---|---|---|
| XLOC_276182 | CKMT2 | 2651.44 | 0.5 | 12.37 | 5.00E-05 |
| XLOC_194704 | ANKRD1 | 1571.17 | 0.55 | 11.48 | 5.00E-05 |
| XLOC_054863 | EEF1A2 | 1951.63 | 0.69 | 11.46 | 5.00E-05 |
| XLOC_239696 | PDK4 | 1414.15 | 0.93 | 10.58 | 5.00E-05 |
| XLOC_035593 | ANKRD23 | 689.5 | 0.564 | 10.26 | 5.00E-05 |
| XLOC_219156 | TMOD4 | 1370.27 | 1.54 | 9.8 | 5.00E-05 |
| XLOC_065922 | C14H8orf22 | 157.43 | 0.18 | 9.75 | 5.00E-05 |
| XLOC_255920 | MB | 15279.7 | 22.31 | 9.42 | 5.00E-05 |
| XLOC_253590 | GPD1 | 1065.89 | 2.87 | 8.54 | 5.00E-05 |
| XLOC_293784 | ALDH1A1 | 86.81 | 0.24 | 8.53 | 5.00E-05 |
Table 5. The top 10 down-regulated unigenes at the adult stage compared to the embryonic stage.
| ID | Annotatedgene | Adult (FPKM) | Embryo (FPKM) | log2(Adult/Embryo) | P-value |
|---|---|---|---|---|---|
| XLOC_119825 | MYL4 | 1.05 | 233.53 | -7.8 | 5.00E-05 |
| XLOC_309473 | ARHGAP36 | 0.41 | 43.52 | -6.74 | 5.00E-05 |
| XLOC_155395 | DLK | 1.93 | 195.27 | -6.66 | 5.00E-05 |
| XLOC_088458 | TNNT2 | 1.16 | 58.21 | -5.66 | 5.00E-05 |
| XLOC_213774 | IGF2 | 27.87 | 733.7 | -4.72 | 5.00E-05 |
| XLOC_255105 | ERBB3 | 0.4 | 12.26 | -4.93 | 5.00E-05 |
| XLOC_251201 | CSDC2 | 0.35 | 10.59 | -4.93 | 5.00E-05 |
| XLOC_177794 | EMILIN2 | 1.36 | 28.99 | -4.41 | 5.00E-05 |
| XLOC_096537 | SFRP2 | 1.06 | 21.77 | -4.37 | 5.00E-05 |
| XLOC_024754 | ACTC1 | 36.67 | 724.14 | -4.3 | 5.00E-05 |
Table 6. Differentially and highly expressed genes when comparing embryonic and adult libraries.
| ID | Annotatedgene | Adult (FPKM) | Embryo (FPKM) | log2(Adult/Embryo) | P-value |
|---|---|---|---|---|---|
| XLOC_170404 | 7SK | 62083.6 | 13662.7 | 2.18396 | 5.00E-05 |
| XLOC_063137 | TNNC2 | 32411.3 | 2099.25 | 3.94855 | 5.00E-05 |
| XLOC_185879 | MYLPF | 30372.1 | 783.96 | 5.27582 | 5.00E-05 |
| XLOC_025282 | Metazoa_SRP | 28180.9 | 6347.16 | 2.15053 | 5.00E-05 |
| XLOC_025489 | TPM1 | 23600.8 | 199.54 | 6.89 | 5.00E-05 |
| XLOC_257641 | G3PDH | 17280.7 | 156.07 | 6.79 | 5.00E-05 |
| XLOC_217773 | TNNI2 | 16670 | 746.27 | 4.48 | 5.00E-05 |
| XLOC_255920 | MB | 15279.7 | 22.31 | 9.42 | 5.00E-05 |
| XLOC_213774 | IGF2 | 27.87 | 733.70 | -4.72 | 5.00E-05 |
| XLOC_024754 | ACTC1 | 36.67 | 724.14 | -4.30 | 5.00E-05 |
| XLOC_123373 | MYHC-EMBRYONIC | 1.97 | 703.29 | -8.48 | 2.95E-03 |
| XLOC_233524 | COL1A2 | 78.7 | 630.20 | -3 | 5.00E-05 |
| XLOC_174413 | HIST1H3A | 18.07 | 273.35 | -3.92 | 5.00E-05 |
| XLOC_119825 | MYL4 | 1.05 | 233.53 | -7.8 | 5.00E-05 |
| XLOC_155395 | DLK | 1.93 | 195.27 | -6.66 | 5.00E-05 |
| XLOC_213707 | CDKN1C | 35.09 | 186.9 | -2.41 | 5.00E-05 |
Delineation of GO and KEGG pathway analysis
We performed GO enrichment analysis to further investigate the potential functions of differentially expressed genes in regulating muscle development. In this study, GO enrichment of significantly differentially expressed genes was categorized into 597 functional groups (P < 0.05). 157 terms were significantly enriched in ‘molecular function’ (Supplementary Table 3), and the most significantly enriched GO term was ‘structural constituent of ribosome’ (GO: 0003735) with 128 annotated genes, followed by ‘RNA binding’ (GO: 0003723) and ‘protein binding’ (GO: 0005515). In the GO category ‘cellular component’, 153 terms were significantly enriched (Supplementary Table 4). The most significantly enriched GO term was ‘cytoplasm’ (GO: 0005737) with 1,424 annotated genes, followed by ‘mitochondrial inner membrane’ (GO: 0005743), ‘ribonucleoprotein complex’ (GO: 0030529), and ‘translation’ (GO:0006412). 287 GO terms were significantly enriched in ‘biological processes’ and were related to various processes (Supplementary Table 5) such as ‘oxidation-reduction process’ (GO: 0055114), ‘mRNA processing’ (GO: 0006397), and ‘rRNA processing’ (GO: 0006364). The top 20 functional GO annotations for the differentially expressed genes detected in our study are shown in Figure 3a.
Figure 3. The top 20 Gene Ontology (GO) and Kyoto Encyclopedia of Genes and Genomes pathways (KEGG) of the differentially expressed genes detected in our present study.
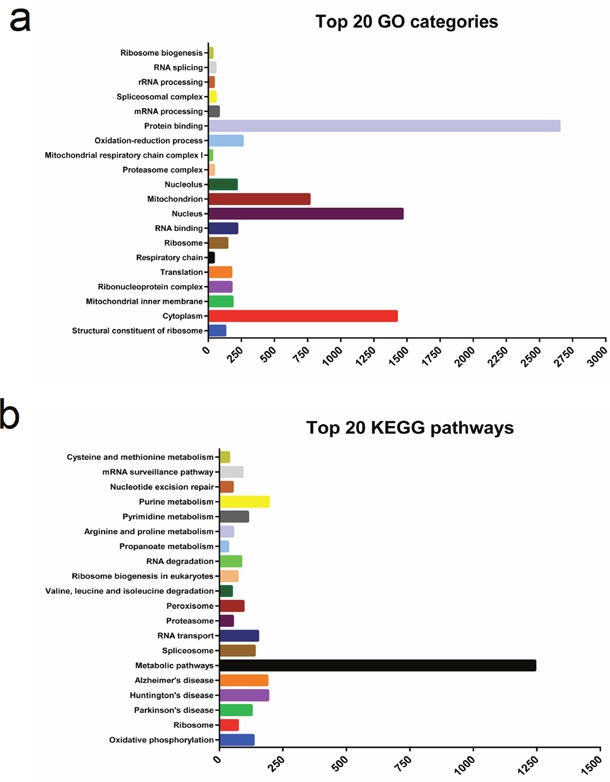
We used KEGG pathway enrichment analysis to shed additional light on the biological functions and molecular interactions of differentially expressed genes. We found 224 pathways to be significantly enriched, and the highest level of significance was found for ‘oxidative phosphorylation’ (ko00190) with 95 annotated genes, followed by ‘Ribosome’ (ko03010, 60 genes) and ‘Parkinson's disease’ (ko05012, 85 genes). The top 20 significantly enriched KEGG pathways are shown in Figure 3b. Our results suggest that these pathways may be involved in the development and growth of skeletal muscle.
Identification of GosB as a candidate gene
Based on the analyses of both GO terms and KEGG pathways, several differentially expressed genes were significantly enriched (P < 0.0001) in the process of muscle development (GO: 0006936, GO: 0014733, GO: 0014809, GO: 0048738, ko04260, ko04270). According to these results, we randomly selected 16 differentially expressed genes that exhibited highly significantly different expression levels in the two developmental stages of bovine muscle tissue (COL4A2, ACTC1, IGF2, MAGED1, GosB, MYF6, FABP3, TNNT1, RPS15A, MYOG, COX7A1, ACTN2, PDLIM1, MAP2K6, CALM, HSPB6; Figure 4a). Moreover, the proliferation and differentiation of myoblasts are fundamental processes of skeletal muscle formation. Hence, we also analyzed genes related to muscle cell proliferation and differentiation, and found 46 genes to exhibit significantly different expression levels when comparing the two developmental stages (Supplementary Table 6). As can be seen Figure 4b, GosB was one of the most significantly differentially expressed genes. To confirm our RNA-Seq results, we performed quantitative real-time PCR (qPCR) to quantify the mRNA concentrations of GosB, MyoG and IGFBP3 at the embryonic and adult developmental stages (Figure 4c). We found the expression of GosB to be much higher (~4.7 fold) at the adult stage compared with the embryonic stage. Therefore, we chose GosB, which is known to be involved in cell proliferation, differentiation and apoptosis [13–15], as a candidate gene to further explore its role in cattle muscle development.
Figure 4. Identification of GosB as a candidate gene to explore its role in mammalian muscle development.
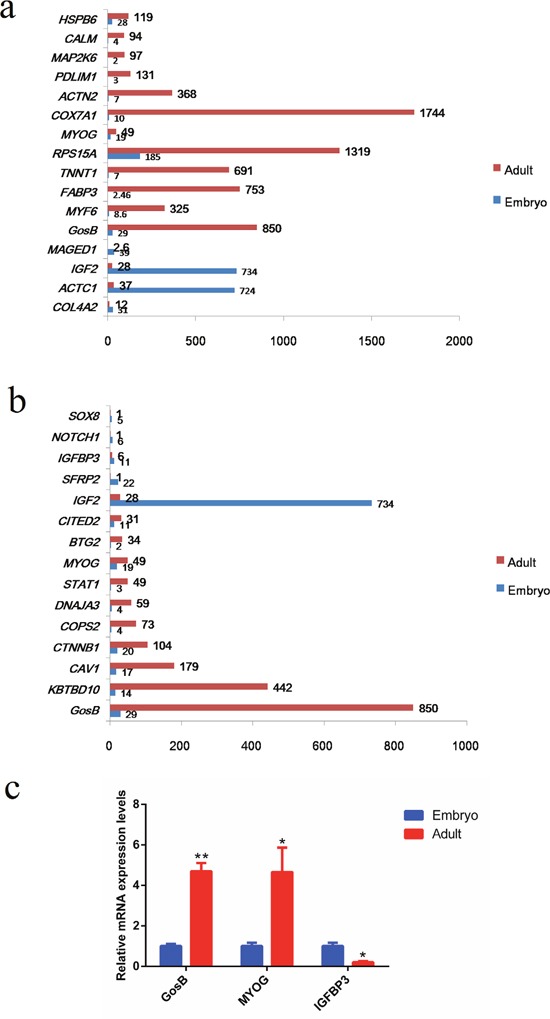
(a) The expression levels of 16 genes exhibited significantly different expression levels during bovine muscle development; (b) The expression levels of 16 genes exhibited significantly different expression about cell proliferation and differentiation; (c) Validation of different expression levels (mRNA concentrations) of GosB, MyoG and IGFBP3 by means of real-time PCR. *P < 0.05; **P < 0.01.
In order to understand the role of GosB in myoblast proliferation and differentiation, the GosB overexpression recombinant adenovirus Ad-GosB and interference recombinant adenovirus Ad-siGosB were constructed. The murine C2C12 myoblast cell line is a useful tool to study the proliferation and differentiation of myoblasts and to explore regulatory pathways [17]. When we investigated the localization of GosB in C2C12 cells, we found GosB to target to the cell nucleus, suggesting that it may act as a transcription factor (Figure 5a). GosB overexpression markedly increased the expression of GosB, and GosB expression was significantly reduced in cells transfected with Ad-siGosB (P < 0.01; Figure 5b).
Figure 5. Characterization of GosB in murine C2C12 myoblast.
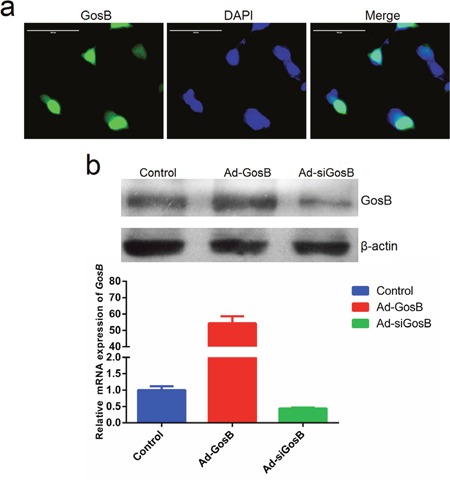
(a) Sub-cellular localization of GosB in C2C12 cells. Scale bar indicates 100 μm. (b) Relative mRNA levels of GosB in C2C12 cells transfected with Ad-GosB or Ad-siGosB for 48h, and representative image of western blot analysis.
Effects of GosB on myocyte differentiation and proliferation
To establish the involvement of GosB in myoblast differentiation, the expression of GosB was quantified in C2C12 cells and primary bovine myoblasts after differentiation had been induced for 0, 1, 2, 4, and 6 days. We found that GosB was down-regulated during myoblasts differentiation (Supplementary Figure 1). We used qPCR on mRNA extracted from cells transfected with Ad-GosB or Ad-siGosB to establish expression patterns of two marker genes of myoblast differentiation, MyoD and MHC. However, we found that the expression of both genes was not statistically different between treatment groups (P > 0.05, Supplementary Figure 1), suggesting that GosB is not directly involved in myoblast differentiation, and may rather regulate muscle cell proliferation to affect muscle development, as a cell survival-enhancing effect was also reported from other cell types [13–16].
To assess the role played by GosB during cell proliferation, we again pretreated C2C12 cells with Ad-GosB or Ad-siGosB. Cell cycle analysis revealed that GosB overexpression led to a higher number of C2C12 cells entering the S-phase, while decreasing the proportion of cells in the G0/G1 phase (Figure 6a, 6b). When GosB expression was knocked down by treatment with Ad-siGosB, the number of C2C12 cells in the G0/G1 phase was higher. We found Ad-siGosB to inhibit cell proliferation while GosB overexpression promoted cell proliferation according to the Cell Counting Kit-8 (CCK-8) and EdU incorporation assays (Figure 6c, 6d). We also found GosB inhibited cell proliferation in primary bovine myoblasts as demonstrated in C2C12 cells (Supplementary Figure 2).
Figure 6. Effects of GosB on aspects of the cell cycle and cell proliferation.
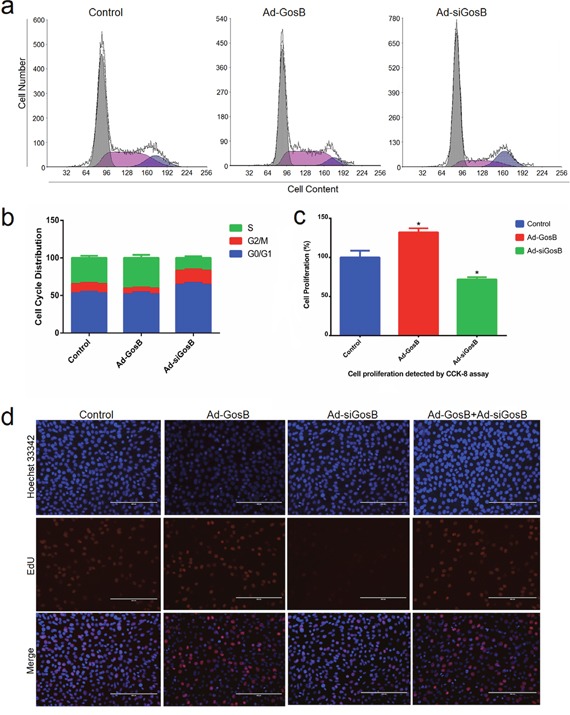
Murine C2C12 cells were transfected with Ad-GosB or Ad-siGosB for 48 h, and subsequently subjected to cell cycle assay using a flow cytometer and cell proliferation analysis using cell counting kit-8 (CKK-8) and EdU incorporation assays. Scale bar indicates 200 μm. *P < 0.05.
Effects of GosB on apoptosis of myocytes
FITC-AnnexinV/propidium iodide (PI) and Hoechst 33342/PI staining assays showed Ad-siGosB induced myoblasts apoptosis, while GosB overexpression protected cells from apoptosis (Figure 7 and Supplementary Figure 3). Thus, our results confirm that GosB has a survival-enhancing effect in C2C12 cells. Bcl-2 has been described as an anti-apoptotic protein, and plays important roles in regulating proliferation and apoptosis in myoblasts [18, 19]. We asked whether Bcl-2 is involved in the survival-enhancing effects of GosB in myoblast, and thus quantified the expression of Bcl-2 in C2C12 cells and primary bovine myoblasts pretreated with Ad-GosB or Ad-siGosB using qPCR. We found GosB to promote the expression of Bcl-2, and to significantly increase Bcl-xL expression while suppressing the expression of Bax and Bad (Figure 8a and Supplementary Figure 3). We also found GosB overexpression to lead to increase the Bcl-2/Bax and Bcl-xL/Bax ratios (Figure 8b). Moreover, we found GosB to result in increased CyclinD1 expression and to inhibit the expression of p53 and Caspase-3 (Figure 8c). Taken together, these observations suggest that the anti-apoptotic effect of GosB in myoblasts is mediated by the expression of Bcl-2.
Figure 7. Effects of GosB on cell apoptosis.
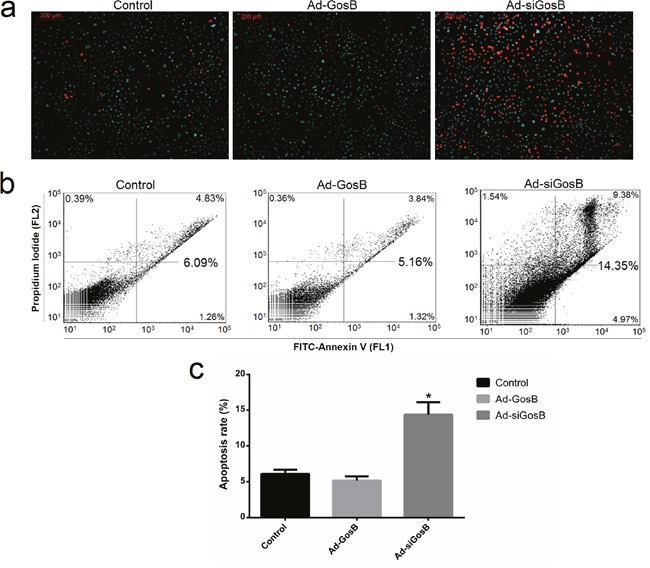
Cell apoptosis was determined by Hoechst 33342/PI dual staining assays (a) and Annexin V-FITC/PI binding followed by flow cytometry (b, c). Data are shown as means ± SEM for three individuals. *P < 0.05.
Figure 8. Effects of GosB on the expression of cell survival related genes in murine C2C12 cells.
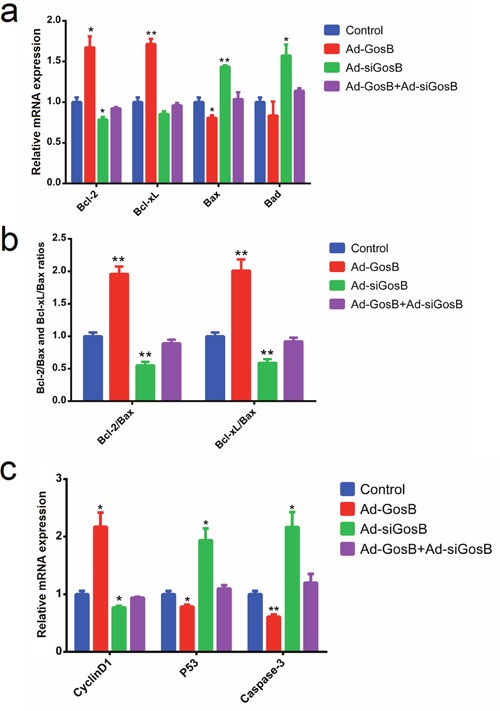
C2C12 cells were transfected with Ad-GosB or Ad-siGosB for 48 h, and mRNA levels of Bcl-2, Bcl-xL, Bax, Bad, CyclinD1, p53, Caspase3 analyzed by means of quantitative real time PCR (qPCR). Bcl-2/Bax and Bcl-xL/Bax ratios are also shown. Data are depicted as means ± SEM for three individuals. *P < 0.05; **P < 0.01.
Activation of intracellular Ca2+ triggers cellular dysfunction and cell death [20, 21], while GosB promotes calcium deposition [22, 23]. Thus we examined cytosolic and mitochondrial calcium levels in C2C12 cells after transfection with Ad-GosB or Ad-siGosB for 48 h. GosB was found to regulate cytosolic and mitochondrial Ca2+ concentrations in C2C12 cells (Figure 9a-9c). GosB overexpression decreased cytosolic and mitochondrial calcium concentrations. Ad-siGosB led to a transient increase in calcium concentrations, followed by a relatively long lasting calcium surge. Cell apoptosis induced by acute increases in intracellular Ca2+ concentration was abolished by GosB overexpression (Figure 9d, 9e). Calcium overload subsequently activated the apoptotic cascade as evidenced by the inhibition of Bcl-2 and activation of Bax (Figure 9f, 9g). These results demonstrate that GosB protects C2C12 cells from apoptosis by a Ca2+-sensitive mechanism.
Figure 9. GosB prevents mitochondrial calcium overload and subsequent apoptotic events.
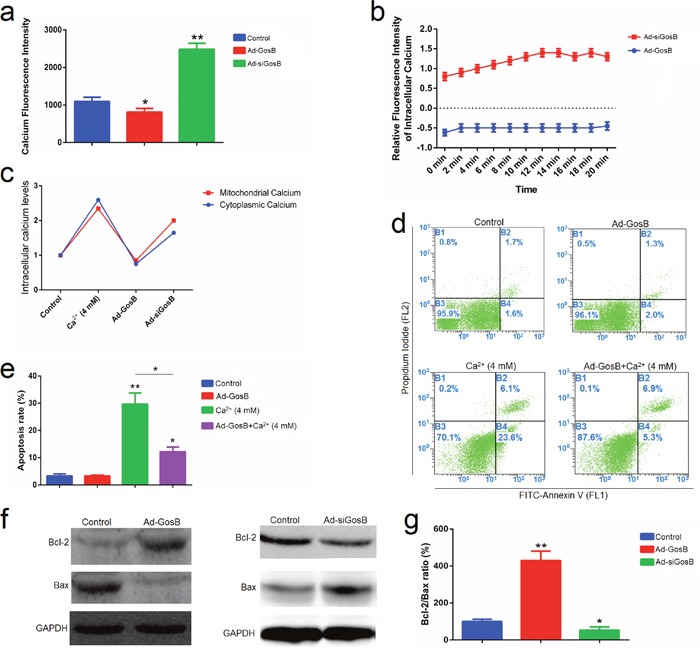
(a, b) Confocal laser scanning microscopic examination of C2C12 cells treated with Rhod-2 AM showing mitochondrial Ca2+; (c) Cytosolic and mitochondrial calcium modulation was studied using Fluo-3 AM and Rhod-2 AM, respectively, using flow cytometry; (d, e); C2C12 cells were transfected with Ad-GosB for 48 h, and subsequently exposed to 4 mM CaCl2 for 24 h. Cell apoptosis was determined by Annexin V-FITC/PI binding followed by flow cytometry; (f) Protein levels of Bcl-2 and Bax detected by Western blot analysis; (g) Bcl-2/Bax protein ratios. Values are means ± SEM for three individuals. *P < 0.05; **P < 0.01.
DISCUSSION
Comparative transcriptome analyses of tissues at different developmental stages can provide valuable insights into the question of how regulatory gene networks control specific biological processes and how diseases can arise [24, 25]. High-throughput sequencing has rapidly gained popularity for transcriptome analyses in domestic animals due to its sensitivity in detecting not only transcripts in general, but also mRNA isoforms, and to generate quantitative information on the expression levels of annotated genes [2, 4, 8, 26]. RNA-Seq libraries, polyA-Seq, and Ribo-Zero RNA-Seq are the most commonly employed methods to obtain transcriptomic information [25]. In this study, total RNAs from Qinchuan cattle skeletal muscle at fetal and adult stages were used to construct libraries for Illumina next-generation sequencing using the Ribo-Zero RNA sequencing (RNA-Seq) method. At present, Ribo-Zero RNA-Seq is the most sensitive method to study transcriptomes, particularly for cattle with only incompletely annotated genomes being available [8]. Compared with RNA-Seq and polyA-Seq, Ribo-Zero RNA-Seq can capture poly(A)-transcripts from intact and fragmented RNA, and the method appears to be highly technically reproducible [25, 27]. In cattle, muscle fiber numbers increase during prenatal and very early postnatal development, after which fiber numbers stop to increase, while fiber volume still increases [3, 4]. We assessed gene expression patterns at two different developmental stages to gain insights into the molecular mechanisms involved in mammalian skeletal muscle development [8] and later focused on the role of GosB in myocyte proliferation, differentiation, and apoptosis. GosB has been reported to regulate cell proliferation, differentiation and cell death [14–16]. For example, GosB protects rat embryo cells from apoptosis and thus, leads to increased cell survival. It seems that this effect is mediated by the action of GosB in the mitochondrial apoptotic pathway, which is dependent on Caspase-3 and -9 [16]. Consistent with this, GosB in our study promoted the proliferation of murine C2C12 cells and primary bovine myoblasts according to the CCK-8 and EdU incorporation assays. Furthermore, GosB protected myoblasts from apoptosis and increased Bcl-2 expression and decreased the expression of Bax and Caspase-3, suggesting that the survival-enhancing role of GosB in myoblasts is dependent on the expression of Bcl-2.
Calcium is a well-known intracellular messenger that modulates many aspects of cell life [28–30]. Intracellular Ca2+ accumulation activates the mitochondrial apoptotic pathway with high levels of Bax and activation of Caspase-3 [31–33]. GosB is known to function as a physiologically important regulator of osteoblast differentiation and increases bone formation and bone mass, leading to osteosclerosis [22, 23]. Therefore, we speculated that GosB may adopt its anti-apoptotic effect through regulating intracellular Ca2+ concentrations. This notion was supported by the results that GosB overexpression decreased the mitochondrial Ca2+ concentration (i.e., fluorescence intensity) at lower levels. Proteins in the Bcl-2 family play a vital role in controlling intracellular Ca2+ signals because of their ability to affect—either directly or indirectly—Ca2+ storage in the endoplasmic reticulum by interacting with the inositol 1,4,5-trisphosphate receptor [32, 34]. As an anti-apoptotic gene, Bcl-2 inhibits calcium release from the endoplasmic reticulum and mitochondrial calcium uptake, whereas Bax—a member of the pro-apoptotic Bcl-2 family—induces calcium release from the endoplasmic reticulum as well as mitochondrial Ca2+ uptake [31, 32, 35]. In our present study, GosB increased the expression of Bcl-2, inhibited cytosolic and mitochondrial calcium accumulation, and protected C2C12 cells from apoptosis induced by acute increases in intracellular Ca2+ concentrations. Therefore, our results suggest that GosB can promote myoblasts survival by regulating the intracellular Ca2+ concentration-dependent Bcl-2 expression.
In summary, we analyzed the expression profiles of cattle skeletal muscle tissue samples taken at embryonic and adult developmental stages. A large number of differentially expressed genes were detected when comparing both stages. We further characterized and functionally evaluated a differentially expressed gene, GosB. Our findings demonstrate for the first time that GosB promotes myoblast proliferation and protects the C2C12 cells from apoptosis by regulating intracellular calcium concentrations. Thus, modulation of GosB expression in muscle tissue may emerge as potent tool to control myoblast number in the cattle.
MATERIALS AND METHODS
Sample preparation
All Qinchuan cattle received humane care as described in the proclamation No. 5 of the Ministry of Agriculture, P.R. China. All experimental procedures used in this study were approved by the Animal Care and Use Committee of the Northwest A&F University. We collected six musculus longissimus tissue samples of Qinchuan cattle from two developmental states each (3 fetal samples, 90 days after fertilization, and 3 adult samples, 24 months after birth) from a local slaughterhouse in Xi’an, P.R. China. Tissue samples were snap-frozen in liquid nitrogen and stored at –80°C for RNA extraction.
Library preparation and Illumina sequencing
Total RNA of fetal and adult longissimus muscle was isolated using TRIzol reagent (Invitrogen, Carlsbad, CA, USA) following the manufacturer's instructions. We assessed total RNA yield by electrophoresis on a denaturing agarose gel and quantified RNA concentrations using a NanoDrop spectrophotometer (Nano-Drop Technologies, Wilmington, DE, USA) and Agilent 2100 Bioanalyzer. A total of 3 μg RNA per sample was treated with the epicentre Ribo-Zero™ Kit (Epicentre, Madison, WI, USA) to remove rRNA before constructing the RNA-seq libraries. Afterwards, the RNA samples were fragmented and used to synthesize first- and second-strand complementary DNA (cDNA) with random hexamer primers, dNTPs and DNA Polymerase I according to the manufacturer's manual. The cDNA fragments were cleaned and concentrated using AMPure XP beads (Beckman Coulter, Brea, CA, USA), then the ends were repaired and modified with T4 DNA polymerase and Klenow DNA polymerase to add a single A base and ligate the adapter at the 3′ end of the DNA fragments. The ligated cDNA products were purified with AMPure XP beads and treated with uracil DNA glycosylase (NEB, Ipswich, MA, USA) to remove the second-strand cDNA. Purified first-strand cDNA was enriched with 12 PCR cycles to create the final cDNA library. We checked the quality of the libraries using Agilent 2100 Bioanalyzer (Agilent, Santa Clara, CA) and sequenced them using Illumina HiSeq 2500 Technology (LC Sciences, Houston, TX, USA) with a 150 bp paired-end run.
Analysis of sequence data
From the raw FASTQ files, adapters were removed using Trim Galore (http://www.bioinformatics.babraham.ac.uk/projects/trim_galore/) and filtered data were aligned to the Bos taurus reference genome (bosTau7) from UCSC (http://genome.ucsc.edu/) with TopHat2 (version 2.0.14. Linux_x86_64) [36]. Assembly of linear transcripts and abundance estimations were performed using Cufflinks, which was outsourced to LC-Bio (Hangzhou, China). The assembled transcripts were mapped to the reference annotation using the program Cuffcompare (Cufflinks, v2.2.1) to detect novel genes. Transcript abundances were normalized as the number of uniquely mapped fragments per kilobase of exon per million fragments mapped (FPKM). The raw sequencing dataset supporting the results of this study were deposited at NCBI's Gene Expression Omnibus Database (http://www.ncbi.nlm.nih.gov/geo/). The data are accessible through GEO Series accession number GSE86847 (http://www.ncbi.nlm.nih.gov/geo/query/acc.cgi?acc=GSE86847).
Gene ontology and pathway analysis
We used GO analysis (http://www.geneontology.org) to annotate differentially expressed genes in our genome-wide expression analyses. GO-terms provide information regarding the biological processes of a gene, either a cellular component or metabolic pathway, and highlight the molecular function(s) while reducing complexity. We used the software TM4 (http://www.tm4.org/mev.html) to screen for differentially expressed genes and to conduct cluster analysis. We also performed KEGG (http://www.kegg.jp) pathway analysis to provide insights into molecular interactions and reaction networks in which differentially regulated genes are involved using DAVID (version 6.7, http://david.abcc.ncifcrf.gov). The -log10 p-value in this analysis denotes significant enrichment of GO-terms and KEGG pathways in the case of differentially up- and down-regulated entities.
Adenovirus generation
The cDNA of bovine GosB (GenBank ID no. NM_001102248; https://www.ncbi.nlm.nih.gov/nuccore/NM_001102248.1) was cloned from Chinese Qinchuan cattle longissimus muscle using the following primers: sense 5′- TGTGCCCAGGGAAATGTTT-3′ and antisense 5′-GTCTAAAGCTCACAGAGCAAGAAG-3′. The coding sequences of GosB was subcloned into the pAdTrack-CMV plasmid vector between the XhoI and ScalI (TaKaRa, Dalian, China) restriction sites to construct a recombinant shuttle vector pAdTrack-CMV-GosB. Then this vector was homologously recombined with plasmid pAdEasy-1 to generate adenoviral plasmid in BJ5183 cells. The adenoviral plasmids linearized by PacI (TaKaRa, Dalian, China) was transfected into 293A cells to generate the adenovirus Ad-GosB. For interference recombinant adenoviruses Ad-siGosB, the BlockiT shRNA interference system was used in this experiment. We designed and synthesized one pair of complementary single-strand DNA oligonucleotides (shRNA-GosB: GATCAGCTAGAGGAAGAAA) which targeting GosB mRNA and then oligonucleotides were cloned into shuttle vector pENTR/CMV-GFP/U6. After detection of interference efficiency, we recombined a pENTR/CMV-GFP/U6-GosB and adenovirus backbone vector pAD/PL-DEST, to produce recombinant vector pAD/PL-DEST/CMV-GFP/U6-GosB. The fifth generation recombinant adenovirus particle (Ad-siGosB) was produced and further amplified by transfecting 293A cells. The titer of adenovirus reached 1.58×10⁹ PFU/mL determined by TCID50 assays. The whole process for adenovirus generation and proliferation was carried out as previously described [37, 38]. The myoblasts at about 80% confluence were transfected with adenovirus supernatant with multiplicity of infection (MOI) = 200.
Cell culture and treatment
We purchased murine C2C12 myoblasts (ATCC number: CRL-1772™); details on cell culture conditions were described previously [39]. Primary bovine myoblasts were isolated and cultured from bovine longissimus muscle as described in a previous study [40]. Myoblasts at the stage of 80% confluence were plated at 5 × 10⁵ cells/well in six-well plates or 1 × 10⁴ cells/well in 96-well plates (NEST, Wuxi, China) and incubated as described previously [40]. After growth to approximately 80% confluence, the cells were treated with: Ad-GosB (MOI = 200), Ad-siGosB (MOI = 200) or Ca2+ (4 mM). After incubation, the myoblasts were used for the different assays outlined below. To induce differentiation of myoblasts, the culture medium was changed to high-glucose Dulbecco's modified Eagle's medium (DMEM) with 2% horse serum [40].
Total RNA extraction and quantitative real-time PCR
To confirm different expression of GosB in our different treatment groups, we used qPCR. Cells were lysed in 1 mL of Trizol reagent (Invitrogen, Carlsbad, CA). Proteins were removed by adding 200 μL of chloroform. Total RNA was precipitated with an equal volume of isopropanol, and the RNA pellet was washed two times with 75% ethanol. cDNA was synthesized using a transcript first-strand cDNA synthesis kit (TaKaRa, Dalian, China). qPCR primers were shown in Supplementary Table 1. Glyceraldehyde phosphate dehydrogenase (GAPDH) was used as housekeeping gene. All qPCR measurements were replicated three times in a Bio-Rad master cycler using the SYBR Green PCR Master Mix (Takara, Dalian, China) according to the manufacturer's protocol. We used the 2−ΔΔCt method to analyze relative expression levels of qPCR data.
Cell cycle assay
To gain insights into the potential effects of GosB on aspects of the cell cycle, we analyzed the different treatment groups using the Cell Cycle Testing Kit (Multisciences, Hangzhou, China). We harvested cells that had been cultivated in six-well plates and centrifuged them at 800 g/min for 5 min. The supernatant was discarded, and the cells were washed once with cold phosphate buffered saline (PBS). We resuspended the cells in 1 mL of kit reagent A and 10 μL of reagent B, followed by vortexing for 10 s and incubation for 30 min at room temperature, after which the cell suspension was used for flow cytometry (FACS Canto™ II, BD BioSciences, USA).
Cell proliferation assay
We examined cell proliferation using the CCK-8 assay (Multisciences, Hangzhou, China) and EdU incorporation assay (Ribobio, Guangzhou, China). For the CCK-8 assay, the cells were plated into 96-well culture plates at a density of 1 × 10⁴ cells/well in 100 μL of culture medium per well, and each treatment group had six independent replicates. After 48 h of incubation at 37°C, 10 μL of CCK-8 reagent was added to each well and incubated at 37°C for 2 h. The absorbance of each sample at 450 nm wavelength was detected using a microplate reader (Molecular Devices, Sunnyvale, USA). We also assessed cell proliferation using the Cell-Light EdU DNA cell proliferation kit according to the manufacturer's instructions, with three independent replicates per treatment group.
Measurement of apoptosis using Annexin V-FITC/PI staining assays
After incubation, cells from the different treatment groups were washed with PBS three times, harvested by trypsinization, washed again with PBS and then resuspended in 500 μL 1 × binding buffer. Then cells were incubated for 10 min in the dark at room temperature in the presence of Annexin V-FITC (5 μL) and PI (10 μL, Vazyme, China). Afterwards, cells were analyzed using flow cytometry (see above), and each treatment group had three independent replicates.
Measurement of apoptosis using Hoechst 33342/PI dual staining assays
Cell apoptosis was also assessed with Hoechst 33342 and PI double staining (Solarbio, Beijing, China). In brief, after transfection with Ad-GosB or Ad-siGosB for 48 h, cells were washed with PBS and subsequently stained with Hoechst 33342 (100 μg/mL) for 15 min at room temperature. Afterwards, cells were washed with PBS twice, and PI (100 μg/mL) was added before cells were incubated for 10 min at room temperature. Presence or absence of a fluorescence signal was observed under a fluorescence microscope (DM5000B, Leica, Germany). Hoechst 33342−/PI− cells (viable cells) showed light blue coloration, Hoechst 33342+/PI− cells (early apoptotic cells) showed blue fragmentations, Hoechst 33342−/PI+ cells (late apoptotic cells) had red fragmentations, and PI+ cells (necrotic cells) showed signs of decay.
Western blot analysis
We collected cells from the different treatment groups, pelleted them by centrifugation and lysed them in RIPA buffer. Total protein was prepared and protein concentration determined using the Bradford method. Proteins were then separated by SDS-polyacrylamide gel electrophoresis and subsequently transferred to nitrocellulose membranes, blocked with milk powder solution for 1.5 h at room temperature, followed by overnight incubation with the primary antibody. Anti-GAPDH was purchased from Bioss biotechnology (Bioss, Shanghai, China). Anti-GosB, anti-Bcl-2, anti-β-actin and anti-Bax were purchased from (Abcam, Cambridge, MA). Then the membranes were washed with PBS-tween and incubated for 1.5 h with horseradish peroxidase-conjugated secondary antibodies (Abcam, Cambridge, MA). Protein bands were detected after treatment with SuperSignal West Femto agent of Thermo (Thermo Scientific, Karlsruhe, Germany).
Measurement of intracellular calcium
Activation of intracellular Ca2+ triggers cellular dysfunction and cell death [20, 21], and GosB promotes calcium deposition [22, 23]. Thus we examined the cytosolic and mitochondrial calcium levels in myoblasts transfected with Ad-GosB or Ad-siGosB. Intracellular calcium trafficking of the cytoplasm and mitochondria were detect using Fluo-3 AM and Rhod-2 AM (2μM, Molecular probes, Life Technologies), respectively. Cells were treated as described previously [41, 42], and screened by means of flow cytometry and use of a confocal laser scanning microscope (Leica, Solms, Germany).
Statistical analyses
Generally, results in our study were expressed as mean ± standard error (SEM) whenever at least three independent runs were conducted per treatment group. The statistical significance of different RNA expression levels was analyzed by means of a one-way analysis of variance (ANOVA), followed by Tukey's post hoc tests using SPSS 19.0 (Chicago, USA). P < 0.05 was considered statistically significant and indicated with one asterisk, while two asterisks indicated P < 0.01.
SUPPLEMENTARY MATERIALS FIGURES AND TABLES
Acknowledgments
We like to thank LC-Bio (Hangzhou, China) for the generation of sequence dataand Dr. Huiling Zheng (Northwest A&F University) for for critical review of our manuscript.
Abbreviations
- AE
alternative exon ends
- AP-1
activator protein 1
- AS
alternative splicing
- CCK-8
cell counting kit-8
- cDNA
complementary DNA
- DMEM
Dulbecco's modified Eagle's medium
- FPKM
fragments per kilobase of exon per million fragments mapped
- GAPDH
glyceraldehyde phosphate dehydrogenase
- GO
Gene Ontology
- IR
retention of a single intron
- KEGG
Kyoto Encyclopedia of Genes and Genomes
- MEF2
myocyte enhancer factor 2
- MIR
retention of multiple introns
- MSKIP
cassette exons
- PBS
phosphate buffered saline
- PI
propidium iodide
- qPCR
quantitative real-time PCR
- RNA-Seq
RNA sequencing
- SEM
standard error of the means
- SKIP
exon skipping
- TSS
alternative transcription start site
- TTS
alternative transcription termination site
- XAE
approximate AE
- XIR
approximate IR
- XMIR
approximate MIR
- XMKIP
approximate MSKIP
- XSKIP
approximate SKIP
Footnotes
CONFLICTS OF INTEREST
The authors have declared that no competing interests exist.
FUNDING
This study was supported by the National 863 Program of China (project number 2013AA102505), the National Natural Science Foundation of China (project number 31272408), the Program of National Beef Cattle Industrial Technology System (project number CARS-38), and the Doctor Program of Higher Education of China (project number 20120204110007).
REFERENCES
- 1.Te Pas M, Keuning E, Hulsegge B, Hoving-Bolink A, Evans G, Mulder H. Longissimus muscle transcriptome profiles related to carcass and meat quality traits in fresh meat Pietrain carcasses. J Anim Sci. 2010;88:4044–4055. doi: 10.2527/jas.2010-2952. [DOI] [PubMed] [Google Scholar]
- 2.He H, Liu X. Characterization of transcriptional complexity during longissimus muscle development in bovines using high-throughput sequencing. PloS One. 2013;8:e64356. doi: 10.1371/journal.pone.0064356. [DOI] [PMC free article] [PubMed] [Google Scholar]
- 3.Buckingham M, Bajard L, Chang T, Daubas P, Hadchouel J, Meilhac S, Montarras D, Rocancourt D, Relaix F. The formation of skeletal muscle: from somite to limb. J Anat. 2003;202:59–68. doi: 10.1046/j.1469-7580.2003.00139.x. [DOI] [PMC free article] [PubMed] [Google Scholar]
- 4.Guo B, Greenwood PL, Cafe LM, Zhou G, Zhang W, Dalrymple BP. Transcriptome analysis of cattle muscle identifies potential markers for skeletal muscle growth rate and major cell types. BMC Genomics. 2015;16:1. doi: 10.1186/s12864-015-1403-x. [DOI] [PMC free article] [PubMed] [Google Scholar]
- 5.Cagnazzo M, Te Pas M, Priem J, De Wit A, Pool M, Davoli R, Russo V. Comparison of prenatal muscle tissue expression profiles of two pig breeds differing in muscle characteristics. J Anim Sci. 2006;84:1–10. doi: 10.2527/2006.8411. [DOI] [PubMed] [Google Scholar]
- 6.Sun J, Li M, Li Z, Xue J, Lan X, Zhang C, Lei C, Chen H. Identification and profiling of conserved and novel microRNAs from Chinese Qinchuan bovine longissimus thoracis. BMC Genomics. 2013;14:1. doi: 10.1186/1471-2164-14-42. [DOI] [PMC free article] [PubMed] [Google Scholar]
- 7.Dong Y, Zhang X, Xie M, Arefnezhad B, Wang Z, Wang W, Feng S, Huang G, Guan R, Shen W. Reference genome of wild goat (capra aegagrus) and sequencing of goat breeds provide insight into genic basis of goat domestication. BMC Genomics. 2015;16:1. doi: 10.1186/s12864-015-1606-1. [DOI] [PMC free article] [PubMed] [Google Scholar]
- 8.Sun X, Li M, Sun Y, Cai H, Li R, Wei X, Lan X, Huang Y, Chen H. The developmental transcriptome landscape of bovine skeletal muscle defined by Ribo-Zero ribonucleic acid sequencing. J Anim Sci. 2015;93:5648–5658. doi: 10.2527/jas.2015-9562. [DOI] [PubMed] [Google Scholar]
- 9.Li M, Sun X, Cai H, Sun Y, Plath M, Li C, Lan X, Lei C, Lin F, Bai Y. Long non-coding RNA ADNCR suppresses adipogenic differentiation by targeting miR-204. BBA-Gene Regul Mec. 2016;1859:871–882. doi: 10.1016/j.bbagrm.2016.05.003. [DOI] [PubMed] [Google Scholar]
- 10.Luther J, Driessler F, Megges M, Hess A, Herbort B, Zaiss MM, Reichardt A, Zech C, Tuckermann JP, Calkhoven CF. Elevated Fra-1 expression causes severe lipodystrophy. J Cell Sci. 2011;124:1465–1476. doi: 10.1242/jcs.079855. [DOI] [PubMed] [Google Scholar]
- 11.Luther J, Ubieta K, Hannemann N, Jimenez M, Garcia M, Zech C, Schett G, Wagner E, Bozec A. Fra-2/AP-1 controls adipocyte differentiation and survival by regulating PPARγ and hypoxia. Cell Death Differ. 2014. p. 21. [DOI] [PMC free article] [PubMed]
- 12.Andreucci JJ, Grant D, Cox DM, Tomc LK, Prywes R, Goldhamer DJ, Rodrigues N, Bédard PA, McDermott JC. Composition and function of AP-1 transcription complexes during muscle cell differentiation. J Biol Chem. 2002;277:16426–16432. doi: 10.1074/jbc.M110891200. [DOI] [PubMed] [Google Scholar]
- 13.Brown JR, Nigh E, Lee RJ, Ye H, Thompson MA, Saudou F, Pestell RG, Greenberg ME. Fos family members induce cell cycle entry by activating cyclin D1. Mol Cell Biol. 1998;18:5609–5619. doi: 10.1128/mcb.18.9.5609. [DOI] [PMC free article] [PubMed] [Google Scholar]
- 14.Kurushima H, Ohno M, Miura T, Nakamura T, Horie H, Kadoya T, Ooboshi H, Kitazono T, Ibayashi S, Iida M. Selective induction of ΔFosB in the brain after transient forebrain ischemia accompanied by an increased expression of galectin-1, and the implication of ΔFosB and galectin-1 in neuroprotection and neurogenesis. Cell Death Differ. 2005;12:1078–1096. doi: 10.1038/sj.cdd.4401648. [DOI] [PubMed] [Google Scholar]
- 15.Miura T, Ohnishi Y, Kurushima H, Horie H, Kadoya T, Nakabeppu Y. Regulation of the neuronal fate by ΔFosB and its downstream target, galectin-1. Curr Drug Targets. 2005;6:437–444. doi: 10.2174/1389450054021963. [DOI] [PubMed] [Google Scholar]
- 16.Tahara K, Tsuchimoto D, Tominaga Y, Asoh S, Ohta S, Kitagawa M, Horie H, Kadoya T, Nakabeppu Y. ΔFosB, but not FosB, induces delayed apoptosis independent of cell proliferation in the Rat1a embryo cell line. Cell Death Differ. 2003;10:496–507. doi: 10.1038/sj.cdd.4401173. [DOI] [PubMed] [Google Scholar]
- 17.Wei X, Li H, Zhang B, Li C, Dong D, Lan X, Huang Y, Bai Y, Lin F, Zhao X. miR-378a-3p promotes differentiation and inhibits proliferation of myoblasts by targeting HDAC4 in skeletal muscle development. RNA Biol. 2016;13:1300–1309. doi: 10.1080/15476286.2016.1239008. [DOI] [PMC free article] [PubMed] [Google Scholar]
- 18.Schöneich C, Dremina E, Galeva N, Sharov V. Apoptosis in differentiating C2C12 muscle cells selectively targets Bcl-2-deficient myotubes. Apoptosis. 2014;19:42–57. doi: 10.1007/s10495-013-0922-7. [DOI] [PMC free article] [PubMed] [Google Scholar]
- 19.La Colla A, Vasconsuelo A, Milanesi L, Pronsato L. 17β-Estradiol Protects Skeletal Myoblasts from Apoptosis through P53, BCL-2 and FoxO Families. J Cell Biochem. 2017;118:104–115. doi: 10.1002/jcb.25616. [DOI] [PubMed] [Google Scholar]
- 20.La Rovere RM, Roest G, Bultynck G, Parys JB. Intracellular Ca2+ signaling and Ca2+ microdomains in the control of cell survival, apoptosis and autophagy. Cell Calcium. 2016;60:74–87. doi: 10.1016/j.ceca.2016.04.005. [DOI] [PubMed] [Google Scholar]
- 21.Li H, Wang X, Zhang N, Gottipati MK, Parpura V, Ding S. Imaging of mitochondrial Ca2+ dynamics in astrocytes using cell-specific mitochondria-targeted GCaMP5G/6s: Mitochondrial Ca2+ uptake and cytosolic Ca2+ availability via the endoplasmic reticulum store. Cell Calcium. 2014;56:457–466. doi: 10.1016/j.ceca.2014.09.008. [DOI] [PMC free article] [PubMed] [Google Scholar]
- 22.Kveiborg M, Sabatakos G, Chiusaroli R, Wu M, Philbrick WM, Horne WC, Baron R. ΔFosB induces osteosclerosis and decreases adipogenesis by two independent cell-autonomous mechanisms. Mol Cell Biol. 2004;24:2820–2830. doi: 10.1128/MCB.24.7.2820-2830.2004. [DOI] [PMC free article] [PubMed] [Google Scholar]
- 23.Rowe GC, Choi CS, Neff L, Horne WC, Shulman GI, Baron R. Increased Energy Expenditure and Insulin Sensitivity in the High Bone Mass ΔFosB Transgenic Mice. Endocrinology. 2009;150:135–143. doi: 10.1210/en.2008-0678. [DOI] [PMC free article] [PubMed] [Google Scholar]
- 24.Mutz KO, Heilkenbrinker A, Lönne M, Walter JG, Stahl F. Transcriptome analysis using next-generation sequencing. Curr Opin Biotech. 2013;24:22–30. doi: 10.1016/j.copbio.2012.09.004. [DOI] [PubMed] [Google Scholar]
- 25.Adiconis X, Borges-Rivera D, Satija R, DeLuca DS, Busby MA, Berlin AM, Sivachenko A, Thompson DA, Wysoker A, Fennell T. Comparative analysis of RNA sequencing methods for degraded or low-input samples. Nat Methods. 2013;10:623–629. doi: 10.1038/nmeth.2483. [DOI] [PMC free article] [PubMed] [Google Scholar]
- 26.Li H, Lovci MT, Kwon YS, Rosenfeld MG, Fu XD, Yeo GW. Determination of tag density required for digital transcriptome analysis: application to an androgen-sensitive prostate cancer model. Proc Natl Acad Sci U S A. 2008;105:20179–20184. doi: 10.1073/pnas.0807121105. [DOI] [PMC free article] [PubMed] [Google Scholar]
- 27.Zhao W, He X, Hoadley KA, Parker JS, Hayes DN, Perou CM. Comparison of RNA-Seq by poly (A) capture, ribosomal RNA depletion, and DNA microarray for expression profiling. BMC Genomics. 2014;15:419. doi: 10.1186/1471-2164-15-419. [DOI] [PMC free article] [PubMed] [Google Scholar]
- 28.Chen H, Gao W, Yang Y, Guo S, Wang H, Wang W, Zhang S, Zhou Q, Xu H, Yao J. Inhibition of VDAC1 prevents Ca2+-mediated oxidative stress and apoptosis induced by 5-aminolevulinic acid mediated sonodynamic therapy in THP-1 macrophages. Apoptosis. 2014;19:1712–1726. doi: 10.1007/s10495-014-1045-5. [DOI] [PubMed] [Google Scholar]
- 29.Cruz LN, Wu Y, Ulrich H, Craig AG, Garcia CR. Tumor necrosis factor reduces Plasmodium falciparum growth and activates calcium signaling in human malaria parasites. BBA-Gen Subjects. 2016;1860:1489–1497. doi: 10.1016/j.bbagen.2016.04.003. [DOI] [PMC free article] [PubMed] [Google Scholar]
- 30.Charles E, Hammadi M, Kischel P, Delcroix V, Demaurex N, Castelbout C, Vacher AM, Devin A, Ducret T, Nunes P. The antidepressant fluoxetine induces necrosis by energy depletion and mitochondrial calcium overload. Oncotarget. 2016;8:3181–3196. doi: 10.18632/oncotarget.13689. [DOI] [PMC free article] [PubMed] [Google Scholar]
- 31.Greenberg EF, Lavik AR, Distelhorst CW. Bcl-2 regulation of the inositol 1, 4, 5-trisphosphate receptor and calcium signaling in normal and malignant lymphocytes: Potential new target for cancer treatment. BBA-Mol Cell Res. 2014;1843:2205–2210. doi: 10.1016/j.bbamcr.2014.03.008. [DOI] [PMC free article] [PubMed] [Google Scholar]
- 32.Rong Y, Distelhorst CW. Bcl-2 protein family members: versatile regulators of calcium signaling in cell survival and apoptosis. Annu Rev Physiol. 2008;70:73–91. doi: 10.1146/annurev.physiol.70.021507.105852. [DOI] [PubMed] [Google Scholar]
- 33.Guan L, Song Y, Gao J, Gao J, Wang K. Inhibition of calcium-activated chloride channel ANO1 suppresses proliferation and induces apoptosis of epithelium originated cancer cells. Oncotarget. 2016;7:78619–78630. doi: 10.18632/oncotarget.12524. [DOI] [PMC free article] [PubMed] [Google Scholar]
- 34.Lam M, Dubyak G, Chen L, Nunez G, Miesfeld RL, Distelhorst CW. Evidence that Bcl-2 represses apoptosis by regulating endoplasmic reticulum-associated Ca2+ fluxes. Proc Natl Acad Sci U S A. 1994;91:6569–6573. doi: 10.1073/pnas.91.14.6569. [DOI] [PMC free article] [PubMed] [Google Scholar]
- 35.Su CM, Chen CY, Lu T, Sun Y, Li W, Huang YL, Tsai CH, Chang CS, Tang CH. A novel benzofuran derivative, ACDB, induces apoptosis of human chondrosarcoma cells through mitochondrial dysfunction and endoplasmic reticulum stress. Oncotarget. 2016;7:83530–83543. doi: 10.18632/oncotarget.13171. [DOI] [PMC free article] [PubMed] [Google Scholar]
- 36.Kim D, Pertea G, Trapnell C, Pimentel H, Kelley R, Salzberg SL. TopHat2: accurate alignment of transcriptomes in the presence of insertions, deletions and gene fusions. Genome Biol. 2013;14:R36. doi: 10.1186/gb-2013-14-4-r36. [DOI] [PMC free article] [PubMed] [Google Scholar]
- 37.Luo J, Deng ZL, Luo X, Tang N, Song WX, Chen J, Sharff KA, Luu HH, Haydon RC, Kinzler KW. A protocol for rapid generation of recombinant adenoviruses using the AdEasy system. Nat Protoc. 2007;2:1236–1247. doi: 10.1038/nprot.2007.135. [DOI] [PubMed] [Google Scholar]
- 38.Shi H, Luo J, Yao D, Zhu J, Xu H, Shi H, Loor J. Peroxisome proliferator-activated receptor-γ stimulates the synthesis of monounsaturated fatty acids in dairy goat mammary epithelial cells via the control of stearoyl-coenzyme A desaturase. J Dairy Sci. 2013;96:7844–7853. doi: 10.3168/jds.2013-7105. [DOI] [PubMed] [Google Scholar]
- 39.Huang J, Mo C, Bonewald L, Brotto M. Wnt3a and Wnt1 Enhance Myogenesis of C2C12 Myoblasts–Potential Mechanisms of Osteocyte to Muscle Cell Signaling. FASEB J. 2015;29:947–913. [Google Scholar]
- 40.Sun X, Li M, Sun Y, Cai H, Lan X, Huang Y, Bai Y, Qi X, Chen H. The developmental transcriptome sequencing of bovine skeletal muscle reveals a long noncoding RNA, lncMD, promotes muscle differentiation by sponging miR-125b. BBA-Mol Cell Res. 2016;1863:2835–2845. doi: 10.1016/j.bbamcr.2016.08.014. [DOI] [PubMed] [Google Scholar]
- 41.Sawant MA, Dasgupta A, Lavhale MS, Sitasawad SL. Novel triterpenoid AECHL-1 induces apoptosis in breast cancer cells by perturbing the mitochondria–endoplasmic reticulum interactions and targeting diverse apoptotic pathways. BBA-Gen Subjects. 2016;1860:1056–1070. doi: 10.1016/j.bbagen.2016.02.002. [DOI] [PubMed] [Google Scholar]
- 42.Zheng H, Li H, Li L, Ma S, Liu X. ΔFosB regulates Ca2+ release and proliferation of goat mammary epithelial cells. Gene. 2014;545:241–246. doi: 10.1016/j.gene.2014.05.023. [DOI] [PubMed] [Google Scholar]
Associated Data
This section collects any data citations, data availability statements, or supplementary materials included in this article.


