

Abstract
Disrupted-In-Schizophrenia 1 (DISC1) was identified as the sole gene whose ORF is truncated and cosegregates with major mental illnesses in a Scottish family. DISC1 has also been suggested, by association and linkage studies, to be a susceptibility gene for schizophrenia (SZ) in independent populations. However, no analysis of DISC1 protein in human brains, especially those of patients with SZ, has yet been conducted. Here we performed a biochemical analysis of DISC1 protein in a well characterized set of autopsied brains, including brains of patients with SZ, bipolar disorder, and major depression (MD), as well as normal control brains. We identified an isoform of DISC1 by using MS and demonstrated that it is enriched in the nucleus of HeLa cells. In the orbitofrontal cortex, the subcellular distribution of this DISC1 isoform, assessed by the nuclear to cytoplasmic ratio in the immunoreactivity of the isoform, is significantly changed in brains from patients with SZ and MD. This altered distribution is also observed in those subjects with substance and alcohol abuse. The changes in MD brains are significantly influenced by substance/alcohol abuse as well as postmortem interval; however, the alteration in SZ brains is free from brain-associated confounding factors, although an interaction with substance/alcohol abuse cannot be completely ruled out. These results suggest that DISC1 may be implicated in psychiatric conditions in other populations than the unique Scottish family.
Keywords: schizophrenia, autopsied brains, Stanley Foundation
Schizophrenia (SZ) is believed to result from the interaction of environmental factors with genetic vulnerability (1, 2). The Disrupted-In-Schizophrenia 1 (DISC1) gene was originally identified as the sole disrupted gene with an ORF that cosegregated with SZ in a Scottish family (3, 4). In the Scottish family, patients with other major psychiatric illnesses, including bipolar affective disorder and recurrent major depression, have also been identified (3, 5). Genetic association and linkage studies have also suggested that DISC1 may be implicated in SZ in independent populations (6–9).
Roles for the DISC1 protein still remain to be elucidated. Yeast two-hybrid assays by our group and others disclose several proteins that interact with DISC1, including proteins associated with the microtubular components, especially the centrosome, the synaptic scaffold, and the actin cytoskeleton (10–13). Immunofluorescent cell staining reveals cell type-specific and context-dependent subcellular distribution of DISC1, including centrosomal enrichment in COS-7 cells and differentiating PC12 cells (12, 13), as well as mitochondrial staining in HeLa cells (14). DISC1 contains evolutionally well conserved nuclear localization signals in the ORF (15), suggesting its possible role in the nucleus. Furthermore, two distinct banding patterns of DISC1 have been observed in rodent brains by Western blotting (10, 12, 16). Thus, DISC1 may be a multifunctional protein localized in several subcellular pools, possibly due to a variety of isoforms with different subcellular distributions.
Here we report the protein expression of DISC1 in autopsied human brains, especially brains from patients with major mental illnesses. Changes in the subcellular distribution of a form of DISC1, which represent increases in its nuclear pool, are observed in the orbitofrontal cortex from patients with SZ and major depression (MD). This altered distribution is also observed in subjects with substance and alcohol abuse. The changes in patients with MD in our study are significantly influenced by substance/alcohol abuse as well as postmortem interval (PMI).
Materials and Methods
Brains. Human postmortem orbital cortices (Brodmann area 45) from normal controls (NORM) as well as patients with SZ, bipolar disorder (BP), and MD were obtained from the Stanley Foundation Brain Collection (Bethesda), which distributes postmortem brain tissue from individuals with major mental illnesses as well as from unaffected controls to researchers without charge (www.stanleyresearch.org/programs/brain_collection.asp). The specimens are collected by medical examiners. Permission of the next of kin is obtained in all cases. The blocks of the orbitofrontal cortex were taken from the lateral margin of the orbital gyri, and the gray matter was dissected manually from the white matter with a sharp blade. Each group had 15 subjects. The demographic, clinical, and storage characteristics for the cases have been already published (17). Each diagnostic group is maximally matched according to several parameters, including age at death, gender, PMI, brain pH, brain weight, and storage days, and we reassessed the differences among the groups in the present study (Table 4, which is published as supporting information on the PNAS web site).
Chemicals. All reagents were purchased from Sigma except as indicated. Protein concentrations were determined by using the bicinchoninic acid protein assay kit (Pierce).
Antibodies. Preparation of an immunopurified anti-DISC1 antibody was described in ref. 12. In brief, the antibodies were raised against a portion of DISC1 [601–854 (C2)] tagged to glutathione S-transferase. The dilutions of antibodies used in this study were as follows: DISC1-C2, 1:250; histone H1 (Santa Cruz Biotechnology), 1:100; polyADP polymerase (PARP) (BD Biosciences Pharmingen), 1:250; PSD95 (Zymed), 1:500; γ-tubulin (Sigma), 1:10,000; α-tubulin (Sigma), 1:4,000; cytochrome c oxidase (Molecular Probes), 1:50; and GAPDH (18), 1:2,000.
MS. HeLa cells were lysed in RIPA buffer (150 mM NaCl/10 mM Tris·HCl, pH 7.5/1% Nonidet P-40/0.1% SDS/0.5% sodium deoxycholate) containing a protease inhibitor mixture (Complete) (Roche Applied Sciences, Indianapolis). The solubilized proteins were subjected to immunoprecipitation as described in ref. 19 by using anti-DISC1-C2 antibody (12), and the precipitated proteins were subjected to SDS/PAGE. The major band of DISC1 at 75–85 kDa was visualized by Coomassie staining. Gel-purified DISC1 at 75–85 kDa was tryptic digested and analyzed by MALDI-TOF MS (Voyager DE-STR, Applied Biosystems) in the MS facility at The Johns Hopkins University School of Medicine. Peptide mass was analyzed by using the programs peptide mass (http://au.expasy.org/tools/peptide-mass.html) and ms-digest (http://prospector.ucsf.edu/ucsfhtml4.0/msdigest.htm).
Subcellular Fractionation. A classic method of subcellular fractionation was used for autopsied human brains and HeLa cells (20, 21). In brief, 0.1 g of tissues or cells were homogenized in ice-cold buffer (50 mM Tris·HCl, pH 7.4/150 mM NaCl) plus protease inhibitors (Complete) by using a motor-driven Teflon homogenizer. The homogenates containing equal amounts of protein were centrifuged at 800 × g for 10 min at 4°C to obtain a crude nuclear pellet (P) and postnuclear supernatant (S).
For further analysis of nuclear fractions, we used a standard protocol to enrich for transcription factors with minor modifications (22, 23). Cell homogenates from HeLa and SH-SY5Y cells were lysed in buffer A (10 mM Hepes, pH 7.9/1.5 mM MgCl2/10 mM KCl/1 mM DTT) plus protease inhibitors (Complete) were centrifuged at 2,300 × g for 2 min at 4°C. The pellet was resuspended in buffer A containing 0.1% Nonidet P-40, centrifuged at 1,500 × g, and the cytoplasmic supernatant was collected. The pellet was resuspended in buffer C (20 mM Hepes/25% glycerol/420 mM NaCl/1.5 mM MgCl2/1 mM DTT) with protease inhibitors (Complete) were centrifuged at 16,000 × g for 15 min at 4°C. The final supernatant fraction is considered to be a nuclear fraction with enriched in transcription factors (22, 23).
Western Blotting. A standard protocol described in ref. 24 was used with minor modifications. Proteins were separated by using Novex Tris-Glycine gel (Invitrogen) and transferred onto a polyvinylidene difluoride membrane (Millipore). The same amounts of proteins based on the protein concentration of each sample (12.5 μg) were loaded in the lanes. To confirm equal loading, Western signals of a constant expression marker, GAPDH, were used. To standardize variability among gels/membranes (nine gels were needed to evaluate 60 brain samples because eight lanes were available per gel), one common sample was loaded for all nine gels. The same amount of proteins from the P and S fractions from the same subject were run in the same gels/membranes, and the ratio of the immunoreactivity from the P to the S fraction was measured. For Western blotting, nonspecific binding was blocked with 5% fat-free milk in PBS containing 0.1% Tween 20. The blots were then incubated with primary antibodies overnight at 4°C. For detection of both monoclonal and polyclonal antibodies, appropriate peroxidase-conjugated secondary antibodies were used in conjunction with enhanced chemiluminescence (Amersham Pharmacia Biosciences) to obtain images saved on film. The signals were quantitatively evaluated by using nih image software.
Statistical Analysis. Statistical analysis was carried out by using statview computer software (version 5.0 for Macintosh; Abacus Concepts, Berkeley, CA). One-way ANOVA was used for initial assessment of the P:S ratio of the DISC1 immunoreactivity among disease and control groups. When a significant difference was obtained, post hoc comparison with the Bonferroni–Dunn test was used to identify the specific group differences. The effects of clinical and brain-associated confounding factors on the P:S ratio of the DISC1 signal were examined by using the unpaired t test, or ANOVA for categorical variables, as well as Pearson's correlation coefficients for continuous variables. Furthermore, analysis of covariance was used to analyze possible effects of several confounding factors on the P:S ratio by using diagnostic group as the independent factor and continuous variables as covariates. Two-factor factorial ANOVA was used to examine the effects of diagnostic groups and substance or alcohol abuse on the P: S ratio, respectively, and their interactions. When a significant difference was obtained, post hoc comparison with Scheffé test was used to identify specific group differences. Probability values (P values) < 0.05 were considered to be statistically significant. All values were described as means and SD.
Results
DISC1 Protein in Human Autopsied Brains. Protein expression of DISC1 in human autopsied brains was analyzed by Western blotting and compared with that in human cell lines of HeLa and SH-SY5Y cells (Fig. 1). DISC1 is expressed in two distinct bands at 95–100 kDa and 70–85 kDa in human brains, which resembles the profiles in rodent brains previously reported by our group and others (10, 12, 16). Similar to rodent brains, the signal at 70–85 kDa is much more intense than that at 95–100 kDa. In contrast, the molecular identity of the 70- to 85-kDa signal still remained elusive.
Fig. 1.
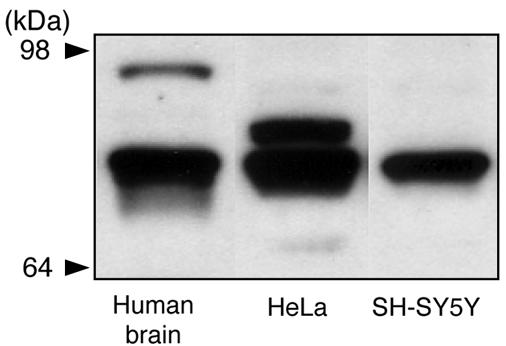
Characterization of human DISC1 protein. Western blotting of human autopsied brains, HeLa cells, and SH-SY5Y cells with an anti-DISC1 antibody (C2) is shown. DISC1 is expressed in two distinct bands at 95–100 kDa and 70–85 kDa in human brains. The signal from 70 to 85 kDa is subdivided into three categories: a major band in the middle at 75–85 kDa occurs in all of the samples with an additional upper signal in HeLa cells and a minor lower signal in HeLa cells and human brains. Similar results were obtained with antibodies from K. Millar and T. Katayama (N.S. and A.S., unpublished data).
The signal from 70 to 85 kDa is subdivided into three categories (Figs. 1 and 2). A major band in the middle at 75–85 kDa occurs in human brains, HeLa, and SH-SY5Y cells. An upper signal is observed in HeLa cells and a minor lower signal in HeLa cells and human brains. In the present study, we focused our analyses on the major signal at 75–85 kDa. To characterize the 75- to 85-kDa signal directly, we used HeLa cell extracts with protein chemistry that combined immunoprecipitation and MS. We found five independent fragments that were derived from DISC1 sequences from the profiles of MS (Table 1). No signal corresponding to DISC1 was obtained when we used preimmune sera for the immunoprecipitation (data not shown).
Fig. 2.
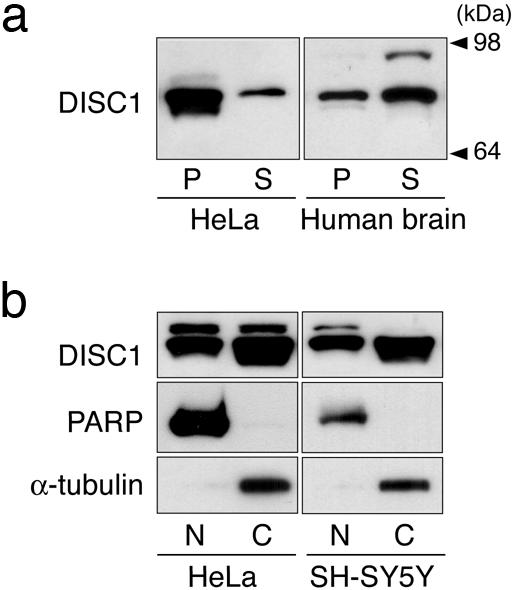
A pool of DISC1 in the nucleus. (a) DISC1 in the crude nucleus obtained by a classic method. In human autopsied brains, the DISC1 signal at 95–100 kDa is exclusively enriched in the S, but the signal at 75–85 kDa occurs in both the P and S fractions. (b) DISC1 in a fraction enriched with nuclear transcription factors. In HeLa cells and SH-SY5Y cells, the major band at 75–85 kDa focused on in the present study is distributed in both the nuclear fraction (N) and the cytosolic fraction (C). α-Tubulin and polyADP polymerase are used for cytosolic and nuclear markers, respectively.
Table 1. MS profile of the 75- to 85-kDa signal.
| Mass, m/z | Position | Exon | Peptide sequence |
|---|---|---|---|
| 833.53 | 85-91 | 2 | QCGLDSR |
| 1,060.32 | 102-112 | 2 | SAAAPTVTSVR |
| 871.45 | 124-131 | 2 | GGTRLPDR |
| 1,088.30 | 455-462 | 5 | RDWLLQEK |
| 644.66 | 463-467 | 5-6 | QQLQK |
The 75- to 85-kDa protein was enriched by immunoprecipitation with an anti-DISC1-C2 antibody and analyzed by MS. The peptide fragments contain the sequences of DISC1.
Nuclear Enrichment of a Form of DISC1. Previous reports have suggested that DISC1 may have more than one subcellular pool (10, 12–14). DISC1 contains evolutionally well conserved nuclear localization signals in the ORF (15), suggesting its potential role in the nucleus. Thus, we conducted subcellular fractionation, paying particular attention to its possible nuclear pool.
A classic method of subcellular fractionation (20, 21) was used for an initial estimation. In human autopsied brains, the DISC1 signal at 95–100 kDa is exclusively enriched in S, but the signal at 75–85 kDa occurs in both the P and S fractions (Fig. 2a). We further characterized the S and P fractions from human autopsied brains by a variety of organelle markers (Fig. 5, which is published as supporting information on the PNAS web site). The markers for cytoplasm, mitochondria, and postsynaptic density occur almost exclusively in the S fraction. In contrast, histone H1 is exclusively enriched in the P fraction. γ-tubulin is recovered almost equally in the S and P fractions. In conclusion, the P fraction is an enriched nuclear fraction with some contamination from the centrosome. These results suggest that a form(s) of DISC1 at 75–85 kDa may exist in the nucleus.
To obtain further information about nuclear DISC1, we used an established protocol for enrichment of nuclear transcription factors (22, 23). In HeLa and SH-SY5Y cells, substantial enrichment of a form(s) of DISC1 at 75–85 kDa was observed in the nuclear fractions (Fig. 2b).
Aberrant Subcellular Distribution of DISC1 in Brains from Patients with Major Mental Illnesses. To analyze the disposition of DISC1 in human brains, especially in brains from patients with psychiatric conditions, we used the well characterized brain sets from the Stanley Foundation Brain Collection (17). The brain set contains four groups of brains from 15 NORM subjects, 15 patients with SZ, 15 patients with BP, and 15 patients with MD. We chose the orbitofrontal cortex for analyses in the present study because of preferential expression of DISC1 in the forebrains, including the cerebral cortex and the olfactory bulbs (10, 12, 25), and the availability of sufficient amounts of frozen brain materials for biochemical assays.
First, we assessed the levels of DISC1 protein in total brain homogenates by the immunoreactivity in Western blotting by using an anti-DISC1 antibody (C2). No significant differences in the immunoreactivity of 75- to 85-kDa DISC1 among four groups were observed (P = 0.2409; one-way ANOVA) (Fig. 3a). Equal protein loading was confirmed by the immunoreactivity of GAPDH (Fig. 3b). Each signal was measured inside a linear range between protein amount and immunoreactivity (Fig. 6a, which is published as supporting information on the PNAS web site). The specificity of the DISC1 signal at 75–85 kDa from human brains is confirmed by absorption experiments (Fig. 6b).
Fig. 3.
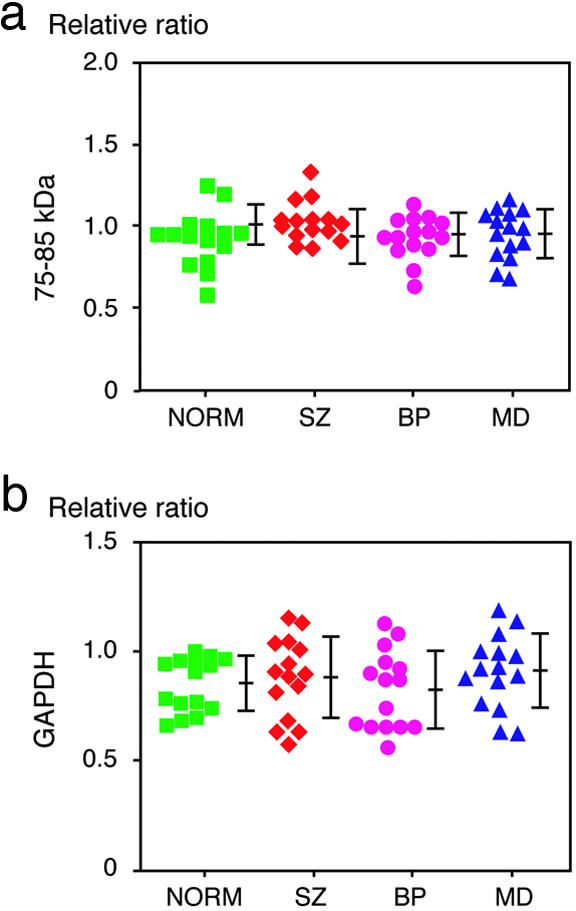
Immunoreactivity of DISC1 at 75–85 kDa in the total tissue extracts. (a) No change in the level of DISC1 in the total homogenates among brains from patients with SZ, BP, and MD as well as NORM brains. Relative ratios to the intensity of the band from one control sample were plotted. Each symbol represents the data from individual samples. Means ± SD are shown. (b) The immunoreactivity of GAPDH, a constant expression marker, shows no difference in the levels among four groups.
Second, we focused on subcellular distribution of DISC1 in these brains (Fig. 4). To evaluate semiquantitatively the fraction of DISC1 in the crude nucleus, we examined the signal ratio of DISC1 at 75–85 kDa from the P fraction compared with the S fraction (the P:S ratio) in the subcellular fractionation that was characterized above (Figs. 2a and 5). Of interest, a significant difference in the P:S ratio is observed among the four groups (P = 0.0398; one-way ANOVA). Post hoc comparison by using the Bonferroni–Dunn test reveals that the P:S ratios in SZ and MD groups are significantly increased in comparison with that of the NORM group (P = 0.018 and 0.0091, respectively) (Fig. 4b). The increase in BP is not statistically significant (P = 0.0779).
Fig. 4.
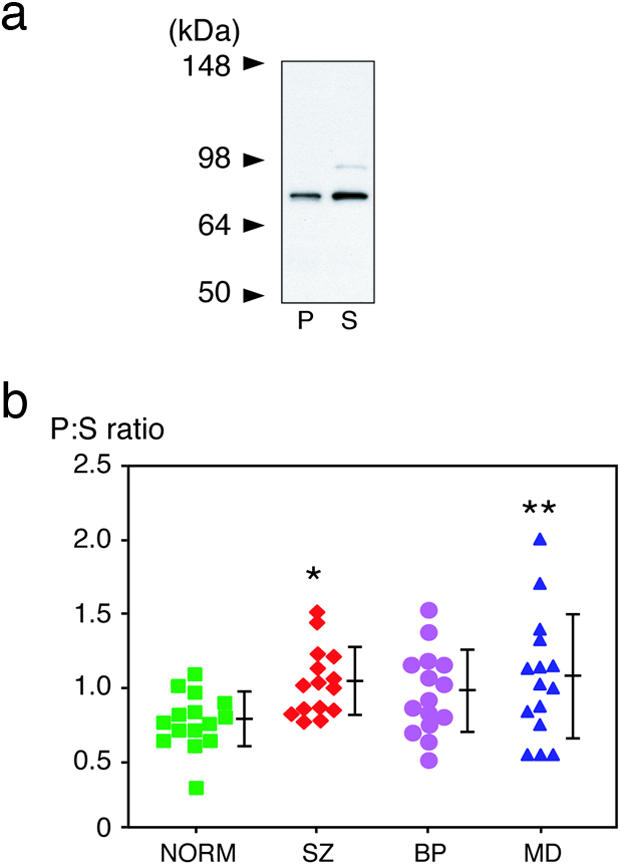
Aberrant subcellular distribution of DISC1 in patient brains with SZ and MD. (a) Representative Western blot of DISC1 in the P and S fractions. Subcellular distribution of DISC1 in human brains was analyzed, which was further characterized in Figs. 2a and 5. (b) The signal ratio of DISC1 from the P to the S fraction (the P:S ratio) is increased in patient brains with SZ and MD groups (*, P = 0.018; and **, P = 0.0091, respectively). Each symbol represents the data from individual samples. Means ± SD are shown.
In this brain set from the Stanley foundation, several confounding factors associated with brains, such as PMI, brain pH, and storage days, are maximally standardized (ref. 17 and Table 4). When all 60 brains together are analyzed as one group by Pearson's correlation coefficients, the P:S ratio is not influenced by age at sample collection, PMI, brain pH, lifetime neuroleptics (fluphenazine equivalent), brain weight, and storage days of frozen brains (Fig. 7, which is published as supporting information on the PNAS web site). We further performed analysis of covariance to detect possible influences of these factors to diagnostic group. Significant interaction with diagnostic group was found in PMI (P = 0.0041) but not in all other factors we tested. For each diagnosis group, a significant effect is found only in MD together with PMI (P = 0.0080) but is not found in SZ and BP (Table 5, which is published as supporting information on the PNAS web site).
Influence of Substance and Alcohol Abuse on Subcellular Distribution of DISC1 in Autopsied Brains. The P:S ratio is also associated with the severity of substance and alcohol abuse (P = 0.0006 and 0.0179, respectively) (Table 2). There is a clear correlation of the increase in the P:S ratio with the extent of substance or alcohol abuse (Table 2). To explore how the extent of abuse and each disease diagnosis influences the P:S ratio, we divided each diagnostic group into two, based on the extent of abuse (substance or alcohol), and used two-factor factorial ANOVA (diagnostic group × abuse) for analyses (Table 3). Effects of substance abuse and disease diagnosis themselves, as well as their interaction, are significant (P = 0.0067, 0.0071, and 0.0056, respectively). In the case of alcohol, effects of abuse and disease diagnosis are significantly observed (P = 0.0104 and 0.0078, respectively), but their interaction is just suggestive (P = 0.0568). Further post hoc comparisons reveal that the increase of P:S in MD groups with moderate/heavy abuse in comparison with those with none/little abuse contributes to the significant changes.
Table 2. Effect of gender, hemisphere, presence of psychosis, smoking, substance abuse, and alcohol abuse on the P:S ratio.
| Parameter | Groups | P:S ratio, mean ± SD | P value | Statistical technique |
|---|---|---|---|---|
| Gender | Male (n = 36) | 0.939 ± 0.317 | 0.4440 | Unpaired t test |
| Female (n = 24) | 1.002 ± 0.297 | |||
| Hemisphere | Right (n = 27) | 0.867 ± 0.260 | 0.0255* | Unpaired t test |
| Left (n = 33) | 1.044 ± 0.325 | |||
| Psychosis | With (n = 26) | 1.021 ± 0.246 | 0.2126 | Unpaired t test |
| Without (n = 34) | 0.920 ± 0.246 | |||
| Smoking at time of death | No (n = 17) | 1.008 ± 0.219 | 0.2242 | Unpaired t test |
| Yes (n = 22) | 0.904 ± 0.286 | |||
| Severity of substance abuse | None/little (n = 43) | 0.894 ± 0.235 | 0.0006† | One-way ANOVA |
| Moderate (n = 8) | 0.948 ± 0.281 | |||
| Heavy (n = 9) | 1.311 ± 0.423‡§ | |||
| Severity of alcohol abuse | None/little (n = 13) | 0.878 ± 0.241 | 0.0179¶ | One-way ANOVA |
| Moderate (n = 12) | 0.983 ± 0.309 | |||
| Heavy (n = 12) | 1.161 ± 0.391∥ |
The P:S ratio of DISC1 is significantly associated with the severity of substance and alcohol abuse (†, P = 0.0006; and ¶, P = 0.0179, respectively). Slight differences in the ratios are found between right and left hemispheres (indicated as *). The P:S ratio is given by mean ± SD. ‡, P < 0.001; §, P < 0.05; and ∥, P < 0.05; is a comparison between heavy and none/little (substance), heavy and moderate (substance), as well as heavy and none/little (alcohol), respectively.
Table 3. Effects of substance and alcohol abuse on P:S ratio in each diagnostic group.
| Type of abuse | Diagnostic group | NORM (n) | SZ (n) | BP (n) | MD (n) |
|---|---|---|---|---|---|
| Substance | None/little | 0.769 ± 0.191 (14) | 1.032 ± 0.206 (10) | 0.914 ± 0.186 (7) | 0.914 ± 0.277 (12) |
| Moderate/heavy | 0.900 (1) | 1.054 ± 0.299 (5) | 1.020 ± 0.350 (8) | 1.683 ± 0.341* (3) | |
| Alcohol | None/little | 0.760 ± 0.207 (11) | 1.030 ± 0.206 (9) | 0.846 ± 0.144 (5) | 0.887 ± 0.289 (12) |
| Moderate/heavy | 0.827 ± 0.127 (4) | 1.053 ± 0.283 (6) | 0.994 ± 0.311 (9) | 1.430 ± 0.436** (3) |
The significant effects of abuse, diagnosis, and their interactions are observed. Effect of substance abuse, P = 0.0067; effect of diagnosis, P = 0.0071; interaction, P = 0.0056, by two factor-factorial ANOVA. *, P < 0.01 compared with none/little of MD on Scheffé post hoc test. Effect of alcohol abuse, P = 0.0104; effect of diagnosis, P = 0.0078; interaction, P = 0.0568; by two factor-factorial ANOVA. **, P < 0.01 compared with none/little of MD on Scheffé post hoc test.
Discussion
The present study provides two major findings. First, we directly identify a shorter form of DISC1 by MS and find that it is enriched in the nucleus. Second, we report that the subcellular distribution of the isoform is altered in the orbitofrontal cortex from patients with SZ and MD from the Stanley Foundation Brain Collection. Further analyses considering several confounding factors lead to the conclusion that (i) the extent of substance and alcohol abuse, but not smoking, influences the P:S ratio; (ii) the effects of substance abuse appear to interact with the effects of disease; (iii) the alteration in MD brains may not be conclusive because of the effects of PMI and abuse; and (iv) the alteration in SZ brains is free from brain-associated confounding factors and may be attributed to the disease effect, although an interaction with substance/alcohol abuse cannot be completely ruled out. Genetic studies have suggested the importance of DISC1 in SZ (3–8), but direct evidence that there are abnormalities of DISC1 in “sporadic” SZ has been lacking. This biochemical analyses with patient brains provide suggestive evidence in support of hypothesis that aberrant subcellular distribution of DISC1 may occur in brains of patients with sporadic SZ.
Biochemical analyses of rodent brains have revealed that there are two distinct sets of signals in Western blotting with anti-DISC1 antibodies (10, 12, 16). The first set at 95–100 kDa is regarded as containing the translated products of 854 and/or 832 amino acids from the known ORF of DISC1 with the difference due to alternative splicing sites in exon 11. The second set, corresponding to the size between 70 and 85 kDa with a more intense signal, has been an enigma. Approaches to characterize DISC1 isoforms at nucleotide levels have not been successful because the appearance of minor isoforms amplified by PCR, which may not exist in substantial amounts at the protein level (L. Bord and A.S., unpublished work) (12, 14, 26). To our knowledge, our data from MS provides the evidence that the 75- to 85-kDa signal(s) is attributed to DISC1 and corresponds to an isoform(s) including exons 2 and 5.
Subcellular fractionation suggests an increase in the ratio of the crude nuclear fraction (P fraction) to the postnuclear cytosolic fraction (S fraction) of DISC1 from brains of patients with SZ or those with substance abuse. The P fraction excludes marker proteins from the cytosol, the mitochondria, and the postsynaptic density (Fig. 5). The microtubules are recovered in both cytosolic and centrosome fractions, both of which are not enriched in the P fractions. In contrast, histone H1, a nuclear protein, is exclusively enriched in the P fraction. We suggest that the increase in the ratio of P to S fractions reflects the increase of DISC1 in the nucleus. Consistent with this finding, our independent study of human autopsy brains by immunoelectron microscopy indicates the nucleus to be one of the main subcellular components that enrich DISC1.∥ James et al. (14) showed enrichment of DISC1 in the P2 mitochondrial fractions of U373 MG glioblastoma cells. Differences in the subcellular distribution of DISC1 may be explained by cell-type specificity. Emphasis on cytoplasmic staining of DISC1 in their paper, although DISC1 puncta within the nuclear region were observed (14), may be accounted by the fact that nuclear protein is not so efficiently stained in normal fixative, such as 4% paraformaldehyde, owing to the high probability of hidden epitopes inside the nuclear matrix.
Provided that this interpretation is correct, there must be a way to explain the increase in the nuclear pool of DISC1 without alteration of its total DISC1 in brains from patients with SZ and/or abuse. The increase in the nuclear pool may imply the decrease of other DISC1 pools, such as that with the microtubule-associated cytoskeleton. This result is in accordance with the finding that loss of DISC1 function in microtubular dynamics is associated with pathology in animal brains similar to that observed in brains of patients with SZ (A. Kamiya and A.S.; unpublished data). Alternatively, the increase of the nuclear pool by itself may play a role in a gain-of-function fashion in the pathophysiology of SZ. The role of nuclear DISC1 is unknown, but DISC1 may be involved in aberrant gene transcription possibly related to its neurodevelopmental and synaptic functions.
The brain set used in the present study has been examined by many groups, with significant molecular changes in brains of patients with SZ, including the decreased levels of Akt and myelination genes as well as up-regulation of neuronal calcium sensor-1 and dopamine receptor-interacting protein (27–31). Our present study assesses a change in subcellular distribution. The overall relationship of molecules that are aberrantly expressed or distributed in SZ brains should be addressed in future studies. It may be an important subject whether Akt can phosphorylate DISC1 and influence the subcellular distribution of DISC1.
The relationship between the effects of substance/alcohol abuse and those of the disease effects of SZ is still complex. The present analyses indicate that both contribute to the alteration of the P:S ratio and possibly interact with each other in substance abuse. The orbitofrontal cortex plays a role in processing rewards as well as punishments, which is prerequisite for flexible emotional and social behavior (32–35). Its pathophysiological role is suggested not only in SZ but also in substance abuse and in obsessive-compulsive disorder (32, 36, 37). Increased levels of DISC1 may primarily be associated with impairment in proper neuronal circuit formation or plasticity, which may underlie potential common susceptibility to both abuse and SZ. Alternatively, substance or alcohol abuse may secondarily lead to subcellular distribution changes of DISC1, which just coincidently resembles the disease alterations that occur in SZ. To narrow down the mechanism from several possible hypotheses, including the above two scenarios, the same biochemical analyses of DISC1 in different brain regions and more mechanistic studies of nuclear DISC1 may be required. Regardless of whether they are primary or secondary, the changes in the subcellular distribution of DISC1 may be useful as a marker that indicates specific mental conditions, especially if the changes are commonly observed in both brains and peripheral tissues.
Supplementary Material
Acknowledgments
We thank Drs. M. B. Knable, E. F. Torrey, M. J. Webster, and R.H. Yolken from The Stanley Foundation Brain Collection for providing postmortem brains; Drs. K. Millar (University of Edinburgh, Edinburgh) and T. Katayama (Osaka University, Suita, Japan) for providing us their antibodies; Dr. Pamela Talalay and Ms. Jaime Cheah for critical reading of the manuscript; and Ms. Y. Lema for her help in preparing the manuscript. This work was supported by U.S. Public Heath Service Grant MH-069853 (to A.S.) and foundation grants from the National Alliance for Research on Schizophrenia and Depression (A.S.), the Stanley Foundation (A.S. and C.A.R.), and S-R (A.S.).
Author contributions: N.S. and A.S. designed research; N.S. and T.S.-Y. performed research; N.S., T.S.-Y., Y.O., and C.A.R. contributed new reagents/analytic tools; N.S. and T.S.-Y. analyzed data; and N.S., T.S.-Y., and A.S. wrote the paper.
This paper was submitted directly (Track II) to the PNAS office.
Abbreviations: BP, bipolar disorder; DISC1, Disrupted-In-Schizophrenia 1; MD, major depression; NORM, normal control; P, crude nuclear pellet; PMI, postmortem interval; S, postnuclear supernatant; SZ, schizophrenia.
Footnotes
Kirkpatrick, B. & Sawa, A., Society for Neuroscience 33rd Annual Meeting, Nov. 8–12, 2003, New Orleans.
References
- 1.Sawa, A. & Snyder, S. H. (2002) Science 296, 692–695. [DOI] [PubMed] [Google Scholar]
- 2.Harrison, P. J. & Weinberger, D. R. (2005) Mol. Psychiatry 10, 40–68. [DOI] [PubMed] [Google Scholar]
- 3.St. Clair, D., Blackwood, D., Muir, W., Carothers, A., Walker, M., Spowart, G., Gosden, C. & Evans, H. J. (1990) Lancet 336, 13–16. [DOI] [PubMed] [Google Scholar]
- 4.Millar, J. K., Wilson-Annan, J. C., Anderson, S., Christie, S., Taylor, M. S., Semple, C. A., Devon, R. S., Clair, D. M., Muir, W. J., Blackwood, D. H., et al. (2000) Hum. Mol. Genet. 9, 1415–1423. [DOI] [PubMed] [Google Scholar]
- 5.Blackwood, D. H., Fordyce, A., Walker, M. T., St. Clair, D. M., Porteous, D. J. & Muir, W. J. (2001) Am. J. Hum. Genet. 69, 428–433. [DOI] [PMC free article] [PubMed] [Google Scholar]
- 6.Ekelund, J., Hovatta, I., Parker, A., Paunio, T., Varilo, T., Martin, R., Suhonen, J., Ellonen, P., Chan, G., Sinsheimer, J. S., et al. (2001) Hum. Mol. Genet. 10, 1611–1617. [DOI] [PubMed] [Google Scholar]
- 7.Ekelund, J., Hennah, W., Hiekkalinna, T., Parker, A., Meyer, J., Lonnqvist, J. & Peltonen, L. (2004) Mol. Psychiatry 9, 1037–1041. [DOI] [PubMed] [Google Scholar]
- 8.Hennah, W., Varilo, T., Kestila, M., Paunio, T., Arajarvi, R., Haukka, J., Parker, A., Martin, R., Levitzky, S., Partonen, T., et al. (2003) Hum. Mol. Genet. 12, 3151–3159. [DOI] [PubMed] [Google Scholar]
- 9.Hodgkinson, C. A., Goldman, D., Jaeger, J., Persaud, S., Kane, J. M., Lipsky, R. H. & Malhotra, A. K. (2004) Am. J. Hum. Genet. 75, 862–872. [DOI] [PMC free article] [PubMed] [Google Scholar]
- 10.Miyoshi, K., Honda, A., Baba, K., Taniguchi, M., Oono, K., Fujita, T., Kuroda, S., Katayama, T. & Tohyama, M. (2003) Mol. Psychiatry 8, 685–694. [DOI] [PubMed] [Google Scholar]
- 11.Millar, J. K., Christie, S. & Porteous, D. J. (2003) Biochem. Biophys. Res. Commun. 311, 1019–1025. [DOI] [PubMed] [Google Scholar]
- 12.Ozeki, Y., Tomoda, T., Kleiderlein, J., Kamiya, A., Bord, L., Fujii, K., Okawa, M., Yamada, N., Hatten, M. E., Snyder, S. H., et al. (2003) Proc. Natl. Acad. Sci. USA 100, 289–294. [DOI] [PMC free article] [PubMed] [Google Scholar]
- 13.Morris, J. A., Kandpal, G., Ma, L. & Austin, C. P. (2003) Hum. Mol. Genet. 12, 1591–1608. [DOI] [PubMed] [Google Scholar]
- 14.James, R., Adams, R. R., Christie, S., Buchanan, S. R., Porteous, D. J. & Millar, J. K. (2004) Mol. Cell. Neurosci. 26, 112–122. [DOI] [PubMed] [Google Scholar]
- 15.Ma, L., Liu, Y., Ky, B., Shughrue, P. J., Austin, C. P. & Morris, J. A. (2002) Genomics 80, 662–672. [DOI] [PubMed] [Google Scholar]
- 16.Brandon, N. J., Handford, E. J., Schurov, I., Rain, J. C., Pelling, M., Duran-Jimeniz, B., Camargo, L. M., Oliver, K. R., Beher, D., Shearman, M. S., et al. (2004) Mol. Cell. Neurosci. 25, 42–55. [DOI] [PubMed] [Google Scholar]
- 17.Torrey, E. F., Webster, M., Knable, M., Johnston, N. & Yolken, R. H. (2000) Schizophr. Res. 44, 151–155. [DOI] [PubMed] [Google Scholar]
- 18.Sawa, A., Khan, A. A., Hester, L. D. & Snyder, S. H. (1997) Proc. Natl. Acad. Sci. USA 94, 11669–11674. [DOI] [PMC free article] [PubMed] [Google Scholar]
- 19.Sudoh, S., Kawamura, Y., Sato, S., Wang, R., Saido, T. C., Oyama, F., Sakaki, Y., Komano, H. & Yanagisawa, K. (1998) J. Neurochem. 71, 1535–1543. [DOI] [PubMed] [Google Scholar]
- 20.Sawamura, N., Gong, J. S., Garver, W. S., Heidenreich, R. A., Ninomiya, H., Ohno, K., Yanagisawa, K. & Michikawa, M. (2001) J. Biol. Chem. 276, 10314–10319. [DOI] [PubMed] [Google Scholar]
- 21.Gu, Y., Misonou, H., Sato, T., Dohmae, N., Takio, K. & Ihara, Y. (2001) J. Biol. Chem. 276, 35235–35238. [DOI] [PubMed] [Google Scholar]
- 22.Andrews, N. C. & Faller, D. V. (1991) Nucleic Acids Res. 19, 2499. [DOI] [PMC free article] [PubMed] [Google Scholar]
- 23.Hua, X., Sakai, J., Brown, M. S. & Goldstein, J. L. (1996) J. Biol. Chem. 271, 10379–10384. [DOI] [PubMed] [Google Scholar]
- 24.Sawamura, N., Ko, M., Yu, W., Zou, K., Hanada, K., Suzuki, T., Gong, J. S., Yanagisawa, K. & Michikawa, M. (2004) J. Biol. Chem. 279, 11984–11991. [DOI] [PubMed] [Google Scholar]
- 25.Schurov, I. L., Handford, E. J., Brandon, N. J. & Whiting, P. J. (2004) Mol. Psychiatry 9, 1100–1110. [DOI] [PubMed] [Google Scholar]
- 26.Taylor, M. S., Devon, R. S., Millar, J. K. & Porteous, D. J. (2003) Genomics 81, 67–77. [DOI] [PubMed] [Google Scholar]
- 27.Koh, P. O., Bergson, C., Undie, A. S., Goldman-Rakic, P. S. & Lidow, M. S. (2003) Arch. Gen. Psychiatry 60, 311–319. [DOI] [PubMed] [Google Scholar]
- 28.Knable, M. B. (1999) Schizophr. Res. 39, 149–152. [DOI] [PubMed] [Google Scholar]
- 29.Koh, P. O., Undie, A. S., Kabbani, N., Levenson, R., Goldman-Rakic, P. S. & Lidow, M. S. (2003) Proc. Natl. Acad. Sci. USA 100, 313–317. [DOI] [PMC free article] [PubMed] [Google Scholar]
- 30.Tkachev, D., Mimmack, M. L., Ryan, M. M., Wayland, M., Freeman, T., Jones, P. B., Starkey, M., Webster, M. J., Yolken, R. H. & Bahn, S. (2003) Lancet 362, 798–805. [DOI] [PubMed] [Google Scholar]
- 31.Emamian, E. S., Hall, D., Birnbaum, M. J., Karayiorgou, M. & Gogos, J. A. (2004) Nat. Genet. 36, 131–137. [DOI] [PubMed] [Google Scholar]
- 32.Porrino, L. J. & Lyons, D. (2000) Cereb. Cortex 10, 326–333. [DOI] [PubMed] [Google Scholar]
- 33.Bechara, A., Damasio, H. & Damasio, A. R. (2000) Cereb. Cortex 10, 295–307. [DOI] [PubMed] [Google Scholar]
- 34.Rolls, E. T. (2000) Cereb. Cortex 10, 284–294. [DOI] [PubMed] [Google Scholar]
- 35.Kringelbach, M. L. & Rolls, E. T. (2004) Prog. Neurobiol. 72, 341–372. [DOI] [PubMed] [Google Scholar]
- 36.London, E. D., Ernst, M., Grant, S., Bonson, K. & Weinstein, A. (2000) Cereb. Cortex 10, 334–342. [DOI] [PubMed] [Google Scholar]
- 37.Volkow, N. D. & Fowler, J. S. (2000) Cereb. Cortex 10, 318–325. [DOI] [PubMed] [Google Scholar]
Associated Data
This section collects any data citations, data availability statements, or supplementary materials included in this article.