

Abstract
Cytoglobin (Cygb), like other members of the globin family, is a nitric oxide (NO) dioxygenase, metabolizing NO in an oxygen (O2)‐dependent manner. We examined the effect of modification of cysteine sulfhydryl groups of Cygb on its O2 binding and NO dioxygenase activity. The two cysteine sulfhydryls of Cygb were modified to form either an intramolecular disulfide bond (Cygb_SS), thioether bonds to N‐ethylmaleimide (NEM; Cygb_SC), or were maintained as free SH groups (Cygb_SH). It was observed that the NO dioxygenase activity of Cygb only slightly changed (~ 25%) while the P50 of O2 binding to Cygb changed over four‐fold with these modifications. Our results suggest that it is possible to separately regulate one Cygb function (such as O2 binding) without largely affecting the other Cygb functions (such as its NO dioxygenase activity).
Keywords: cytoglobin, disulfide bond, NO dioxygenation
Abbreviations
- Absb
the absorbance at baseline or when time t approaches to infinity
- Asc
ascorbate
- b5
cytochrome b5
- b5R
cytochrome b5 reductase
- Cygb‐SC
cytoglobin with thioether bonds between a cysteine residue and N‐ethylmaleimide
- Cygb‐SH
cytoglobin with free sulfhydryl group
- Cygb‐SS
cytoglobin with intramolecular disulfide bond
- DT
dithionite
- DTT
dithiothreitol
Cytoglobin (Cygb), a member of the globin family, was discovered 15 years ago 1, 2, 3. Like other family members such as hemoglobin (Hb) and myoglobin (Mb), Cygb is a nitric oxide (NO) dioxygenase, which metabolizes NO in an oxygen (O2)‐dependent manner 4, 5. Cygb is present in splanchnic fibroblasts of various organs 6, fibroblast‐related cell lineages 7, and other cell types such as neurons 8, 9, hepatocytes 10, 11, and vascular smooth muscle cells 12. In vivo, Cygb may play several different roles including tumor‐suppression 13, lipid signaling of oxidative stress 14, ROS protection 15, 16, 17, NO metabolism 4, 12, nitrite reduction18, and regulation of vascular NO concentration 5, 19.
The Cygb monomer contains two exposed cysteine residues (Cys 38 and Cys 83) that enable Cygb to form an intramolecular disulfide bond 20, 21, 22. The formation of this intramolecular disulfide bond greatly increases the dissociation rate constant of a bound intrinsic histidine, resulting in a greater apparent binding constant of extrinsic ligands 21, 22. As a NO dioxygenase, O2 must bind to Cygb before it metabolizes NO. Under hypoxic conditions, Cygb with intramolecular disulfide bond (Cygb‐SS) holds more O2 in the form of Cygb(Fe2+O2) than Cygb with free sulfhydryl group (Cygb‐SH) and Cygb with thioether bonds between a cysteine residue and N‐ethylmaleimide (NEM; Cygb‐SC). However, the NO dioxygenase activity of Cygb is limited and effectively controlled by the rate of Cygb reduction 23. Thus, if the rate of Cygb reduction is not altered by modification of the sulfhydryl groups in the Cygb, the NO dioxygenase activity of Cygb may not be greatly affected even under hypoxic conditions.
It was suggested that Cygb in vivo is monomeric 20, 24. However, Cygb dimer and other oligomers have been reported to exist in Cygb preparations 22, 25. Although both Cygb monomer and oligomers are of interest to study, the monomer is reported to be the predominant form both in vivo and in vitro 18, 20, 24. Therefore, in this study, we focus on examination of the effect of modifying the sulfhydryl groups of the cysteine residues in monomeric Cygb on the affinity of O2 binding and the rate of Cygb‐mediated O2‐dependent NO metabolism in the presence of cellular reductants.
Materials and methods
Modification of the sulfhydryl groups of the cysteine residues (RSH) of Cygb
The expression and purification process of Cygb was described in our prior reports 5. As isolated Cygb was first treated with dithiothreitol (DTT, C4H10O2S2) in phosphate‐buffered saline (PBS) buffer (pH = 7.4 with 0.1 mm EDTA) on ice for about 30 min to reduce any remaining disulfide bonds in the Cygb preparation, forming a nearly homogeneous solution of Cygb in the sulfhydryl form (Cygb‐SH). This protein was run through a G‐25 column to remove the excess DTT then aliquoted for treatment to modify the free thiol groups as follows: reaction with 2 mm NEM (C6H7NO2 MW: 125.13) to alkylate reactive thiol groups (Cygb‐SC), or 4 mm 4,4′‐dithiodipyridine (4‐PDS, C10H8N2S2 MW: 220.3) to drive disulfide bond formation (Cygb‐SS) at room temperature for 1 h. After the incubation period, the samples were concentrated and again run through a G‐25 column to remove excess reactants. The purity of the three products Cygb‐SS, Cygb‐SH, and Cygb‐SC was determined by comparing the concentration of a given sample of Cygb (measured by the pyridine hemochromagen assay 26) with the concentration of free thiols of the same Cygb sample (measured by the 4‐PDS method 27). The final average percentage of thiol modification is > 90%.
PAGE and Coomassie staining of pure Cygb
Pure Cygb (10 ng) was loaded to 4–20% gradient gels under nonreducing conditions. Protein samples were separated at 150 V for ~ 90 min. At the end of separation, gels were incubated with 1% Coomassie stain in 40% methanol and 10% acetic acid. After 2 h of staining, gels were destained with repeated 15 min incubations with ~ 20 mL of destaining solution (40% methanol and 10% acetic acid) until bands were clear. Gels were then imaged with a Bio‐Rad (Hercules, CA, USA) Versadoc imaging system using quantityone imaging software.
Measurements of O2 binding and redox state of Cygb(Fe2+)
A Cary 50 UV/Vis spectrophotometer was used to measure the changes in absorbance at 428 nm (A428; peak absorbance of Cygb(Fe2+)) with time in the process of reduction of Cygb(Fe3+) and O2 binding to Cygb(Fe2+). Simultaneously, a Clark O2 electrode was placed in the solution to monitor the changes in O2 concentration ([O2], 37 °C). Both A428 and [O2] were sampled at the same rate (10 readings per second). After 1.5 mL of buffer solution and Cygb(Fe3+) were added into the cuvette, the cuvette was covered with a Parafilm membrane. An argon gas tube with an outer diameter of 1 mm was inserted into the cuvette that was covered by a parafilm membrane and positioned above the solution surface to keep an argon flow in the cuvette to gradually remove O2 from the solution. When O2 in the solution decreased by about half, ~ 1 mm dithionite (DT) was injected into the solution to rapidly scavenge all O2 and reduce Cygb(Fe3+) to Cygb(Fe2+) in the cuvette. Although the recordings of O2 concentration and the absorbance of Cygb(Fe2+) were started before injection of DT, time 0 was assigned to the time point at which DT was added into the solution. At this moment, both [O2] and A428 suddenly changed. This time point was used as the starting point for synchronizing the readings of A428 and [O2], which is important for matching the percent of O2 bound to Cygb(Fe2+) with the corresponding [O2] in the solution. After Cygb was reduced and O2 was scavenged from both the solution and the gas phase, the gas tube was taken out of the cuvette, and the hole in the Parafilm membrane for the gas tube was sealed by a piece of Parafilm. A syringe needle was used to make a tiny hole on the Parafilm so that O2 in the air could enter the gas phase of the cuvette slowly. The entered O2 was gradually dissolved into the test solution to raise the O2 concentration in the solution at a rate of ~ 0.04–0.06 μm·s−1 to maintain the O2 binding process near the equilibrium. The dissolved O2 can bind on Cygb(Fe2+) to form Cygb(Fe2+O2).
Electrochemical measurements of the rate of O2‐dependent NO metabolism by Cygb
The measurements were performed in a four‐port water‐jacketed electrochemical chamber (NOCHM‐4 from WPI, Sarasota, FL, USA) containing 2 mL of Dulbecco's PBS (Thermo Scientific, South Logan, UT, USA) as previously described 5, 19. The NO solution was also prepared as previously described 28, 29. After the NO and O2 electrodes had stabilized, NO (0.5 μm) was injected into the aerated buffer solution (under room air) in the absence of Cygb and reductants. When the NO concentration decreased to baseline, 0.4 μm Cygb, 400 U·mL−1 superoxide dismutase (SOD) from horseradish (Sigma‐Aldrich, St. Louis, MO, USA) or 50 μm SOD mimetic (GC4419, Galera Therapeutics Inc., Malvern, PA, USA), and either ascorbate (Asc; Sigma‐Aldrich) or cytochrome b5 reductase (b5R) with NADH (Sigma‐Aldrich) and cytochrome b5 (b5) were added to the chamber. Then 0.5 μm NO was injected into the solution to measure the rate of NO consumption under room air. To measure the rate of NO consumption by Cygb at different O2 concentrations below 200 μm, argon gas tube was introduced into the chamber above the solution through a hole in the cap for removing O2 from the solution. While [O2] in the solution was gradually decreased due to the flow of argon gas, equal amounts of 0.5 μm NO were repeatedly injected into the solution. Changes in [O2] and [NO] over time were recorded by the O2 and NO electrodes, respectively. From the recorded temporal [NO] and [O2] curves, the rate of NO decay (VNO) at each NO peak and the corresponding [O2] were measured and used to plot the VNO vs. [O2] curves.
Spectrophotometric measurements of Cygb(Fe3+) reduction by Asc or by the b5R/b5/NADH enzyme‐reducing system
Measurements were performed on a Cary 50 UV/Vis spectrophotometer. After 1.5 mL of buffer solution was added into the cuvette, the cuvette was covered with a Parafilm membrane. A Clark O2 electrode was placed in the solution to monitor O2 concentration. The measured O2 concentrations were recorded by an Apollo 4000 Free Radical Analyzer (WPI) using a Clark electrode. The solution was stirred using a magnetic stirring bar that was placed on the bottom of the cuvette. An argon gas tube was inserted in the cuvette to bubble argon into the solution for 15 min to quickly remove O2. Before injecting Cygb (for reduction by Asc) or Cygb + b5 + NADH (for reduction by the reducing system b5R/b5/NADH) into the solution, the argon gas tube was placed just above the solution surface to keep an argon flow in the cuvette. About 20 min after injection of Cygb or Cygb/b5/NADH, Asc or b5R was added to the solution to initiate reduction of Cygb(Fe3+), respectively. The reaction process was monitored by measuring the changes in absorbance at 416 nm (peak absorbance of Cygb(Fe3+)) with time 30.
Equations for determining rate constants of Cygb reduction
The reduction scheme of Cygb(Fe3+) reduction by Asc has been proposed in our previous paper 30:
| (1) |
where A is reductant, B is Cygb(Fe3+), C is the complex Cygb(Fe3+ A), and D is Cygb(Fe2+ A +). In the following derivation process, concentrations of A, B, C, D and the total Cygb protein E are presented by [A], [B], [C], [D], and [E], respectively. [E] = [B] + [C] + [D] for any time t. Since E is the total Cygb concentration including B, C, and D, E is considered as a constant in the experiments assuming that Cygb only has the three forms B, C, and D. Concentrations of A, B, C, and D in the beginning of the reaction (t = 0) are written as [A]0, [B]0, [C]0, [D]0, respectively. At t = 0, we assume that [B]0 = [E], [C]0 = [D]0 = 0. Using steady‐state approximation, the complex C is an intermediate and its concentration is assumed in the steady‐state or d[C]/dt = 0. Thus, we can obtain:
Under the steady‐state approximation (dC/dt = 0), the rate of B consumption is equal to the rate of D formation. From the above equations we can obtain (see Data S1):
| (2) |
where g 1 can be considered as the rate constant of reduction of B by A. In Eqn (3), d[B]/dt approaches 0 as t approaches to infinity. Thus, [B] approaches [B b] as t approaches infinity. Here, [B b] is concentration of B at t = ∞. From Eqn (3) we obtain:
| (3) |
where g 0 is an integration constant. In experiments for measuring the reduction of Cygb(Fe3+), we used a UV/Vis spectrophotometer to monitor the changes in absorbance (Abs) at wavelength 416 nm. According to the Beer–Lambert Law, we have:
| (4) |
where εB, εC and εD are the molar extinction coefficients of B, C and D, respectively. Abs is the absorbance at time t. If time t is large (theoretically t approaches infinity), Eqn (4) can be written in the following form:
| (5) |
where Absb is the aborbance as t approaches infinity.
We also have: [D] = [E] − [B] − [C] and [D b] = [E] − [B b] − [C b]. Here, [C b] and [D b] are concentrations of C and D as t approaches infinity. Combining these two equations with Eqs (4) and (5) gives:
| (6) |
| (7) |
Then we can get:
| (8) |
Under steady‐state approximation, C is a constant during the measurements of absorbance. Thus, we can obtain:
| (9) |
Substituting Eqn (9) into Eqn (3), we have:
| (10) |
Equation (10) indicates that the plot of ln(Abs − Absb) vs. t from experimental data will generate a straight line with a slope of −g 1.
Results
PAGE and Coomassie staining of Cygb
PAGE followed by Coomassie staining was performed to characterize each of the Cygb preparations including the reduced protein Cygb‐SH (SH), the oxidized disulfide Cygb‐SS (SS), and NEM‐modified Cygb‐SC (SC). The resolved gel of the three types of Cygb preparations is shown in Fig. 1. The pure Cygb bands appear with a molecular weight of ~ 21 kDa. The bands in the right column are protein markers with molecular weights indicated. In all three of the Cygb preparations, only monomeric Cygb is present. Any possible dimer form may have been converted into monomer in the preparation of Cygb samples with DTT.
Figure 1.
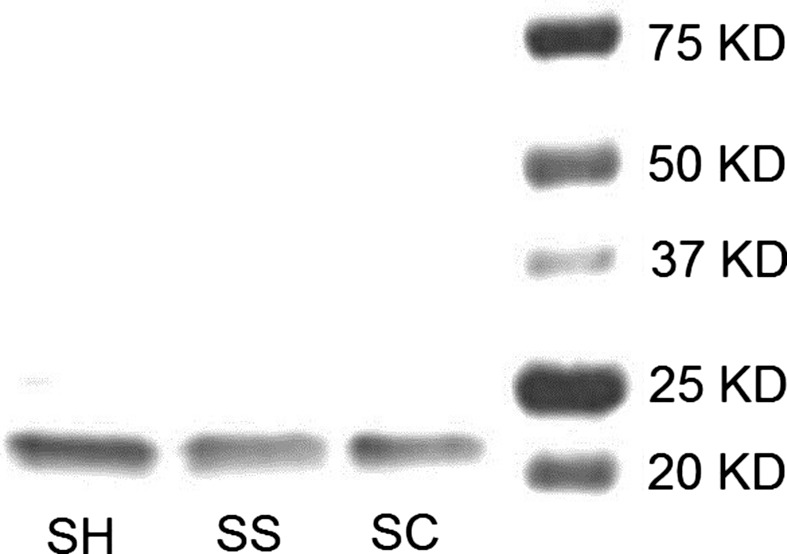
SDS/PAGE analysis of the Cygb preparations (SH, SS and SN represent Cygb‐SH, Cygb‐SS, and Cygb‐SC). Cygb (10 ng) was loaded on PAGE gels under nonreducing conditions. Gels were Coomassie‐stained and imaged. A single band is seen at ~ 21 kDa indicating that only monomeric Cygb was present.
O2‐binding curves of modified Cygbs
To examine the effect of modifying the sulfhydryl groups of cysteine on the affinity of O2 binding to Cygbs, we measured O2‐binding curves for each of the three Cygb preparations at 37 °C. Figure 2 shows typical experimental O2‐binding curves. It can be seen that the P50 of Cygb has the following order: Cygb‐SS < Cygb‐SH < Cygb‐SC. The mean and standard errors of the P50 values (n = 3) for the three Cygbs are listed in Table 1 (unit in mmHg or Torr).
Figure 2.
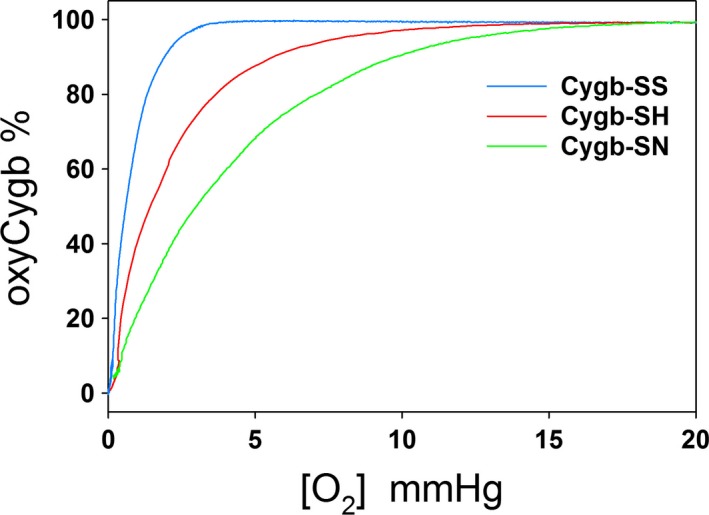
Experimental curves of O2 binding to 3 μm Cygb‐SS, Cygb‐SH, and Cygb‐SC.
Table 1.
Measured P50 (mmHg) for O2 binding to Cygb
| Proteins | Cygb‐SS | Cygb‐SH | Cygb‐SC |
|---|---|---|---|
| Mean | 0.7 | 1.4 | 2.9 |
| SE | 0.1 | 0.1 | 0.2 |
Reduction of modified Cygbs
During NO dioxygenation, O2 binds to Cygb(Fe2+) to form Cygb(Fe2+O2) which can be oxidized to Cygb(Fe3+) by NO. To maintain continuity of NO dioxygenation, a reductant (such as Asc) is required for reducing Cygb(Fe3+) back to Cygb(Fe2+). The reduction of the three Cygb(Fe3+) preparations by Asc (1–20 mm) and by b5R (5–120 nm)/b5 (0.5 μm)/NADH (100 μm) was measured with a spectrophotometric assay. It was observed that either Asc or b5R in the presence of b5 (0.5 μm) and NADH (100 μm) cannot fully reduce each of the Cygbs including Cygb‐SH, Cygb‐SC, and Cygb‐SS in the concentration range listed above, but full reduction could be accomplished by 1 mm DT. In Fig. 3 we demonstrated the typical experimental curves for reduction of Cygb‐SH by Asc (Fig. 3A) and b5R/b5/NADH (Fig. 3B). From the experimental data, we plotted ln(Abs − Absb) vs. time t based on Eqn (10) (Fig. 3C,D). All plots with Asc as the reductant are linear with time after 2–5 s from the initial injection of Asc (Fig. 3C). From the slopes of these lines, we obtained the pseudo first‐order rate constant g 1, which (shown as k Asc or k b5R in Fig. 3E–F) is linear with reductant concentration [Asc] or [b5R]. In Fig 4A,B, we demonstrated the plots of ln(Abs − Absb) vs. time t for Cygb‐SH, Cygb‐SS, and Cygb‐SC reduction by 10 mm Asc or 30 nm b5R in the presence of 0.5 μm b5 and 100 μm NADH. All plots are nearly linear. From the slopes of the lines, we can determine the pseudo first‐order rate constants of reduction of the three Cygbs by Asc (10 mm) or by b5R (30 nm) in the presence of 0.5 μm b5 and 100 μm NADH. The pseudo first‐order rate constants of Cygb‐SH, Cygb‐SS, and Cygb‐SC at other Asc and b5R concentrations are shown in Fig 4C (for Asc) and Fig. 4D (for b5R).
Figure 3.
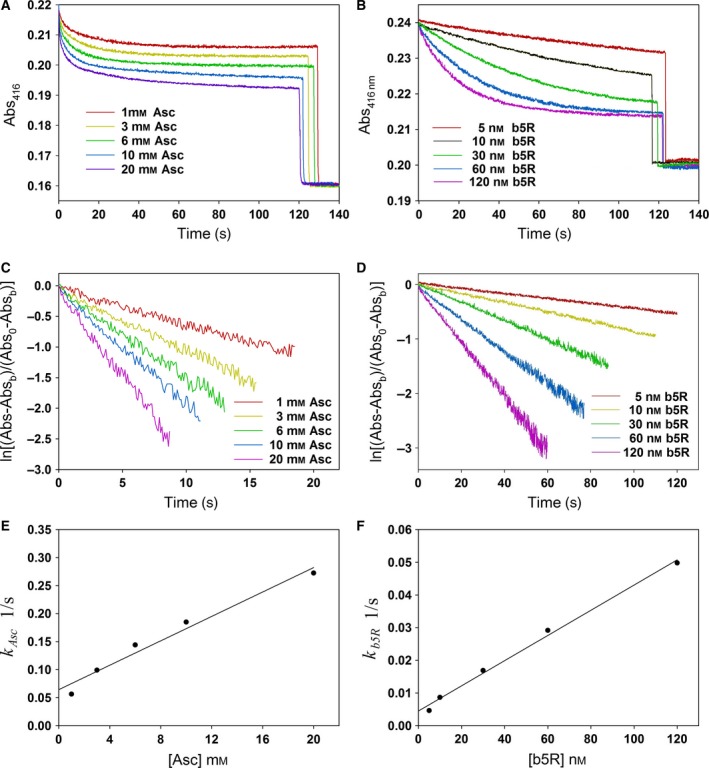
Reduction of Cygb‐SH by cellular reductants. Measurements of absorbance at 416 nm while 2 μm Cygb‐SH was reduced by different concentrations of Asc (A) or by different concentrations of b5R in the presence of 0.5 μm b5 and 100 μm NADH (B). Plot of ln(Abs − Absb) vs. time as 2 μm Cygb‐SH was reduced by varied concentrations of Asc (C), and by varied concentrations of b5R in the presence of 0.5 μm b5 and 100 μm NADH (D). Plots of rate constants of Cygb‐SH reduction vs. Asc (E) or b5R (F). Rate constants of Cygb‐SH reduction by varied Asc or b5R were obtained from the slopes of the lines in (C) and (D).
Figure 4.
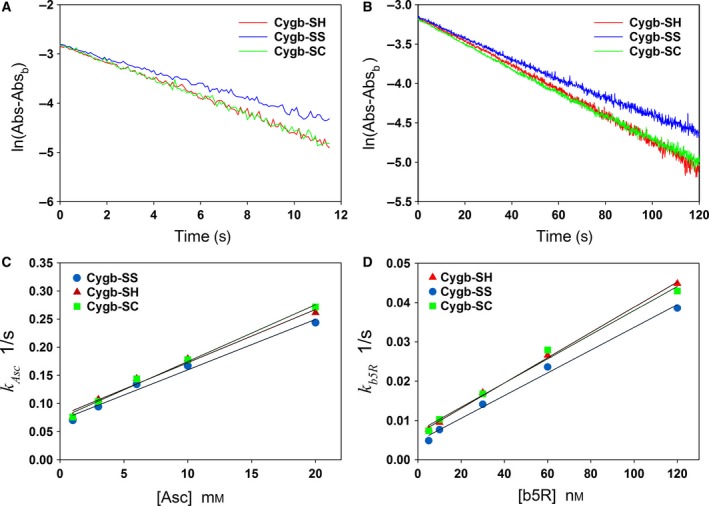
Reduction of three Cygbs (Cygb‐SH, Cygb‐SS, and Cygb‐SC) by varied concentrations of Asc or b5R. Plots of ln(Abs − Absb) vs. time as the three Cygbs (~ 3 μm) were reduced by 10 mm Asc (A) or 30 nm b5R in the presence of 0.5 μm b5 and 100 μm NADH (B). Plots of rate constants of 2 μm Cygbs (Cygb‐SH, Cygb‐SS, and Cygb‐SC) reduction by varied Asc concentrations (C) or by varied b5R concentration in the presence of 0.5 μm b5 and 100 μm NADH (D).
O2‐dependent NO metabolism by modified Cygbs
The Cygb‐mediated O2‐dependent NO metabolism was examined by simultaneously measuring changes in NO and O2 concentrations with NO and O2 electrodes. The rates of NO metabolism in the presence of 0.4 μm Cygbs and 400 μm Asc under varying O2 concentrations are shown in Fig. 5. The rate of NO metabolism by Cygb‐SS under room air is lower than that by Cygb‐SH and Cygb‐SC. The measured rates of NO decay (VNO) under room air (at ~ 200 μm [O2]) are 13.0 ± 1.2 nm·s−1 (Cygb‐SS), 16.1 ± 1.0 nm·s−1 (Cygb‐SH), and 16.7 ± 1.2 nm·s−1 (Cygb‐SC). When O2 in the solution was gradually decreased, the rate of NO metabolism by the three Cygbs gradually decreased in a similar pattern.
Figure 5.
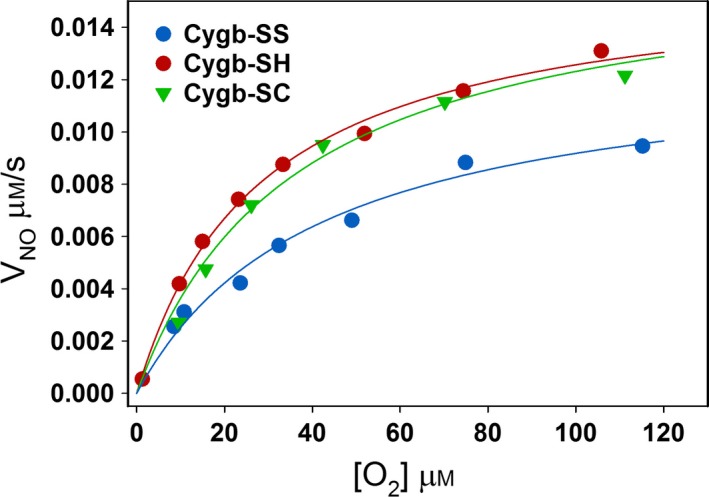
Plots of VNO of Cygbs vs [O2]. Rate of NO metabolism by 0.4 μm of Cygb‐SS, Cygb‐SH, and Cygb‐SC in the presence of 400 μm Asc at different O2 concentrations.
Discussion
Like other globins, Cygb binds O2 at the sixth coordination site apical to the heme iron. The intrinsic histidine of Cygb competes with O2 binding at the sixth coordination site. It has been reported that formation of an intramolecular disulfide bond in Cygb can largely change the equilibrium binding constant of the intrinsic distal histidine 21, which can significantly change the apparent O2‐binding equilibrium constant. The disulfide bond, if formed, can be reduced by DTT to form two free SH groups. It was reported that the P50 of O2 binding to Cygb is 1.8 Torr after Cygb is treated with DTT 20, 31, while the P50 of O2 binding to Cygb without DTT treatment was reported in the range between 0.2 and 1 Torr 3, 20, 32. We tested O2 binding behaviors for Cygb‐SS (P50 = 0.7 Torr), Cygb‐SH (P50 = 1.4 Torr) and Cygb‐SC (P50 = 2.9 Torr). The measured P50 values for Cygb‐SS and Cygb‐SH (Fig. 2 and Table 1) are in the range of reported values in the literature. Furthermore, we observed that P50 for Cygb‐SC is greater than that for Cygb‐SH.
We then examined the effect of modification of the sulfhydryl group of the cysteines of Cygb on the rate of Cygb reduction. Chemical kinetics with mathematical modeling is a powerful tool to study complicated reaction processes 5, 33, 34, 35. Using this tool, we obtained Eqn (10) for determining the rate constant of Cygb reduction from experimental data of spectrophotometric measurements. It was observed that the rate of Cygb‐SH, Cygb‐SC, and Cygb‐SS reduction by Asc and by b5R/b5/NADH increases with Asc and b5R concentration, respectively. A group of typical experimental curves for the reduction of Cygb‐SH with varying concentrations of Asc (1–20 mm) and b5R (5–120 nm) were shown in Fig. 3A,B. Using Eqn (10), we determined the pseudo first‐order rate constants from the experimental curves in Fig. 3A,B. The data process was demonstrated in Fig. 3C–F. From Fig. 3E,F, we can see that the determined pseudo first‐order rate constants are nearly linear with Asc or b5R concentrations, and the intercepts of the fitted lines are greater than zero. From the slopes of the plots shown in Fig. 4A–D, we can see that the pseudo first‐order rate constants of Cygb‐SH, Cygb‐SC, and Cygb‐SS reduction by Asc and b5R/b5/NADH are close to each other with the rate constant of Cygb‐SS reduction ~ 25% lower than those of Cygb‐SH and Cygb‐SC. Because the rate of Cygb reduction is the rate‐limiting step for NO dioxygenase activity of Cygb 23, the small differences (~ 25%) in rate constants of Cygb reduction after modification of sulfhydryl groups imply that the modification of sulfhydryl groups on the Cygb only cause a small effect on the NO dioxygenase activity of Cygb although this modification more largely shifts the apparent O2‐binding constant. Correspondingly, the differences in the O2‐dependent NO dioxygenase activity for the three Cygbs (Fig. 5) parallel the differences in their reduction rates with ~ 25% decrease seen in Cygb‐SS compared to Cygb‐SH and Cygb‐SC (Fig. 4A).
The process of NO dioxygenation requires O2 binding to Cygb to form Cygb(Fe2+O2) which can rapidly react with NO. If we gradually remove O2 from the test solution, O2 concentration in the solution will gradually decrease. Since the modification of sulfhydryl groups of Cygb can shift the P50, differences in the Cygb(Fe2+O2) concentration for the three Cygb preparations may be seen when pO2 drops below 10 Torr (Fig. 2). From Fig. 2 we see that Cygb‐SS will have the highest Cygb(Fe2+O2) concentration and Cygb‐SC will have the lowest. Thus, under low pO2 conditions, one could speculate that the NO dioxygenase activity by Cygb‐SS might be the highest among the three Cygbs. However, only a small change in the NO dioxygenase activity was observed for Cygb‐SS compared to Cygb‐SH or Cygb‐SC at O2 concentrations below 120 μm (Fig. 5). Thus, although the modification of the sulfhydryl groups on the Cygb can largely increase the apparent O2‐binding constant of Cygbs in the absence of NO, the bound O2 on ferrous Cygb or Cygb(Fe2+O2) can be immediately removed by NO if NO is present in the solution because NO rapidly reacts with Cygb(Fe2+O2) to form and Cygb(Fe3+). As a result, almost all of Cygb(Fe2+O2) will react with NO in a short time. The NO dioxygenase activity is then limited by the rate‐limiting step, reduction of Cygb. The modification of the sulfhydryl groups on Cygb does not greatly change the rate of Cygb reduction; therefore, the NO dioxygenase activity is only modestly affected by the modification of the sulfhydryl groups of Cygb.
In summary, the modification of the sulfhydryl groups on Cygb can largely change (~ 4‐fold) the apparent constant of O2 binding to Cygb. However, this modification only causes a small difference (~ 25%) in the rate constant of Cygb reduction and NO consumption by Cygb. These results indicate that it is possible to largely change one property of Cygb (such as O2 binding ability) and keep another property of Cygb (such as NO dioxygenase activity) almost unchanged or only modest change.
Author contributions
XL and JLZ supervised the work of this study. AL provided supervision and support for DZ. XL wrote the paper with input from JLZ. DZ performed spectrophotometric and electrochemical experiments. XL and DZ designed experiments and analyzed data with input from JLZ. CH and DZ prepared Cygb samples and wrote the related methods. JB performed PAGE experiments and wrote the related methods. XL, JLZ, CH, JB, DZ, and AL all contributed to the manuscript and its revisions.
Supporting information
Data S1. Equations for determining rate constants of Cygb reduction.
Acknowledgements
The authors thank Moustafa Helal for assistance in PAGE experiments and Yuefeng Zhou for assistance in performing electrochemical measurements. DZ was supported by the scholarship from China Scholarship Council to pursue a joint PhD program abroad. This research was supported by NIH R01EB016096 (JLZ), R01HL131941 (JLZ and XL), and Dean's Bridge Grant from OSU College of Medicine (XL).
Contributor Information
Aiqin Luo, Email: bitluo@bit.edu.cn.
Jay L. Zweier, Email: Jay.zweier@osumc.edu
Xiaoping Liu, Email: liu.547@osu.edu.
References
- 1. Kawada N, Kristensen DB, Asahina K, Nakatani K, Minamiyama Y, Seki S and Yoshizato K (2001) Characterization of a stellate cell activation‐associated protein (STAP) with peroxidase activity found in rat hepatic stellate cells. J Biol Chem 276, 25318–25323. [DOI] [PubMed] [Google Scholar]
- 2. Burmester T, Ebner B, Weich B and Hankeln T (2002) Cytoglobin: a novel globin type ubiquitously expressed in vertebrate tissues. Mol Biol Evol 19, 416–421. [DOI] [PubMed] [Google Scholar]
- 3. Trent JT 3rd and Hargrove MS (2002) A ubiquitously expressed human hexacoordinate hemoglobin. J Biol Chem 277, 19538–19545. [DOI] [PubMed] [Google Scholar]
- 4. Gardner AM, Cook MR and Gardner PR (2010) Nitric‐oxide dioxygenase function of human cytoglobin with cellular reductants and in rat hepatocytes. J Biol Chem 285, 23850–23857. [DOI] [PMC free article] [PubMed] [Google Scholar]
- 5. Liu X, Follmer D, Zweier JR, Huang X, Hemann C, Liu K, Druhan LJ and Zweier JL (2012) Characterization of the function of cytoglobin as an oxygen‐dependent regulator of nitric oxide concentration. Biochemistry 51, 5072–5082. [DOI] [PubMed] [Google Scholar]
- 6. Nishi H, Inagi R, Kawada N, Yoshizato K, Mimura I, Fujita T and Nangaku M (2011) Cytoglobin, a novel member of the globin family, protects kidney fibroblasts against oxidative stress under ischemic conditions. Am J Pathol 178, 128–139. [DOI] [PMC free article] [PubMed] [Google Scholar]
- 7. Nakatani K, Okuyama H, Shimahara Y, Saeki S, Kim DH, Nakajima Y, Seki S, Kawada N and Yoshizato K (2004) Cytoglobin/STAP, its unique localization in splanchnic fibroblast‐like cells and function in organ fibrogenesis. Lab Invest 84, 91–101. [DOI] [PubMed] [Google Scholar]
- 8. Fordel E, Thijs L, Martinet W, Lenjou M, Laufs T, Van Bockstaele D, Moens L and Dewilde S (2006) Neuroglobin and cytoglobin overexpression protects human SH‐SY5Y neuroblastoma cells against oxidative stress‐induced cell death. Neurosci Lett 410, 146–151. [DOI] [PubMed] [Google Scholar]
- 9. Mammen PP, Shelton JM, Ye Q, Kanatous SB, McGrath AJ, Richardson JA and Garry DJ (2006) Cytoglobin is a stress‐responsive hemoprotein expressed in the developing and adult brain. J Histochem Cytochem 54, 1349–1361. [DOI] [PMC free article] [PubMed] [Google Scholar]
- 10. Geuens E, Brouns I, Flamez D, Dewilde S, Timmermans JP and Moens L (2003) A globin in the nucleus!. J Biol Chem 278, 30417–30420. [DOI] [PubMed] [Google Scholar]
- 11. Shigematsu A, Adachi Y, Matsubara J, Mukaide H, Koike‐Kiriyama N, Minamino K, Shi M, Yanai S, Imamura M, Taketani S et al (2008) Analyses of expression of cytoglobin by immunohistochemical studies in human tissues. Hemoglobin 32, 287–296. [DOI] [PubMed] [Google Scholar]
- 12. Halligan KE, Jourd'heuil FL and Jourd'heuil D (2009) Cytoglobin is expressed in the vasculature and regulates cell respiration and proliferation via nitric oxide dioxygenation. J Biol Chem 284, 8539–8547. [DOI] [PMC free article] [PubMed] [Google Scholar]
- 13. Oleksiewicz U, Liloglou T, Field JK and Xinarianos G (2011) Cytoglobin: biochemical, functional and clinical perspective of the newest member of the globin family. Cell Mol Life Sci 68, 3869–3883. [DOI] [PMC free article] [PubMed] [Google Scholar]
- 14. Reeder BJ, Svistunenko DA and Wilson MT (2011) Lipid binding to cytoglobin leads to a change in haem co‐ordination: a role for cytoglobin in lipid signalling of oxidative stress. Biochem J 434, 483–492. [DOI] [PubMed] [Google Scholar]
- 15. Xu R, Harrison PM, Chen M, Li L, Tsui TY, Fung PC, Cheung PT, Wang G, Li H, Diao Y et al (2006) Cytoglobin overexpression protects against damage‐induced fibrosis. Mol Ther 13, 1093–1100. [DOI] [PubMed] [Google Scholar]
- 16. Hodges NJ, Innocent N, Dhanda S and Graham M (2008) Cellular protection from oxidative DNA damage by over‐expression of the novel globin cytoglobin in vitro . Mutagenesis 23, 293–298. [DOI] [PubMed] [Google Scholar]
- 17. Thuy le TT, Van Thuy TT, Matsumoto Y, Hai H, Ikura Y, Yoshizato K and Kawada N (2016) Absence of cytoglobin promotes multiple organ abnormalities in aged mice. Sci Rep 6, 24990. [DOI] [PMC free article] [PubMed] [Google Scholar]
- 18. Li H, Hemann C, Abdelghany TM, El‐Mahdy MA and Zweier JL (2012) Characterization of the mechanism and magnitude of cytoglobin‐mediated nitrite reduction and nitric oxide generation under anaerobic conditions. J Biol Chem 287, 36623–36633. [DOI] [PMC free article] [PubMed] [Google Scholar]
- 19. Liu X, Tong J, Zweier JR, Follmer D, Hemann C, Ismail RS and Zweier JL (2013) Differences in oxygen‐dependent nitric oxide metabolism by cytoglobin and myoglobin account for their differing functional roles. FEBS J 280, 3621–3631. [DOI] [PMC free article] [PubMed] [Google Scholar]
- 20. Lechauve C, Chauvierre C, Dewilde S, Moens L, Green BN, Marden MC, Celier C and Kiger L (2010) Cytoglobin conformations and disulfide bond formation. FEBS J 277, 2696–2704. [DOI] [PubMed] [Google Scholar]
- 21. Beckerson P, Reeder BJ and Wilson MT (2015) Coupling of disulfide bond and distal histidine dissociation in human ferrous cytoglobin regulates ligand binding. FEBS Lett 589, 507–512. [DOI] [PubMed] [Google Scholar]
- 22. Tsujino H, Yamashita T, Nose A, Kukino K, Sawai H, Shiro Y and Uno T (2014) Disulfide bonds regulate binding of exogenous ligand to human cytoglobin. J Inorg Biochem 135, 20–27. [DOI] [PubMed] [Google Scholar]
- 23. Smagghe BJ, Trent JT 3rd and Hargrove MS (2008) NO dioxygenase activity in hemoglobins is ubiquitous in vitro, but limited by reduction in vivo . PLoS ONE 3, e2039. [DOI] [PMC free article] [PubMed] [Google Scholar]
- 24. Beckerson P, Svistunenko D and Reeder B (2015) Effect of the distal histidine on the peroxidatic activity of monomeric cytoglobin. F1000Res 4, 87. [DOI] [PMC free article] [PubMed] [Google Scholar]
- 25. Beckerson P, Wilson MT, Svistunenko DA and Reeder BJ (2015) Cytoglobin ligand binding regulated by changing haem‐co‐ordination in response to intramolecular disulfide bond formation and lipid interaction. Biochem J 465, 127–137. [DOI] [PubMed] [Google Scholar]
- 26. Chen W, Druhan LJ, Chen CA, Hemann C, Chen YR, Berka V, Tsai AL and Zweier JL (2010) Peroxynitrite induces destruction of the tetrahydrobiopterin and heme in endothelial nitric oxide synthase: transition from reversible to irreversible enzyme inhibition. Biochemistry 49, 3129–3137. [DOI] [PMC free article] [PubMed] [Google Scholar]
- 27. Riener CK, Kada G and Gruber HJ (2002) Quick measurement of protein sulfhydryls with Ellman's reagent and with 4,4’‐dithiodipyridine. Anal Bioanal Chem 373, 266–276. [DOI] [PubMed] [Google Scholar]
- 28. Thomas DD, Liu X, Kantrow SP and Lancaster JR Jr (2001) The biological lifetime of nitric oxide: implications for the perivascular dynamics of NO and O2. Proc Natl Acad Sci USA 98, 355–360. [DOI] [PMC free article] [PubMed] [Google Scholar]
- 29. Liu X and Zweier JL (2013) Application of electrode methods in studies of nitric oxide metabolism and diffusion kinetics. J Electroanal Chem (Lausanne Switz) 688, 32–39. [DOI] [PMC free article] [PubMed] [Google Scholar]
- 30. Tong J, Zweier JR, Huskey RL, Ismail RS, Hemann C, Zweier JL and Liu X (2014) Effect of temperature, pH and heme ligands on the reduction of Cygb(Fe(3+)) by ascorbate. Arch Biochem Biophys 554, 1–5. [DOI] [PMC free article] [PubMed] [Google Scholar]
- 31. Hamdane D, Kiger L, Dewilde S, Green BN, Pesce A, Uzan J, Burmester T, Hankeln T, Bolognesi M, Moens L et al (2003) The redox state of the cell regulates the ligand binding affinity of human neuroglobin and cytoglobin. J Biol Chem 278, 51713–51721. [DOI] [PubMed] [Google Scholar]
- 32. Fago A, Hundahl C, Dewilde S, Gilany K, Moens L and Weber RE (2004) Allosteric regulation and temperature dependence of oxygen binding in human neuroglobin and cytoglobin. Molecular mechanisms and physiological significance. J Biol Chem 279, 44417–44426. [DOI] [PubMed] [Google Scholar]
- 33. Liu X (2015) Life equations for the senescence process. Biochem Biophys Rep 4, 228–233. [DOI] [PMC free article] [PubMed] [Google Scholar]
- 34. Liu X, Miller MJ, Joshi MS, Sadowska‐Krowicka H, Clark DA and Lancaster JR Jr (1998) Diffusion‐limited reaction of free nitric oxide with erythrocytes. J Biol Chem 273, 18709–18713. [DOI] [PubMed] [Google Scholar]
- 35. Liu X, Srinivasan P, Collard E, Grajdeanu P, Lok K, Boyle SE, Friedman A and Zweier JL (2010) Oxygen regulates the effective diffusion distance of nitric oxide in the aortic wall. Free Radic Biol Med 48, 554–559. [DOI] [PMC free article] [PubMed] [Google Scholar]
Associated Data
This section collects any data citations, data availability statements, or supplementary materials included in this article.
Supplementary Materials
Data S1. Equations for determining rate constants of Cygb reduction.