Abstract
This report shows that the direction of polarization of attached mammalian cells determines the direction in which they move. Surfaces micropatterned with appropriately functionalized self-assembled monolayers constrain individual cells to asymmetric geometries (for example, a teardrop); these geometries polarize the morphology of the cell. After electrochemical desorption of the self-assembled monolayers removes these constraints and allows the cells to move across the surface, they move toward their blunt ends.
Keywords: motility, polarity, self-assembled monolayers
This report demonstrates that imposed polarity of an adherent mammalian cell, that is, its morphology as characterized by a wide front (typically the blunt end) and a narrow rear (typically the sharp end), determines its direction of motility (1, 2). We patterned self-assembled monolayers (SAMs) on gold to confine single cells initially to polarized shapes (3, 4). A brief pulse of voltage applied to the gold released the cells from their constraints and allowed them to move freely across the surface (4). The initial direction of motility of cells correlated with the polarity of their original shape; we conclude that polarization of the shape of cells is sufficient to determine their directions of motion.
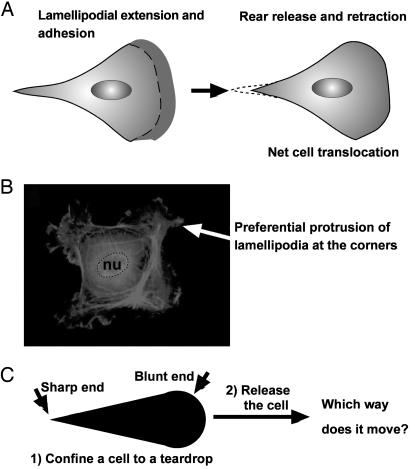
The migration of mammalian cells typically includes the following processes: (i) morphological polarization (characterized by a wide front and a narrow rear); (ii) extension of membranes toward the direction of motility; (iii) formation of attachments between these leading membranes and the substrate; (iv) movement of the bulk of the cell body; and (v) release of attachments from the substrate at the sharp end (2). These processes together result in net translocation of the cell body (Fig. 1A). Many types of motile mammalian cells adopt a “teardrop” shape with a wide leading edge (dominated by structures termed the lamellipodia) that extends in the front and a narrow tail that releases and retracts. Most types of cells can polarize and move without stimuli (2, 5). Under the influence of a stimulus (chemical or mechanical), cells can polarize and move directionally (toward or away from the stimulus). It is not clear, however, whether morphological polarity of the cell itself can determine the direction of motility. We addressed this uncertainty by defining the polarity of adherent cells using an asymmetrically patterned substrate without a gradient of stimulant. We then released the constraint on the shape and location of the cells and assessed the direction of motility for individual cells. This approach is, to our knowledge, the first test of the hypothesis that the shape of a cell determines the direction of its motion. Other parameters that characterize the motion of cells, such as their speed and their tendency to make turns, are not affected by the initial constraints.
Fig. 1.
A problem on cell motility. (A) A cartoon illustration of the migration of a typical mammalian cell on a flat surface. This teardrop shape is found in many types of cells. (B) Cells confined to squares preferentially extend their lamellipodia from the corners. nu, nucleus. (C) If a cell is confined to a shape of teardrop, will the cell preferentially extend its lamellipodia from the sharp end or from the blunt end? If released from confinement, in which direction will it likely move?
Recently, Parker et al. (6) showed that cells, when confined to a square shape, in the absence of gradients of stimulant, preferentially extended their lamellipodia from the corners (Fig. 1B). Because the confinement is static in their work, there was no net translocation of the cell body. Further experiments with various shapes showed that lamellipodia of several types of cells were more likely to protrude from sharp corners than from corners with larger angles (7).
The natural shape (often approximately a teardrop) of a motile cell and the preferential protrusion of lamellipodia from the corners of a square, stationary cell seem contradictory. For a cell confined to a teardrop shape, the results of Parker et al. (6) suggest that a cell would extend its lamellipodia from the sharp corner and that, once released, the cell would move toward the sharp end of the drop; the natural morphology of moving cells suggests that a released cell would move toward its blunt end (Fig. 1 A) (2).
We have developed a technique that uses patterned SAMs of alkanethiols on gold to confine a cell initially to an arbitrary geometry and that subsequently releases the constraints by electrochemical desorption of the SAMs by means of a short pulse of voltage. After the pulse, the cells move freely on the surface (4). By using this technique, we show that cells forced to polarize by growing while confined to asymmetric micropatterns move toward the blunt end when they are released from their constraints.
Materials and Methods
Reagents. All reagents were purchased from Sigma–Aldrich unless otherwise specified. Antigolgin and phalloidin were obtained from Molecular Probes, and antipericentrin was obtained from Covance Research Products (Denver, PA). Secondary antibodies were from Amersham Pharmacia Biosciences. Mounting medium that contains DAPI was purchased from Vector Laboratories.
Fabrication of Substrates. We have described previously the fabrication of micropatterned substrates for experiments with cells (4). We used a computer-aided design program (clewin, WieWeb Software, Enschede, The Netherlands) to design the patterns and had them printed on transparencies at high resolution (≈5 μm) by a commercial vendor (CAD/Art Services, Poway, CA). Photolithography generated the master pattern (8). We prepared stamps of poly(dimethylsiloxane) that carried the desired features from the master by replica molding (3). In the micropatterning experiment, we inked a poly(dimethylsiloxane) stamp that had patterns embossed on its surface with a 2-mM ethanolic solution of HS(CH2)17CH3 and dried the stamp under a stream of nitrogen. We brought the stamp into contact with a clean gold substrate (prepared by evaporation of a 40-nm layer of gold on titanium-primed glass slides) for 2 s, then peeled it away. We immersed stamped gold substrates in 2 mM HS(CH2)11(OCH2CH2)3OH (in ethanol) for 1 h (9).
Cell Culture and Staining. NIH 3T3 fibroblasts and COS-7 cells were purchased from American Type Culture Collection. Endothelial cells were obtained from Cambrex (East Rutherford, NJ). We washed micropatterned substrates with 75% ethanol in distilled water, followed by a rinse in Dulbecco's PBS, and incubated the substrates with fibronectin (0.08 ng/ml) for 2 h at 37°C. We plated cells at a density of 10,000–20,000 per cm2. We used Dulbecco's modified essential medium supplemented with 10% heat-inactivated calf serum and penicillin/streptomycin (1%) for the 3T3 fibroblasts and COS-7 cells and custom medium (EGM-2MV) from Cambrex for endothelial cells.
Staining of cells for pericentrin, tubulin, golgin, vinculin, actin, and nuclei followed established protocols (10). Briefly, cells of interest were fixed with 4% paraformaldehyde for 15 min, permeabilized with 0.3% Triton X-100 for 3 min, and incubated with the appropriate primary antibodies diluted (using dilutions suggested by the manufacturers) in 5% BSA in PBS (wash buffer) for 2 h (10). The substrates that bore cells were rinsed extensively with wash buffer and incubated with the appropriate secondary antibodies (conjugated with either Texas red or fluorescein) or appropriate phalloidin (for staining filamentous actin) for 2 h. The samples were rinsed and mounted with mounting medium containing DAPI to visualize the nuclei.
Electrochemical Desorption of SAMs. We have described previously the procedure used to release the cells from patterned constraints (4). We used a pulse of voltage (–1.5 V, supplied by a constant dc power source; BK Precision, Yorba Linda, CA) applied between the gold substrate (cathode) and a steel electrode (anode) in the medium for 30 s to desorb the SAMs. Previous work has demonstrated that this procedure does not affect the survival or motility of cells (4).
Nocodazole was dissolved initially in DMSO to yield a concentrated solution (10 mM). This solution was diluted to 5 μM in medium for experiments (4). We treated patterned cells with nocodazole for 1 h before the application of the pulse of voltage and immediately removed the nocodazole from the medium by washing the cultured cells with regular medium three times. We then allowed cells to migrate freely in regular medium.
Microscopy and Imaging. We acquired time-lapse images on a Leica inverted microscope equipped with an on-stage incubation chamber that maintained the temperature at 37°C and the CO2 concentration at 5% at all times. To prevent evaporation of water, we covered the culture medium with a thin layer of mineral oil. Phase-contrast images were acquired by using a Hamamatsu video camera (Middlesex, NJ) and metamorph software (Universal Imaging, Downingtown, PA). Fluorescent images were acquired through a charge-coupled device from Hamamatsu (ORCA-ER). Quantification of cell shapes and determination of the location of the centroid were performed on an image analysis routine in metamorph or by using nih image software (http://rsb.info.nih.gov/nih-image). The centroids were connected to generate the trace for the grouping of directions and calculation of v and k values that characterize cell motility. All cells counted were separated by at least 300 μm from all other cells at all times. We counted 23–45 cells for each type of pattern.
Results and Discussion
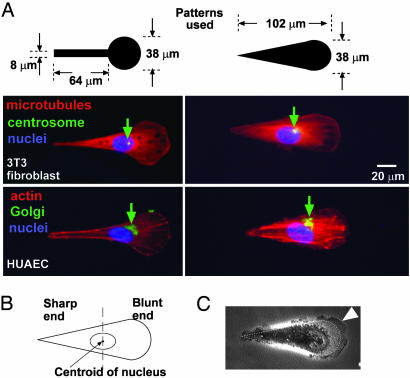
We used two different patterns to confine human umbilical artery endothelial cells and 3T3 fibroblasts to the teardrop shape (Fig. 2). Subcellular localization of the Golgi and centrosomes indicates the polarity of cells: these organelles typically localize in front of the nuclei in migrating fibroblasts and endothelial cells (11, 12). When we divided the cell into two halves, one half closer to the blunt end and the other closer to the sharp end, the Golgi and the centrosomes of the majority (>80%) of cells localized in the half with the blunt end (Fig. 2B). Cells immobilized on asymmetric patterns also appeared to extend their lamellipodia preferentially out from the blunt end (Fig. 2C). Asymmetric patterns, therefore, force cells to polarize.
Fig. 2.
Asymmetric patterns polarize immobilized cells. (A) The Golgi and the centrosome are located closer to the half of a cell with the blunt end. We used phallodin, antigolgin, DAPI, antitubulin, and antipericentrin to identify actin (red), the Golgi (green), the nucleus (blue), microtubules (red), and the centrosome (green), respectively. The green arrows indicate the location of centrosomes in 3T3 cells and Golgi in human umbilical artery endothelial cells (HUAEC). (B) We divided the cell into a half with the sharp end and a half with the blunt end by a vertical line drawn at the centroid of the nucleus; >80% (n = 30) of the centrosomes and Golgi were localized in the region of the wide end. (C) The lamellipodia of immobilized 3T3 cells tended to extend more from the blunt end as well (arrowhead). The dotted line indicates the edges of the adhesive pattern.
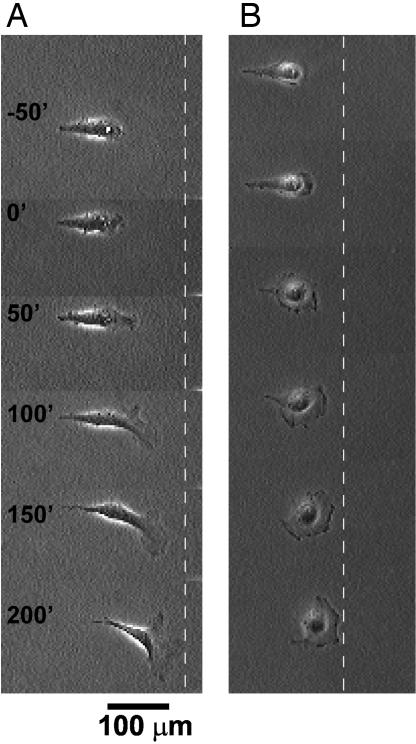
After we applied a brief pulse of voltage to the substrates that bore patterned 3T3 fibroblast cells, the cells migrated toward the blunt end of the teardrop patterns. Fig. 3A shows a representative time-lapse sequence of a cell initially confined to a teardrop, as it moved toward the blunt end after release from the constraint. Another type of transformed cell, COS-7, showed similar behaviors (Fig. 3B).
Fig. 3.
Time-lapse images (in minutes) show the motility of an initially polarized 3T3 fibroblast after its constraint is released. (A) We applied the voltage pulse at time t = 0. The dotted line serves as a reference for the location of the cell. (B) Another type of cell, COS-7, shows similar behavior.
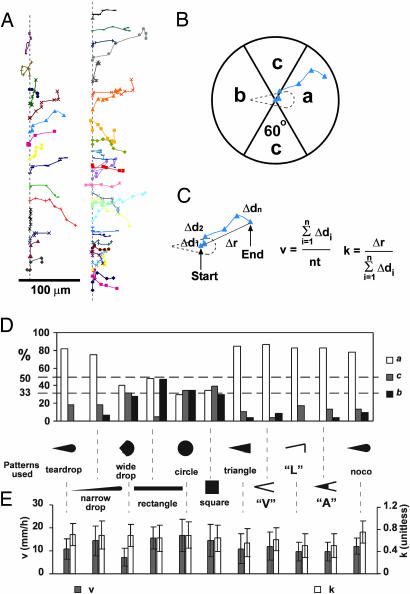
To quantify the direction of migration of individual fibroblasts, we plotted their centroids at intervals of 50 min (Fig. 4). We classified each trace into one of the following three categories by a circle divided into three regions of equal area (the circle was centered on the centroid of the cell at the time of release): (i) traces that lay in region a moved toward the blunt end; (ii) traces that lay in region b moved toward the sharp end; and (iii) traces that lay in region c moved to the sides (Fig. 4B). Fig. 4D summarizes the statistical analysis of the directions of cell motility on all of the patterns we used in this work. If the directions of motility were random, 33% of the cells would move into each region. A percentage other than 33% implies a bias toward a certain region.
Fig. 4.
Quantification of the motion of 3T3 cells after release. (A) The traces connect the positions of the centroids of cells at 50-min intervals to show their trajectories. The traces are offset vertically along the dotted line for clarity. Each trace (and color) follows a separate cell. (B) Assigning a direction to an observed trajectory. (C) Definition of v and k. Δdn is the distance of cell movement in a given step, n is the number of steps measured, and t is the time interval between each step. (D) Statistical summaries of the direction of motion of the motile cells on various patterns used in this study. A random distribution among the three regions corresponds to 33%. For the last sample (indicated by “noco”), we initially confined cells to a teardrop shape, then treated them with nocodazole to disrupt their microtubules. We then released them electrochemically and immediately replaced the medium to allow them to reassemble their microtubules. See text for more details. We counted at least 23 cells for each pattern. (Error bars indicate one SD from the mean.) (E) A summary of v and k for cells on each pattern.
Cells initially confined to the teardrop patterns (with an area of ≈2,000 μm2; we observed a total of 45 cells) moved predominantly (82%) toward the blunt end (i.e., into region a); ≈18% moved into region c; none moved into region b. To test whether the aspect ratio of the teardrop influenced the behaviors of cells, we used teardrops that were narrower or wider than the original pattern but that had the same area (≈2,000 μm2). Narrow drops still directed the movement of cells (Fig. 4D; see also Fig. 5, which is published as supporting information on the PNAS web site); wide drops did not (Fig. 4D; see also Fig. 6, which is published as supporting information on the PNAS web site; cells confined as wide drops quickly lost their polarity once released from the pattern). When we released cells from rectangular patterns, most cells migrated into regions a or b without bias for either one, whereas few cells migrated into region c (Fig. 4D; see also Fig. 7, which is published as supporting information on the PNAS web site). By contrast, cells initially patterned in circles and squares moved out of the patterns in random directions (Fig. 4D; see also Figs. 8 and 9, which are published as supporting information on the PNAS web site). Other types of asymmetric patterns also directed cell motility. Triangular patterns with the same area and aspect ratio as the teardrop directed cell motility to the same extent as the teardrop (Fig. 4D; see also Fig. 10, which is published as supporting information on the PNAS web site). We conclude that asymmetry in the pattern alone is sufficient to bias the direction of cell motility.
We also asked whether the asymmetric shape of the cell or the asymmetric distribution of cell–substrate adhesion is the more important factor in determining the direction of cell movement (refs. 13 and 14 and M. Théry, V. Racine, A. Pépin, M. Piel, Y. Chen, J. Sibarita, and M. Bornens, unpublished data). The triangular pattern provides not only an asymmetric shape for the cell but also asymmetric patterns of cell–substrate adhesion; for example, the blunt end would allow for much more cell–substrate adhesion than the sharp end, because the area of the front is larger than that at the rear (Fig. 11, which is published as supporting information on the PNAS web site). We showed in earlier work that focal adhesions of a cell do not form in the nonadhesive areas between discontinuous micropatterns that promote adhesion, despite the fact that the cell body spans the nonadhesive regions (13). We therefore used patterns that confined cells to the same overall shape as the asymmetric triangular pattern but generated different distributions of cell–substrate adhesions initially as follows: (i) a V-shaped pattern that allowed approximately equivalent cell–substrate adhesion at the blunt and sharp ends; (ii) an L-shaped pattern that allowed more adhesion at the blunt end than the sharp end; and (iii) an A-shaped pattern that allowed more cell–substrate adhesion at the sharp end than the blunt end (Fig. 11). After releasing cells from these patterns, the V-, L- and A-shaped patterns biased the direction of cell motility to the same extent as did the triangle (Fig. 4D; see also Figs. 12–14, which are published as supporting information on the PNAS web site). In support of the motion of cells, new focal adhesions formed (within 1 h) in areas inert to cell adhesion before electrochemical release (Fig. 11). These experiments demonstrate that asymmetry in the shape of the cell, rather than asymmetry in the initial distribution of focal adhesions, determines the direction of cell motility.
An intact, polarized network of microtubules is necessary for the polarity and directed motility of most types of cells; but it is not known whether the asymmetric shape of a cell alone can give rise to organized microtubules required for cell motion (15–17). We therefore disassembled the microtubules in cells that had asymmetric shapes by treating them with 5 μM nocodazole. We subsequently allowed the cells to move as the microtubules reassembled (by electrochemically releasing the cells, then immediately rinsing them with regular medium to remove the nocodazole) (15). We used the direction of cell motion after recovery from treatment with nocodazole to indicate whether the shape of cells determines the formation of polarized networks of microtubules. The direction of cell motility after recovery from treatment with nocodazole was indistinguishable from that of untreated control samples (Fig. 4D; see also Fig. 15, which is published as supporting information on the PNAS web site). This experiment shows that a polarized network of microtubules can quickly form as a result of the asymmetric shape of adherent cells, to support the polarity and direct movement of cells.
We also characterized the speed and extent of random turning in cells that migrated out from patterns (Fig. 4 C and E). We measured the total distance that the cell traveled along its path, ΣΔd, and calculated the average speed of cells; v = ΣΔd/nt (t is the time interval comprising each step, and n is the number of steps). We also found the displacement (the distance between the initial and final positions), Δr, and divided it by ΣΔd and used the ratio k = Δr/ΣΔd to measure how often the cell tended to turn. Cells that frequently make turns will yield a k value close to 0, whereas cells that persistently move along one direction will yield a k value close to 1. In addition to the direction of cell motility, v and k are important parameters that define cell motility (18). For all shapes, v and k are constant within experimental errors.
Confining mammalian cells to asymmetric shapes biases their direction of movement. Our study does not conflict with the studies by Parker et al. (6). Preferential extension of lamellipodia from sharp corners of symmetric geometries appears to be controlled by local processes that sense the local, underlying shapes (perhaps, for example, through the local architecture of the stress fibers) (19). The results reported here imply that the global morphological polarity of the cell determines the direction of cell movement.
Currently the most widely used method to study polarized, moving cells is to scratch a wound in a confluent monolayer of cells and to observe the cells at the margin of the wound as they spontaneously polarize and migrate toward the wound (11, 18, 20). This method does not allow researchers to study single, isolated cells, because each cell contacts others. Our method provides an opportunity to study individual polarized cells without the complication of cell–cell contact.
Supplementary Material
Acknowledgments
We thank Michel Bornens (Institut Curie, Paris) for helpful discussions. We thank Prof. David Weitz for the use of his cell-culture facility and facilities supported by Materials Research Science and Engineering Centers Grant DMR-0213805. This work was supported by National Institutes of Health Grant GM 065364.
Author contributions: X.J. designed research; X.J., D.A.B., A.P.W., and M.P. performed research; X.J. and M.P. contributed new reagents/analytic tools; X.J., D.A.B., and M.P. analyzed data; and X.J., D.A.B., and A.P.W. wrote the paper.
Abbreviation: SAM, self-assembled monolayer.
References
- 1.Alberts, B., Johnson, A., Lewis, J., Raff, M., Keith, R. & Walter, P. (2002) Molecular Biology of the Cell (Garland, New York).
- 2.Lauffenburger, D. A. & Horwitz, A. F. (1996) Cell 84, 359–369. [DOI] [PubMed] [Google Scholar]
- 3.Whitesides, G. M., Ostuni, E., Takayama, S., Jiang, X. & Ingber, D. E. (2001) Ann. Rev. Biomed. Eng. 3, 335–373. [DOI] [PubMed] [Google Scholar]
- 4.Jiang, X., Ferrigno, R., Mrksich, M. & Whitesides, G. M. (2003) J. Am. Chem. Soc. 125, 2366–2367. [DOI] [PubMed] [Google Scholar]
- 5.Verkhovsky, A. B., Svitkina, T. M. & Borisy, G. G. (1999) Curr. Biol. 9, 11–20. [DOI] [PubMed] [Google Scholar]
- 6.Parker, K. K., Brock, A. L., Brangwynne, C., Mannix, R. J., Wang, N., Ostuni, E., Geisse, N. A., Adams, J. C., Whitesides, G. M. & Ingber, D. E. (2002) FASEB J. 16, 1195–1204. [DOI] [PubMed] [Google Scholar]
- 7.Brock, A., Chang, E., Ho, C.-C., LeDuc, P., Jiang, X., Whitesides, G. M. & Ingber, D. E. (2003) Langmuir 19, 1611–1617. [DOI] [PubMed] [Google Scholar]
- 8.Linder, V., Wu, H., Jiang, X. & Whitesides, G. M. (2003) Anal. Chem. 75, 2522–2527. [DOI] [PubMed] [Google Scholar]
- 9.Mrksich, M., Dike, L. E., Tien, J., Ingber, D. E. & Whitesides, G. M. (1997) Exp. Cell Res. 235, 305–313. [DOI] [PubMed] [Google Scholar]
- 10.Jiang, X., Takayama, S., Qian, X., Ostuni, E., Wu, H., Bowden, N., LeDuc, P., Ingber, D. E. & Whitesides, G. M. (2002) Langmuir 18, 3273–3280. [Google Scholar]
- 11.Nobes, C. D. & Hall, A. (1999) J. Cell Biol. 144, 1235–1244. [DOI] [PMC free article] [PubMed] [Google Scholar]
- 12.Tzima, E., Kiosses, W. B., del Pozo, M. A. & Schwartz, M. A. (2003) J. Biol. Chem. 278, 31020–31023. [DOI] [PubMed] [Google Scholar]
- 13.Chen, C. S., Mrksich, M., Huang, S., Whitesides, G. M. & Ingber, D. E. (1997) Science 276, 1425–1428. [DOI] [PubMed] [Google Scholar]
- 14.Bornens, M., Théry, M. & Piel, M. (2003) European Patent Appl. 03292259, 2003.
- 15.Small, J. V., Geiger, B., Kaverina, I. & Bershadsky, A. (2002) Nat. Rev. Mol. Cell Biol. 3, 957–964. [DOI] [PubMed] [Google Scholar]
- 16.Palazzo, A. F., Joseph, H. L., Chen, Y. J., Dujardin, D. L., Alberts, A. S., Pfister, K. K., Vallee, R. B. & Gundersen, G. G. (2001) Curr. Biol. 11, 1536–1541. [DOI] [PubMed] [Google Scholar]
- 17.Waterman-Storer, C. M. & Salmon, E. D. (1999) Curr. Opin. Cell Biol. 11, 61–67. [DOI] [PubMed] [Google Scholar]
- 18.Kodama, A., Karakesisoglou, I., Wong, E., Vaezi, A. & Fuchs, E. (2003) Cell 115, 343–354. [DOI] [PubMed] [Google Scholar]
- 19.Huang, S. & Ingber, D. E. (1999) Nat. Cell Biol. 1, E131–E138. [DOI] [PubMed] [Google Scholar]
- 20.Etienne-Manneville, S. & Hall, A. (2001) Cell 106, 489–498. [DOI] [PubMed] [Google Scholar]
Associated Data
This section collects any data citations, data availability statements, or supplementary materials included in this article.


