Abstract
CD4+ T cells lacking the mTORC1 activator Rheb fail to secrete IFNγ under Th1 polarizing conditions. We hypothesized that this phenotype is due to defects in regulation of the canonical Th1 transcription factor T-bet at the level of protein phosphorylation downstream of mTORC1. To test this hypothesis, we employed targeted mass-spectrometry proteomic analysis – multiple reaction monitoring mass spectrometry (MRM-MS). We used MRM-MS to detect and quantify predicted phospho-peptides derived from T-bet. By analyzing activated murine WT and Rheb deficient CD4+ T cells, as well as murine CD4+ T cells activated in the presence of rapamycin, a pharmacologic inhibitor of mTORC1, we were able to identify 6 T-bet phosphorylation sites. Five of these are novel, and 4 sites are consistently dephosphorylated in both Rheb deficient CD4+ T-cells and T-cells treated with rapamycin, suggesting mTORC1 signaling controls their phosphorylation. Alanine mutagenesis of each of the 6 phosphorylation sites was tested for the ability to impair IFNγ expression. Single phosphorylation site mutants still support induction of IFNγ expression, however simultaneous mutation of 3 of the mTORC1-dependent sites results in significantly reduced IFNγ expression. The reduced activity of the triple mutant T-bet is associated with its failure to recruit chromatin remodeling complexes to the Ifng gene promoter. These results establish a novel mechanism by which mTORC1 regulates Th1 differentiation, through control of T-bet phosphorylation.
Introduction
CD4+ T helper lymphocytes modulate immune response to intracellular and extracellular pathogens, provide help to B cells, and play an important role in immune response to tumors. Upon activation, CD4+ T helper lymphocytes differentiate into effector T cells (Th1, Th2, Th17, Tfh, and T regulatory cells) with restricted patterns of cytokine expression and functional specificity (1). These subsets have unique roles during specific classes of adaptive immune responses and each is characterized by expression of critical lineage determining transcription factors such as T-bet, GATA3, RORγT, Foxp3 and Bcl-6 for Th1, Th2, Th17, Treg and Tfh respectively. Among important signals directing T helper cell differentiation are the cytokines present in the milieu during T helper cell activation. Many cytokines direct CD4+ T cell differentiation by binding to their cognate receptors and activating signaling transducer and activator of transcription (STAT) family transcription factors (2). When a naïve CD4+ T cell is activated in the presence of IL-12, IFNγ and in the absence of IL-4 it becomes a Th1 cell. During the initial phase of differentiation, TCR and IFNγ-induced STAT1 signaling pathways synergize to induce T-bet expression, a T-box family transcription factor that is critical for Th1 differentiation (3). In the later stages of differentiation, IL-12 induced STAT4 signaling sustains T-bet expression in the absence of TCR stimulation (4). While molecular mediators necessary for T helper cell differentiation are well studied, the mechanisms of how these molecular mediators are regulated remains incompletely understood.
Recent studies demonstrated that the kinase mTOR (mammalian target of rapamycin) integrates environmental cues provided by nutrients, cytokines, and costimulatory signals present in the immune microenvironment and helps to promote T helper cell differentiation (5–7). mTOR is a highly conserved serine/threonine kinase of the PI3K family which exists as a part of two complexes, mTORC1 and mTORC2. The mTORC1 complex is characterized by the scaffold protein Raptor and is activated by the small GTPase Rheb (8). Rapamycin, a macrolide antibiotic and immunosuppressive agent, inhibits mTORC1. We, and others, (6, 9, 10) have recently shown that mTORC1 and mTORC2 have differential contributions to T helper differentiation. For example, in the absence of Rheb and hence low mTORC1 activity, CD4+ T cells fail to differentiate into Th1 and Th17 subsets; however, they are capable of differentiating into Th2 cells. Furthermore, inhibiting mTORC1 with Rapamycin also causes a defect in Th1 differentiation.
The transcription factor T-bet plays a critical role in Th1 differentiation (3). One mechanism by which T-bet controls the expression of its target genes is by recruiting cellular machinery that conveys permissive and removes prohibitive epigenetic modifications, leading to gene transcription (11). Specifically, T-bet interacts with a histone demethylase complex Jmjd3 that removes repressive methylation H3K27 and histone methyltranserase complex Set7/9 that adds permissive H3K4me2 methylation. T-bet promotes transcription of the essential Th1 genes such as IFNγ, TNFα and CXCR3 and represses transcription of the Th2 and Th17 lineage determining transcription factors GATA3 and RORγt (4, 12). While our lab has previously demonstrated that mTORC1 is pivotal for Th1 differentiation (6), a link between mTORC1 signaling and T-bet activity has yet to be defined.
T-bet has been shown to undergo several types of post-translational modification including phosphorylation and ubiquitination (13, 14). T-bet phosphorylation at residues T302 and S508 are involved in suppression of IL-2 production (14, 15); Y219/Y265/Y304 triple phosphorylation by c-Abl tyrosine kinase regulates T-bet’s ability to bind to DNA of its target genes and promote gene expression (16). Y304 is crucial for T-bet’s interaction with RUNX1 transcription factor and inhibition of Th17 differentiation (17). In light of the importance of these phosphorylation events on the regulation of T-bet function, (13–17) we hypothesized that mTORC1 may also control T-bet’s activity via regulation of T-bet phosphorylation.
To test this hypothesis, we developed a targeted mass spectrometry method that allows fast, reliable and accurate phosphorylated peptide detection and quantitation. Most current proteomic methods for discovery of novel phosphorylations include an enrichment step for phosphorylated peptides and subsequent global proteomic analysis (18). Liquid Chromatography Multiple reaction monitoring mass spectrometry (LC-MRM-MS)2 can reproducibly detect low quantities of phosphorylated peptides from complex biological samples without additional enrichment due to the capability of specifically selecting only the peptide of interest among a complex matrix (19, 20). We developed an LC-MRM-MS workflow to investigate whether mTORC1 controls T-bet through phosphorylation. We discovered 5 novel T-bet phosphorylations and established that 4 of these novel phosphorylations are mTORC1 dependent. Three of the mTORC1 dependent phosphorylations influence T-bet’s ability to induce IFNγ production in EL4 and T-bet knockout (T-bet KO) CD4+ T cells. Furthermore, simultaneous mutation of 3 mTORC1 dependent phosphorylation sites impaired T-bet’s ability to recruit chromatin remodeling complexes to Ifng promoter, as shown by a reduction in the permissive H3K4Me2 epigenetic mark at the promoter following mutant T-bet overexpression.
Materials and Methods
Chemicals and Antibodies
All reagents and chemical were purchased from Sigma Aldrich unless noted otherwise. Rapigest detergent was purchased from Waters. Anti-GFP Alexa 488 antibody was purchased from Santa Cruz and mouse anti-IFNγ APC antibody was purchased from eBioscience. IFNγ ELISA kit was purchased from R&D Systems.
Mice
Rhebfl/fl were obtained from Dr. Paul Worley (The Johns Hopkins University, Baltimore) and were crossed with CD4Cre obtained from the Jackson Laboratory to obtain Rhebfl/fl CD4Cre with T-cell specific deletion of Rheb (21). Wild type C57/BL6 mice were obtained from the Jackson Laboratory and were bred and maintained at Johns Hopkins University animal facility. All animal protocols were approved by The Johns Hopkins Institutional Animal Care and Use Committee.
T-cell activation and in vitro Th1 differentiation
CD4+ T cells were purified from spleens and lymph nodes of wild type C57/BL6 and CD4cre Rhebfl/fl mice using Miltenyi CD4+ T cell negative selection purification kit. Purified CD4+ T cells (87–95% purity) were plated into 6-well plates coated with 3 μg/mL of anti-CD3 antibody at 2–5×10⁶ cells/well. T cell cultures were supplemented with 2 μg/mL of soluble anti-CD28, 50 ng/mL IFNγ, 10 ng/ml IL-12 and 1 μg/mL anti-IL-4 antibody. Some of the wild type T cell cultures were supplemented with 500 nM Rapamycin. These T cells were then cultured either 24 or 48 hours in the 6% CO2, 37°C tissue culture incubator. CD4+ T cells were harvested and the cell pellets were snap frozen in liquid nitrogen and stored at −80°C until LC-MRM-MS analysis
Sample preparation for mass spectrometry analysis
T cell samples were prepared using a previously described Rapigest mass spectrometry protocol (22) with several modifications. Frozen pellets were thawed on ice and lysed with 0.15% Rapigest (Waters) in 100 mM NH4HCO3 (pH 8.4) supplemented with phosphatase inhibitors 10 mM Na4O7P2, 50 mM NaF and 1 mM Na3VO4. Protein concentration of resulting lysates was measured by Bradford assay and proteins were digested overnight with sequencing grade modified trypsin (Promega) at 1:50 trypsin:protein ratio. Digested samples were acidified to pH of 2.5–3 by 10% trifluoroacetic acid then incubated at 37°C for 1 hour. Next the samples were snap frozen in liquid nitrogen and allowed to thaw at room temperature to promote Rapigest precipitation. Then samples were microcentrifuged at 15000 rpm for 10 minutes to pellet precipitated Rapigest. Supernatants containing tryptic peptides were removed and their pH was brought to 7.5–8 using 10% ammonium hydroxide. Peptide concentration was measured using OD280 on a Nanodrop spectrophotometer. Then peptides were desalted using Pierce C18 spin columns (Thermo Fisher Scientific) according to manufacturer’s protocol. Desalted peptides were lyophilized and stored at −20°C until LC-MRM-MS analysis.
LC-MRM-MS
A list of predicted tryptic peptides containing phosphorylation sites of interest was generated using open source Skyline (23) software (McCoss Laboratory, University of Washington). Peptides and their transitions were imported into AB Sciex Analyst software to generate MRM methods for AB Sciex 5500 triple quadrupole mass spectrometer. For every peptide 4–5 transitions (fragments) of the highest signal-to-noise ratio were chosen for quantitation study.
Ninety micrograms of peptides were loaded on to the column and analyzed on AB Sciex 5500 triple quadrupole mass spectrometer interfaced with Shimadzu UFLC (Ultra Flow Liquid Chromatographer). Peptides were separated on a Waters C18 Acquity BEH 1.7 μm, 1.0×50 mm column using the following 30 minute gradient (24) of mobile phases A and B: 5% mobile phase B for 2 minutes, then mobile phase B was increased to 60% from minute 2 to 26, followed by an increase to 98% B from minute 26 to 27, then maintained at 5% B from minute 28 to 30. Mobile phase A was 0.1% formic acid in LC-MS grade H2O. Mobile phase B was 0.1% formic acid in 90% acetonitrile. Column compartment was heated to 40°C.
Site-directed mutagenesis of T-bet
Mouse wild-type T-bet in the MigR1 retroviral vector has been previously described (25, 26). All of the mutants (shown in Fig. 5A) were made using the QuikChange Lightning site-directed mutagenesis kit (Stratagene) according to manufacturer’s protocol. Mutagenesis was verified by sequencing. Triple mutant creation and sequencing verification was conducted by GenScript.
Figure 5. Single phosphorylation site T-bet mutants are not deficient in their ability to induce IFNγ.
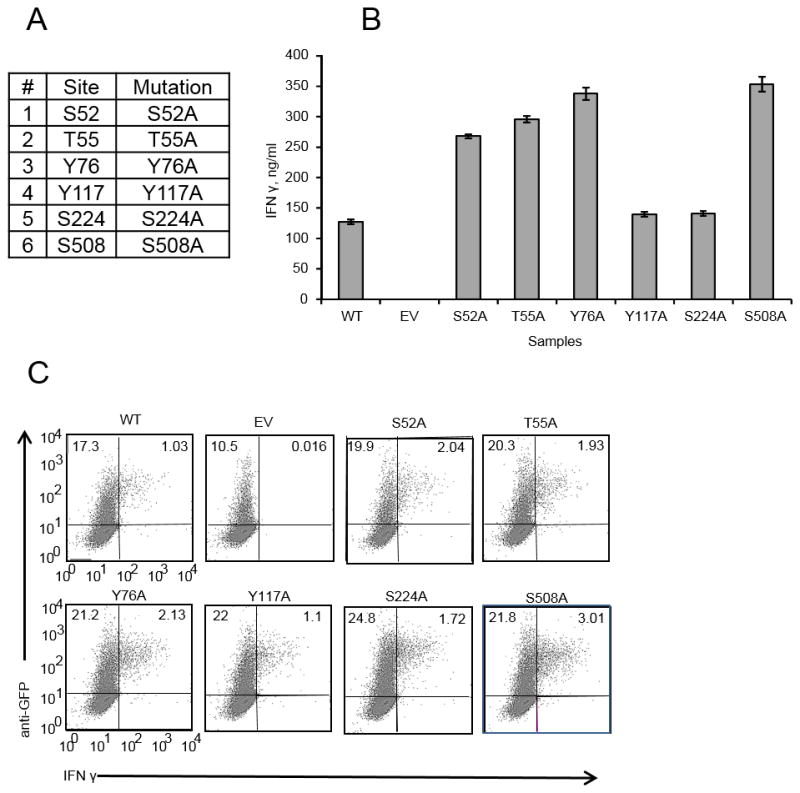
A, Six single phosphorylation site mutants. All of the phosphorylation sites were mutated to alanines. B, EL4 cells were transfected with either WT, empty vector (EV) or different mutants. 24 hours post-transfection equal numbers of GFP+ cells were plated and activated with PMA/Ionomycin overnight. Supernatants were analyzed for IFNγ by ELISA. Error bars are Standard Error of the Mean (SEM). C, EL4 cells transfected as in B and stimulated with PMA/Ionomycin overnight in the presence of GolgiPlug protein transport inhibitor. Data are from one of 3 experiments.
EL4 transfection
EL4 cells were maintained in RPMI with 10% FBS and antibiotics, subsequently noted as EL4 media. EL4 transfections were done by electroporating 5×10⁶ cells with 15 μg of mutant or wild type T-bet containing MigR1 vector. Transfection efficiency was monitored by % GFP expression using flow cytometry. For IFNγ production measurements % of GFP+ EL4 cells was measured by flow cytometry and 0.8–1×10⁵ GFP+ cells were plated per 1 well of 24-well plate in 800 uL of EL4 media. Cells were activated with PMA/Ionomycin and 24 hours later supernatants were collected and IFNγ amount was measured by ELISA. For Intracellular Cytokine Staining (ICS) transfected EL4 cells were plated in round-bottom 96-well plates and stimulated with PMA/Ionomycin in the presence of GolgiPlug (BD Biosciences) overnight. Stimulated cells were harvested and fixed using BD Fix/Perm reagent and later stained for IFNγ in BD Perm/Wash solution.
Retroviral transduction of CD4+ T cells
MigR1 plasmids encoding an empty vector, WT T-bet, or T-bet mutants were transiently transfected into the 293 Phoenix Eco (27) packaging cell line (obtained from ATCC) using Lipofectamine 2000. Supernatants were collected at 48 and 72 hours, pooled, and stored at 4°C until use. CD4+ T cells were isolated from spleens and lymph nodes of T-bet knockout (KO) mice (28). T cells were activated with 3 μg/ml of plate-bound anti-CD3, 2 μg/ml soluble anti-CD28 antibody and 1 ng/ml of IL-2 for 48 hours. Then activated T cells were harvested, resuspended in fresh T cell media, retrovirus containing supernatant and transferred into retronectin coated 24 well plates. CD4+ T cells were spinfected in 24-well plates for 2 hours at 2500 rpm then resuspended in fresh T cell media with IL-2 (1 ng/ml), IL-12 (10 ng/ml), and anti-IL-4 antibody (1 μg/ml). Transduced T cells were harvested after 48 hours and assayed for IFNγ production by ELISA and T-bet expression by flow cytometry.
Chromatin Immunoprecipitation
A total of 3.5×10⁶ cells expressing vectors containing WT, EV and triple mutant T-bet were resuspended in media at 107/ml, crosslinked with formaldehyde (1% final concentration), washed and lysed based on the manufacturer’s instruction of Magna Chip A/G chromatin IP kit (EMD Millipore Billerica, MA, USA). Nuclei were pelleted and subjected to sonication. The optimized condition to shear the chromatin was 2 cycles (5 min each) of 30 s sonication followed by 30 s of rest for a total of 10 min using Bioruptor 300 (Diagenode, Denville, NJ, USA). For ChIP, 50 ul chromatin aliquot was incubated either with 10 ug of rabbit anti-dimethyl-histone H3K4Me2 (EMD Millipore) or 2ug of normal rabbit IgG antibody (Santa Cruz Biotechnology, Santa Cruz, USA). ChIP-Grade protein A/G magnetic beads (20 ul) were added to each and were incubated on a rotator overnight at 4°C. ChIP samples were washed following the Magna ChIP protocol. Protein/DNA complexes were eluted, crosslinks reversed, and DNA was purified by Phenol/Chloroform extraction and precipitation. Quantitative PCR was performed using SYBR Green Master Mix (Applied Biosystems, Warrigton, UK). For DNA quantification, a standard curve was generated by serial dilution of purified mouse genomic DNA (Promega, Madison, WI, USA). All ChIP samples were normalized to 2% input.
Luciferase Assay
Plasmids including a pGL3 luciferase reporter controlled by the SOCS3 promoter and an expression vector encoding murine Bcl-6 were generously provided by Amy Weinmann (University of Alabama Birmingham) (29). EL4 cells were transfected by electroporation as noted above using 10 μg of MIGR1 T-bet expression vector with or without 10 μg of Bcl6 expression vector and 3 μg of pGL3 SOC3 reporter, 3 μg of pRLtk encoding Renilla luciferase (Promega, Madison, WI), and 1 μg of pMAX GFP (Lonza, Basel, Switzerland). Total plasmid DNA per transfection was normalized by MIGR1 plasmid without an expression insert. Cells were harvested 18–24 hours after transfection and cultured with PMA and ionomycin for 6 hours before measuring Firefly and Renilla luciferase activities using the Dual Glo Luciferase kit (Promega). Firefly luciferase activity was normalized to Renilla luciferase activity and is presented as fold induction compared to empty vector control.
Results
Development of a workflow for novel phosphorylation sites discovery
To discover novel T-bet phosphorylations and test our hypothesis that mTORC1 controls T-bet function through phosphorylation, we developed a hypothesis-driven targeted mass spectrometry workflow (Fig 1A). Because MRM requires apriori knowledge of peptides and phosphorylation sites within the protein of interest, we used the NetPhos phosphorylation prediction algorithm (30) to identify target peptides with predicted phosphorylation sites. We selected eight peptides containing a total of 10 potential phosphorylation sites for a preliminary MRM screen (Fig 1B). Because NetPhos cannot always accurately predict true phosphorylation sites a few phosphorylation sites with low NetPhos prediction scores were included in the preliminary screen. One of these phosphorylation sites (S508) was previously published (15) and was included to validate method development. To validate T-bet peptide identifications all 6 of the phosphorylated peptides and two of their unphosphorylated counterparts detected by MRM were validated by comparing the elution time and fragmentation pattern of peptides detected in T cell sample to elution time and fragmentation pattern of corresponding synthetic phosphorylated and unphosphorylated peptides (data not shown).
Figure 1. Proteomic workflow for discovery and validation of novel T-bet phosphorylation sites.
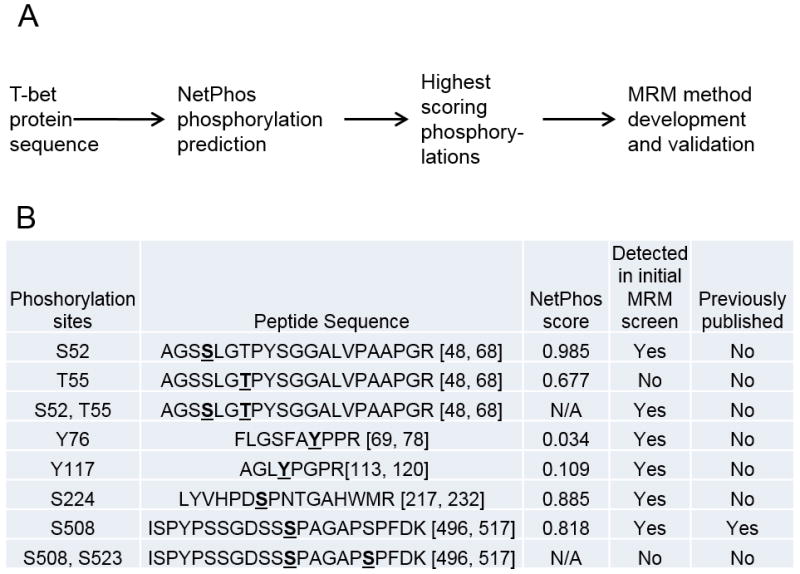
A, Mouse T-bet protein sequence was used as an input for phosphorylation site prediction analysis using NetPhos program. T-bet phosphorylations with the highest predicted scores were chosen for LC-MRM-MS method development. B, Phosphorylation sites and their NetPhos scores that were chosen for preliminary MRM method development.
Identification of five novel T-bet phosphorylation sites
Using the workflow that combined NetPhos phosphorylation prediction together with LC-MRM-MS we were able to detect 6 out of the ten phosphorylation sites examined. These 6 phosphorylation sites including S508 were consistently detected by MRM in T cells from WT C57/BL6 cultured in Th1 conditions and peptides containing these phosphorylations were chosen for further studies (Fig 2A, B). Most of these sites (S52, T55, Y76 and Y117) are located in the N-terminus of T-bet (Fig 2A, 4C). Interestingly Y76 phosphorylation has been computationally predicted as a possible site of c-Abl phosphorylation, but was not confirmed experimentally (31). We were able to confirm that Y76 phosphorylation takes place using MRM-MS. One of the phosphorylation sites S224, is located within T-box DNA binding domain and S508 is located in the C-terminal region of T-bet. Two additional phosphorylation sites, Y76 and Y117, are located in the domain of T-bet that is responsible for T-bet’s interaction with histone demethylase complex Jmjd3 that removes repressive methylation H3K27 and histone methyltranserase complex Set7/9 that adds permissive H3K4Me2 methylation (32–34). Therefore, by combining phosphorylation prediction tool and targeted mass spectrometry workflow, we were able to discover novel T-bet phosphorylation sites.
Figure 2. Six phosphorylation sites were detected and validated using MRM-MS.
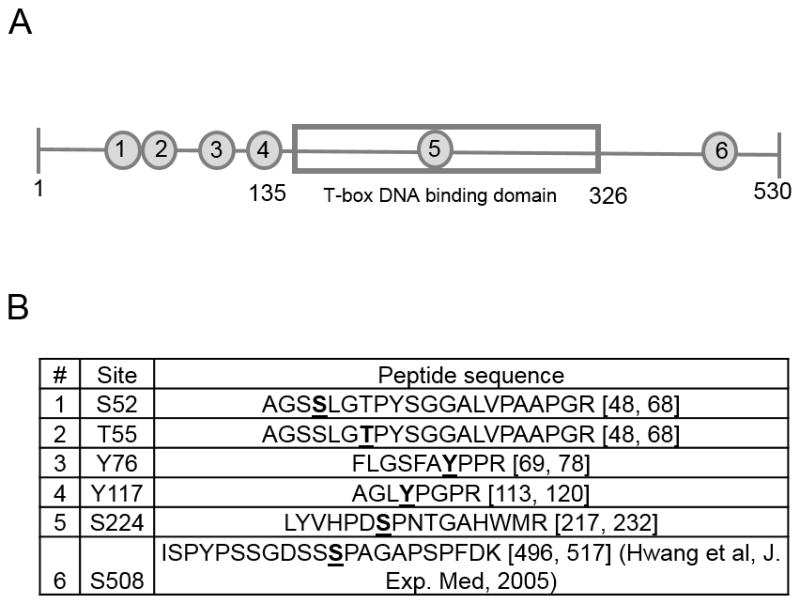
A, Schematic of T-bet protein with T-box DNA binding domain shown as a gray rectangle in the middle. The numbers in gray circles show the location of the six different phosphorylations on the T-bet sequence. B, List of the six phosphorylations detected using MRM-MS and their corresponding tryptic peptides.
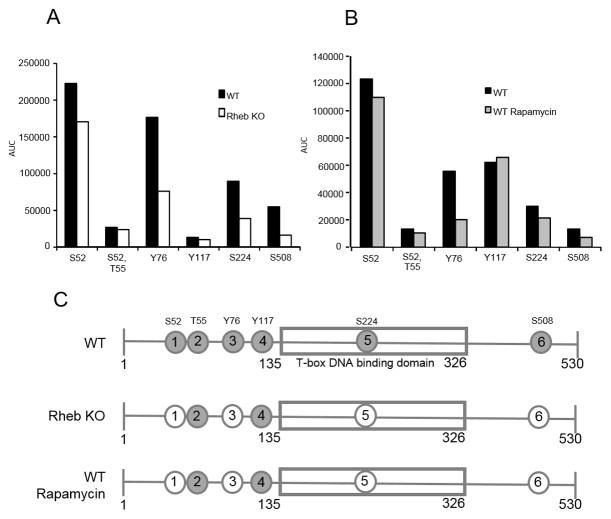
Figure 4. Three of the novel T-bet phosphorylations are mTORC1 dependent.
A, Wild-type C57/BL6 (WT) or Rhebfl/fl CD4+Cre (Rheb KO) CD4+ T cells were purified from spleens and lymph nodes of 6–12 week old mice and activated with plate-bound anti-CD3 and soluble anti-CD28 for 24 hours in Th1 polarizing culture conditions. Activated T cells were harvested, lysed with Rapigest, trypsin digested and analyzed by LC-MRM-MS. AUC on the y axis is area under the curve – measure of phosphorylated peptide abundance. Data are from one of 2 experiments with T cells from individual mice. B, CD4+ T cells were purified from spleens and lymph nodes of WT mice and activated for 48 hours as in A in the presence or absence of 500 nM Rapamycin (WT or WT Rapamycin), prepared and analyzed as in A. Data are from one of 3 experiments with T cells from individual mice. C, Schematic of T-bet with phosphorylations shown as circles with numbers. Gray circles are the phosphorylations sites. White circles show phosphorylations that are mTORC1 dependent. Data are from one of 5 experiments with T cells from individual mice.
Four out of 5 of the novel phosphorylations are reduced in the absence of mTORC1 activity
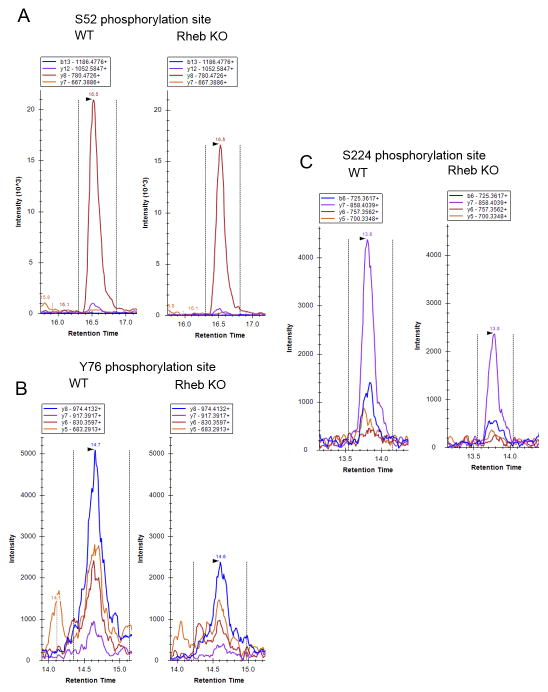
We hypothesized that mTORC1 signaling might control Th1 differentiation in part by regulating T-bet function through phosphorylation. To test this hypothesis, we conducted LC-MRM-MS analysis on Rheb deficient CD4+ T cells, as well as wild-type CD4+ T cells treated with Rapamycin. MRM-MS analysis revealed that S52, Y76, S224 and S508 (Fig 3A, B, and C) phosphorylations are consistently reduced when mTORC1 activity is abrogated (Fig 3, 4). Figure 3 shows LC-MRM-MS traces for peptides containing S52, Y76 and S224 phosphorylations. The abundance of these phosphorylations, as measured by area under the curve (AUC) for all fragments of a particular peptide, was consistently decreased (Fig 4A, B). The abundance of the corresponding unphosphorylated peptides was similar for WT, Rheb KO and WT+Rapamycin samples (data not shown).
Figure 3. LC-MRM-MS traces of T-bet peptides that contain phosphorylations regulated by mTORC1.
Different color traces represent different fragments of the same peptide. The fragments are denoted at the top of each LC-MRM-MS trace. A, S52 phosphorylation site, peptide AGSSLGTPYSGGALVPAAPGR, B, Y76 phosphorylation site, peptide FLGSFAYPPR, C, S224 phosphorylations site, peptide LYVHPDSPNTGAHWMR. Data are representative of 5 individual experiments.
Mutating single phosphorylation sites does not affect T-bet’s ability to induce IFNγ expression
Published data (13, 14, 16) suggested that within T-bet, S52, Y76 and S224 phosphorylation sites could be important for T-bet’s ability to induce IFNγ expression by influencing either its ability to bind DNA and/or interact with chromatin remodeling complexes. A distinct phosphorylation site, S508, has been previously demonstrated to be important for suppression of IL-2 production by T-bet (15).
To test the function of the 6 phosphorylation sites detected by MRM-MS, we created alanine substitution mutants for each individually (Fig 5A). The best characterized function of T-bet is induction of IFNγ expression. This can be modeled by transient overexpression of T-bet in the EL4 lymphoma cell line, which does not express T-bet or IFNγ (3). T-bet expression in EL4 cells is both necessary and sufficient to induce IFNγ, and such functional analyses in EL4 cells have correlated strongly with T-bet function in primary CD4+ T cells (29, 33–35). We transfected EL4 cells with either wild-type T-bet or T-bet mutants and measured IFNγ production by ICS and ELISA. All of the T-bet single site mutants were able to induce IFNγ expression (Fig 5B, C) as shown by ELISA and ICS. The level of IFNγ induced by mutants was either similar or higher in magnitude as compared to the level of IFNγ induced by WT T-bet. Therefore, mutating individual phosphorylation sites is not sufficient to reduce T-bet’s ability to induce IFNγ expression.
Mutating three of the mTORC1-dependent phosphorylations reduces T-bet’s ability to induce IFNγ expression in EL4 and T-bet KO CD4+ T cells
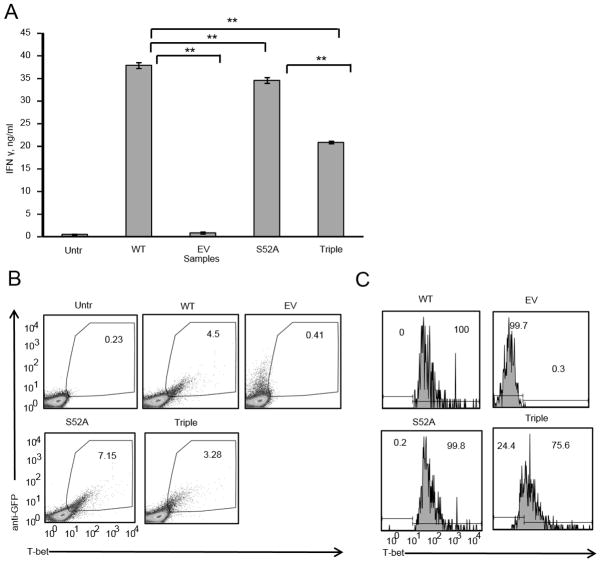
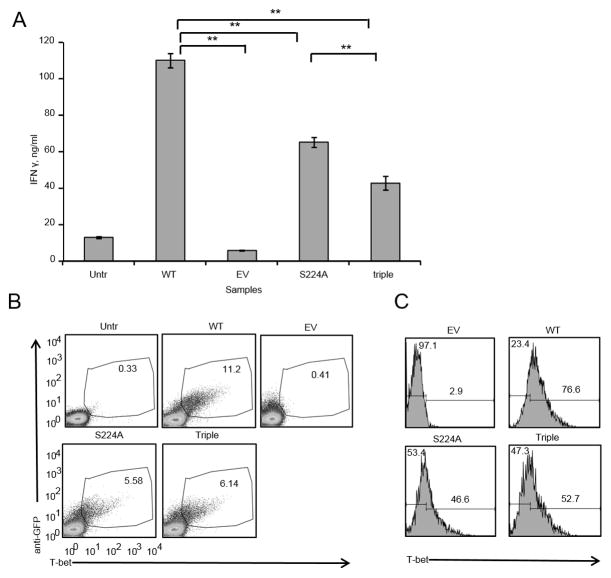
Because S52, Y76 and S224 phosphorylations are mTORC1 dependent and are in the domains of T-bet that are important for T-bet’s ability to induce its target gene expression (32–34) we hypothesized that mutating all three of these phosphorylations could impact T-bet’s ability to promote IFNγ expression. Therefore, we created a triple mutant T-bet in which each of the S52, Y76 and S224 phosphorylations were all simultaneously mutated to alanine. The resulting triple mutant was transfected into EL4 cells and its ability to induce IFNγ was compared to WT T-bet. Triple mutant T-bet has a significantly reduced ability to induce IFNγ expression as compared to WT T-bet as shown by either transient transfection via electroporation or (Fig 6A) or stable retroviral transduction (Supplemental Fig 1A) of WT or triple mutant T-bet in EL4 cells. It should be noted that transfection efficiency and T-bet protein levels by western blot and ICS were similar for WT and triple mutant T-bet over the course of multiple experiments (Fig 6B, C, supplemental figure 1). This is readily seen in the EL4 cells stably transfected with T-bet or the T-bet mutants (supplemental figure 1). Having employed the EL4 cell line to identify the functional importance of the mTORC1-dependent phosphorylation sites, we next wanted to test the mutant T-bet constructs in primary CD4+ T cells. To study the ability of the triple mutant to induce IFNγ production in primary T cells we used CD4+ T cells from T-bet KO mice. Of note, T-bet KO CD4+ T cells have similar levels of Rheb protein and mTORC1 activity when compared to WT CD4+ T cells (Supplemental Fig 2). Furthermore, T-bet KO CD4+ T cells are not globally deficient in their ability to secrete cytokines, because even though they do not secrete IFNγ they secrete TNFα at levels that are similar to WT CD4+ T cells (Supplemental Fig 3). T-bet KO CD4+ T cells were transduced with retroviruses containing, WT, triple mutant, EV and S224A single phosphorylation site mutant constructs (Fig 7). Similar to the EL4 experiments, we observed that the triple mutant has a significantly reduced ability to induce IFNγ expression in T-bet KO CD4+ T cells as compared to WT T-bet (Fig 7A).
Figure 6. Triple phosphorylation site T-bet mutant has a significantly reduced ability to induce IFNγ in EL4.
A. EL4 cells were transfected with either WT, empty vector, S52A single phosphorylation site mutant or triple phosphorylation site mutant. 24 hours post-transfection equal numbers of GFP+ cells were plated and activated with PMA/Ionomycin overnight. Supernatants were analyzed for IFNγ by ELISA. Error bars are SEM, ** P<0.05 by 1-way ANOVA with Bonferroni’s Multiple Comparison Test. B, EL4 transfected as in A were fixed, permeabilized and stained with anti-GFP and anti-T-bet antibodies. C, Samples from B gated on GFP+ cells and T-bet levels are shown as histograms. Data are representative of 4 experiments.
Figure 7. Triple phosphorylation site T-bet mutant has a significantly reduced ability to induce IFNγ in T-bet deficient primary CD4+ T cells.
A. CD4+ T cells were purified from spleens and lymph nodes of T-bet deficient (T-bet KO) mice and transduced with either WT, empty vector, S224A single phosphorylation site mutant or triple mutant construct containing retroviruses. 48 hours post-transduction equal numbers of GFP+ cells were plated and activated with 1 μg/ml of plate-bound anti-CD3, 2 μg/ml of soluble anti-CD28 overnight. Supernatants were analyzed for IFNγ by ELISA. Error bars are SEM; ** P<0.05 by 1-way ANOVA with Bonferroni’s Multiple Comparison Test. B, T-bet KO CD4+ T cells transduced with the constructs indicated in A were fixed, permeabilized and stained with anti-GFP and anti-T-bet antibodies. C, Samples from B gated on GFP+ cells and T-bet levels are shown as histograms. Data are from one of 2 experiments with T cells from 4 individual mice.
Triple mutant T-bet has an impaired ability to promote chromatin remodeling
To understand why the triple mutant T-bet has a diminished ability to promote IFNγ expression we investigated the triple mutant’s ability to promote addition of the permissive chromatin mark H3K4me2. The presence of this chromatin mark at Ifng promoter has been demonstrated to be exquisitely T-bet dependent in EL4 and primary T cells (32). Furthermore, EL4 cell have been successfully used to study chromatin remodeling induced by T-bet and these findings directly translated into chromatin remodeling induced by T-bet in primary CD4+ T cells (29, 33–35). Chromatin immunoprecipitation (ChIP) using H3K4me2 antibody demonstrated that the triple mutant T-bet has a significantly reduced ability to promote addition of the permissive histone methylation mark at Ifng promoter region (Fig 8A). Alternatively, the Ifng promoter-driven luciferase reporter assay, which is not regulated at the epigenetic level, can be used as a measure of T-bet’s ability to bind DNA at a target promoter independently of chromatin remodeling events (33). By this measure, the triple mutant T-bet’s ability to bind DNA at the Ifng promoter region was intact (Fig 8B). It has been demonstrated that T-bet interacts with the Bcl-6 transcription factor. The T-bet/Bcl-6 complex attenuates the expression of T-bet target genes instead of upregulating them (29). Bcl-6 binding to T-bet has shown to take place at the C-terminus of T-bet. One of the phosphorylations that we investigated is S508 phosphorylation site and it is located with the C-terminal region of T-bet that has been shown to interact with Bcl-6 (29, 35). We investigated whether novel T-bet phosphorylations we identified impact T-bet’s ability to interact with Bcl-6 by co-transfecting T-bet and Bcl-6 into EL4 and monitoring induction of SOCS3 transcription via SOCS3 luciferase promoter reporter assay. Neither single phosphorylation mutants nor the triple mutant impacted T-bet’s ability to interact with Bcl-6 as shown by the same degree of SOCS3 reporter inhibition for EL4 co-transfected with either WT or mutant T-bet and Bcl-6 (Fig 8C). Of note T-bet and Bcl-6 protein levels were similar between different conditions used for the SOCS3 reporter assay (Supplemental Fig. 4 A, B). Together these results demonstrate that triple mutant T-bet can bind DNA and interact with Bcl-6 but has an impaired ability to induce IFNγ expression due to reduction in its capacity to promote an appropriate permissive epigenetic environment.
Figure 8. Triple mutant T-bet has a reduced ability to promote addition of permissive chromatin remodeling mark H3K4me2 but can still bind to the Ifng and SOCS3 promoters.
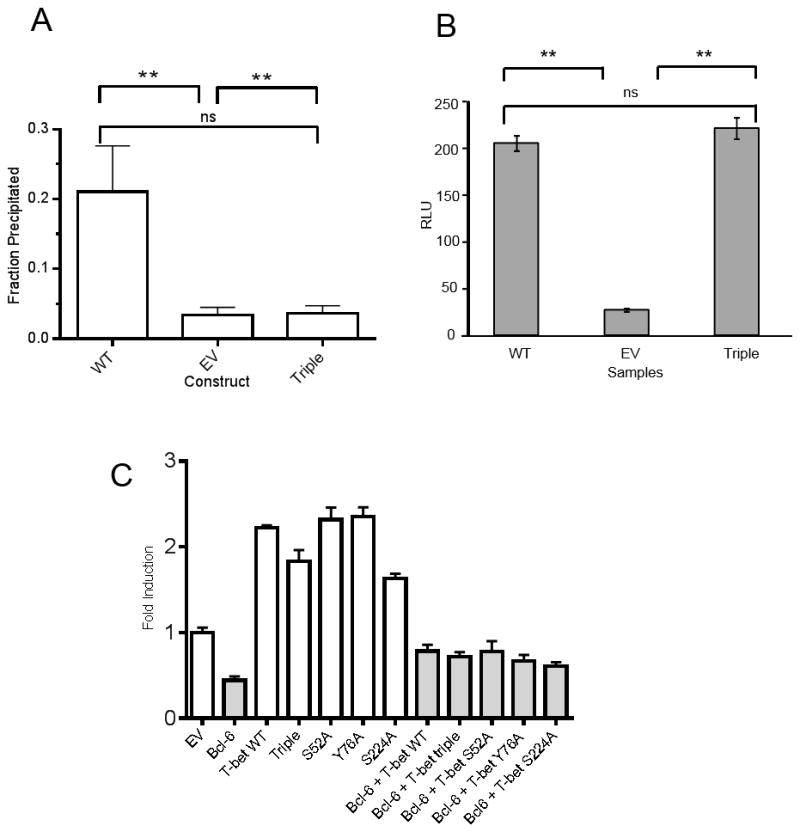
A. EL4 cells were transiently transfected with empty vector (EV), WT T-bet, or T-bet triple mutant, and chromatin was fixed after 72 hours and sonicated for ChIP. Graph depicts fraction of input DNA precipitated by anti H3K4me2 specific antibody from each sample, mean ± SD, N=3 replicates. ** P<0.05 by 1-way ANOVA with Bonferroni’s Multiple Comparison Test. Control rabbit IgG precipitated a negligible amount of input and is not shown. The experiment was performed 3 times with similar results.
B. EL4 cells were co-transfected with the pGL3 Ifng promoter reporter construct, pRLtk Renilla control, and either WT T-bet, triple mutant T-bet or empty vector (EV). After PMA/Ionomycin stimulation, firefly luciferase activity was normalized to the activity of co-transfected Renilla control. RLU – relative luminescence units. Error bars are SD; **P<0.05 by 1-way ANOVA with Bonferroni’s Multiple Comparison Test. Data are from one of 2 experiments.
C. EL4 were co-transfected with the SOCS3 luciferase promoter reporter construct and empty vector (EV) or T-bet constructs in the absence (open bars) or the presence of Bcl-6 (grey bars). After PMA/Ionomycin stimulation, firefly luciferase activity was normalized to co-transfected Renilla luciferase activity and is depicted as fold induction compared to EV. Error bars depict SD, and data are representative of 4 independent experiments.
Discussion
In the present study we have identified 5 novel T-bet phosphorylation sites and demonstrate that 4 of these phosphorylations (S52, Y76, S224 and S508) are mTORC1 dependent. By demonstrating that 3 of the mTORC1 dependent phosphorylations regulate T-bet’s ability to induce IFNγ expression, our data suggest that mTORC1 controls T-bet’s activity in part through a set of phosphorylations. Simultaneous mutations of all three phosphorylations sites into alanine significantly diminished the ability of T-bet to induce IFNγ expression in both the murine thymoma cell line EL4 and primary T-bet KO CD4+ T cells. Furthermore, we demonstrate that the reduced ability of the triple mutant to induce IFNγ expression is due in part to its diminished capacity to promote addition of the permissive chromatin mark H3K4me2 to the Ifng promoter region. While mutating each of the sites individually did not seem to affect IFNγ production in a transiently transfected cell line, this does not rule out their potential involvement in promoting IFNγ transcription. Indeed, in experiments employing stable transfection of single mutants in EL4 cells, some single mutants also resulted in decreased IFNγ when compared to transfection with WT T-bet (data not shown).
T-bet is a member of the T-box protein family of transcription factors which have been shown to play important roles in cell proliferation, embryogenesis and organ development. The T-box protein family is characterized by the presence of a highly conserved T-box region that spans approximately 200 amino acids (32). The T-box region is the DNA binding domain of T-box transcription factors through which T-box transcription factors bind to promoter elements and induce expression of target genes. Only one of the phosphorylation sites discovered in this study (S224) is located within T-bet’s T-box DNA binding domain. While S224 phosphorylation is mTORC1 dependent, T-bet’s ability to bind DNA, as measured by its similar IFNγ induction compared to WT T-bet, is not diminished in the absence of S224 phosphorylation. The selectivity of our findings is further enhanced by the observation that while the triple mutant abrogated IFNγ production, it did not affect the ability of T-bet to facilitate Bcl-6 mediated inhibition of T-bet dependent SOCS3 promoter transcription.
Previously 3 other T-bet phosphorylation sites within the T-box region (Y219/Y265/Y304) have been demonstrated to be crucial for T-bet’s ability to bind DNA proximal to its target genes (16). T-bet promotes the expression of its target genes via two mechanisms. The first mechanism is through T-bet directly binding to the consensus sequence in its target gene’s promoter or enhancer region and recruiting transcription machinery and the second is through recruiting chromatin remodeling complexes to its target gene promoter and facilitating the addition of permissive and removal of prohibitive chromatin remodeling marks (11, 32–34, 36). Studies from the Weinmann laboratory (32–34) have demonstrated that T-bet regions that are responsible for recruitment of chromatin remodeling complexes are predominantly located on the N-terminus of T-bet and overlap with T-box DNA binding domain. Therefore, we hypothesized that S224, S52 and Y76 mTORC1-dependent phosphorylations discovered in this study could be important for recruiting chromatin remodeling complexes. Our data supports this hypothesis by demonstrating that a triple mutant T-bet binds to and activates an Ifng promoter-reporter construct but has a reduced ability to promote the addition of H3K4me2 permissive chromatin mark to the endogenous Ifng promoter region within chromatin.
Y219/Y265/Y304 phosphorylations that regulate T-bet’s DNA binding and ability to promote Th1 differentiation are imparted onto T-bet by c-Abl tyrosine kinase (16). Among the novel mTORC1 dependent phosphorylation sites discovered in this study, there are both serine (S52, S224) and tyrosine phosphorylation (Y76). Therefore, these phosphorylations may be imparted onto T-bet by two distinct kinases, one with serine/threonine specificity and another with tyrosine specificity, or a dual-specificity kinase. Such findings suggest that at least some of the phosphorylation sites we identified are not direct substrates of mTORC1, despite the regulation of their phosphorylation state by mTORC1 activity. While identification of the kinases that directly phosphorylate the T-bet residues that we identified is beyond the scope of this work, preliminary immunoprecipitation studies have identified interactions between mTORC1 and several dual specificity protein kinases. The capacity of these kinases to phosphorylate T-bet on the sites we identified remains under investigation.
Interestingly, 4 out of 5 novel phosphorylation sites in mouse T-bet protein discovered in this study are present in human T-bet. Previous studies from our laboratory (37) have demonstrated that mTOR regulates human CD4+ T cell effector differentiation. Thus, we predict that mTORC1 regulates T-bet function via phosphorylation not only in mouse CD4+ T cells, but in human CD4+ T cells as well.
Supplementary Material
Acknowledgments
We thank Dr. Stefani Thomas and Dr. Elisabeth Hersman for help with designing and implementing LC-MRM-MS assays for phosphorylated peptides. We thank Jiayu Wen and Chirag Patel from Dr. Jonathan Powell’s lab for help with managing mouse strain colonies used for this study. We thank Hong Sun, Minhee Oh and Chirag Patel from the Powell lab for input on manuscript writing and on design assays for T-bet function in primary CD4+ T cells. We also thank Dr. Aki Furusawa from Dr. Arnob Banerjee’s lab for help with optimizing retroviral transduction of T-bet KO CD4+ T cells and providing us with spleens and lymph nodes of T-bet KO mice. We thank Dr. Amy Weinmann from University of Alabama, Birmingham for help with designing H3K4Me2 ChIP and for kindly giving us the Bcl-6 expression construct as well SOCS3 and IFNγ luciferase reporter constructs.
Funding NIH R01 AI077610-07 (J.P.) and NIH KO8HL093027 (A.B.)
Footnotes
LC-MRM-MS - liquid chromatography multiple reaction monitoring mass spectrometry
References
- 1.Wan YY. Multi-tasking of helper T cells. Immunology. 2010;130:166–171. doi: 10.1111/j.1365-2567.2010.03289.x. [DOI] [PMC free article] [PubMed] [Google Scholar]
- 2.Lucas S, Ghilardi N, Li J, de Sauvage FJ. IL-27 regulates IL-12 responsiveness of naive CD4++ T cells through Stat1-dependent and -independent mechanisms. Proceedings of the National Academy of Sciences of the United States of America. 2003;100:15047–15052. doi: 10.1073/pnas.2536517100. [DOI] [PMC free article] [PubMed] [Google Scholar]
- 3.Szabo SJ, Kim ST, Costa GL, Zhang X, Fathman CG, Glimcher LH. A novel transcription factor, T-bet, directs Th1 lineage commitment. Cell. 2000;100:655–669. doi: 10.1016/s0092-8674(00)80702-3. [DOI] [PubMed] [Google Scholar]
- 4.Lazarevic V, Glimcher LH. T-bet in disease. Nature immunology. 2011;12:597–606. doi: 10.1038/ni.2059. [DOI] [PMC free article] [PubMed] [Google Scholar]
- 5.Delgoffe GM, Kole TP, Zheng Y, Zarek PE, Matthews KL, Xiao B, Worley PF, Kozma SC, Powell JD. The mTOR kinase differentially regulates effector and regulatory T cell lineage commitment. Immunity. 2009;30:832–844. doi: 10.1016/j.immuni.2009.04.014. [DOI] [PMC free article] [PubMed] [Google Scholar]
- 6.Delgoffe GM, Pollizzi KN, Waickman AT, Heikamp E, Meyers DJ, Horton MR, Xiao B, Worley PF, Powell JD. The kinase mTOR regulates the differentiation of helper T cells through the selective activation of signaling by mTORC1 and mTORC2. Nat Immunol. 2011 doi: 10.1038/ni.2005. [DOI] [PMC free article] [PubMed] [Google Scholar]
- 7.Powell JD, Delgoffe GM. The mammalian target of rapamycin: linking T cell differentiation, function, and metabolism. Immunity. 2010;33:301–311. doi: 10.1016/j.immuni.2010.09.002. [DOI] [PMC free article] [PubMed] [Google Scholar]
- 8.Laplante M, Sabatini DM. mTOR Signaling. Cold Spring Harbor perspectives in biology. 2012:4. doi: 10.1101/cshperspect.a011593. [DOI] [PMC free article] [PubMed] [Google Scholar]
- 9.Yang K, Shrestha S, Zeng H, Karmaus PW, Neale G, Vogel P, Guertin DA, Lamb RF, Chi H. T cell exit from quiescence and differentiation into Th2 cells depend on Raptor-mTORC1-mediated metabolic reprogramming. Immunity. 2013;39:1043–1056. doi: 10.1016/j.immuni.2013.09.015. [DOI] [PMC free article] [PubMed] [Google Scholar]
- 10.Zeng H, Yang K, Cloer C, Neale G, Vogel P, Chi H. mTORC1 couples immune signals and metabolic programming to establish T(reg)-cell function. Nature. 2013;499:485–490. doi: 10.1038/nature12297. [DOI] [PMC free article] [PubMed] [Google Scholar]
- 11.Miller SA, Weinmann AS. Molecular mechanisms by which T-bet regulates T-helper cell commitment. Immunological reviews. 2010;238:233–246. doi: 10.1111/j.1600-065X.2010.00952.x. [DOI] [PMC free article] [PubMed] [Google Scholar]
- 12.Plevy SE, Landers CJ, Prehn J, Carramanzana NM, Deem RL, Shealy D, Targan SR. A role for TNF-alpha and mucosal T helper-1 cytokines in the pathogenesis of Crohn’s disease. Journal of immunology. 1997;159:6276–6282. [PubMed] [Google Scholar]
- 13.Oh S, Hwang ES. The role of protein modifications of T-bet in cytokine production and differentiation of T helper cells. Journal of immunology research. 2014;2014:589672. doi: 10.1155/2014/589672. [DOI] [PMC free article] [PubMed] [Google Scholar]
- 14.Jang EJ, Park HR, Hong JH, Hwang ES. Lysine 313 of T-box is crucial for modulation of protein stability, DNA binding, and threonine phosphorylation of T-bet. Journal of immunology. 2013;190:5764–5770. doi: 10.4049/jimmunol.1203403. [DOI] [PubMed] [Google Scholar]
- 15.Hwang ES, Hong JH, Glimcher LH. IL-2 production in developing Th1 cells is regulated by heterodimerization of RelA and T-bet and requires T-bet serine residue 508. The Journal of experimental medicine. 2005;202:1289–1300. doi: 10.1084/jem.20051044. [DOI] [PMC free article] [PubMed] [Google Scholar]
- 16.Chen A, Lee SM, Gao B, Shannon S, Zhu Z, Fang D. c-Abl-mediated tyrosine phosphorylation of the T-bet DNA-binding domain regulates CD4++ T-cell differentiation and allergic lung inflammation. Molecular and cellular biology. 2011;31:3445–3456. doi: 10.1128/MCB.05383-11. [DOI] [PMC free article] [PubMed] [Google Scholar]
- 17.Lazarevic V, Chen X, Shim JH, Hwang ES, Jang E, Bolm AN, Oukka M, Kuchroo VK, Glimcher LH. T-bet represses T(H)17 differentiation by preventing Runx1-mediated activation of the gene encoding RORgammat. Nature immunology. 2011;12:96–104. doi: 10.1038/ni.1969. [DOI] [PMC free article] [PubMed] [Google Scholar]
- 18.Cutillas PR. Role of phosphoproteomics in the development of personalized cancer therapies. Proteomics Clinical applications. 2015;9:383–395. doi: 10.1002/prca.201400104. [DOI] [PubMed] [Google Scholar]
- 19.Gillette MA, Carr SA. Quantitative analysis of peptides and proteins in biomedicine by targeted mass spectrometry. Nature methods. 2013;10:28–34. doi: 10.1038/nmeth.2309. [DOI] [PMC free article] [PubMed] [Google Scholar]
- 20.Picotti P, Bodenmiller B, Aebersold R. Proteomics meets the scientific method. Nature methods. 2013;10:24–27. doi: 10.1038/nmeth.2291. [DOI] [PubMed] [Google Scholar]
- 21.Yee WM, Worley PF. Rheb interacts with Raf-1 kinase and may function to integrate growth factor- and protein kinase A-dependent signals. Molecular and cellular biology. 1997;17:921–933. doi: 10.1128/mcb.17.2.921. [DOI] [PMC free article] [PubMed] [Google Scholar]
- 22.Mottaz-Brewer HM, Norbeck AD, Adkins JN, Manes NP, Ansong C, Shi L, Rikihisa Y, Kikuchi T, Wong SW, Estep RD, Heffron F, Pasa-Tolic L, Smith RD. Optimization of proteomic sample preparation procedures for comprehensive protein characterization of pathogenic systems. Journal of biomolecular techniques: JBT. 2008;19:285–295. [PMC free article] [PubMed] [Google Scholar]
- 23.MacLean B, Tomazela DM, Shulman N, Chambers M, Finney GL, Frewen B, Kern R, Tabb DL, Liebler DC, MacCoss MJ. Skyline: an open source document editor for creating and analyzing targeted proteomics experiments. Bioinformatics. 2010;26:966–968. doi: 10.1093/bioinformatics/btq054. [DOI] [PMC free article] [PubMed] [Google Scholar]
- 24.Hersman EM, Bumpus NN. A targeted proteomics approach for profiling murine cytochrome P450 expression. The Journal of pharmacology and experimental therapeutics. 2014;349:221–228. doi: 10.1124/jpet.113.212456. [DOI] [PMC free article] [PubMed] [Google Scholar]
- 25.Gray CM, May MJ. Stable reconstitution of IKK-deficient mouse embryonic fibroblasts. Methods in molecular biology. 2015;1280:181–195. doi: 10.1007/978-1-4939-2422-6_10. [DOI] [PubMed] [Google Scholar]
- 26.Furusawa A, Sadashivaiah K, Singh ZN, Civin CI, Banerjee A. Inefficient megakaryopoiesis in mouse hematopoietic stem-progenitor cells lacking T-bet. Experimental hematology. 2016;44:194–206 e117. doi: 10.1016/j.exphem.2015.11.003. [DOI] [PMC free article] [PubMed] [Google Scholar]
- 27.Pear WS, Nolan GP, Scott ML, Baltimore D. Production of high-titer helper-free retroviruses by transient transfection. Proceedings of the National Academy of Sciences of the United States of America. 1993;90:8392–8396. doi: 10.1073/pnas.90.18.8392. [DOI] [PMC free article] [PubMed] [Google Scholar]
- 28.Song C, Sadashivaiah K, Furusawa A, Davila E, Tamada K, Banerjee A. Eomesodermin is required for antitumor immunity mediated by 4-1BB-agonist immunotherapy. Oncoimmunology. 2014;3:e27680. doi: 10.4161/onci.27680. [DOI] [PMC free article] [PubMed] [Google Scholar]
- 29.Oestreich KJ, Huang AC, Weinmann AS. The lineage-defining factors T-bet and Bcl-6 collaborate to regulate Th1 gene expression patterns. The Journal of experimental medicine. 2011;208:1001–1013. doi: 10.1084/jem.20102144. [DOI] [PMC free article] [PubMed] [Google Scholar]
- 30.Blom N, Gammeltoft S, Brunak S. Sequence and structure-based prediction of eukaryotic protein phosphorylation sites. Journal of molecular biology. 1999;294:1351–1362. doi: 10.1006/jmbi.1999.3310. [DOI] [PubMed] [Google Scholar]
- 31.Hwang ES, Szabo SJ, Schwartzberg PL, Glimcher LH. T helper cell fate specified by kinase-mediated interaction of T-bet with GATA-3. Science. 2005;307:430–433. doi: 10.1126/science.1103336. [DOI] [PubMed] [Google Scholar]
- 32.Lewis MD, Miller SA, Miazgowicz MM, Beima KM, Weinmann AS. T-bet’s ability to regulate individual target genes requires the conserved T-box domain to recruit histone methyltransferase activity and a separate family member-specific transactivation domain. Molecular and cellular biology. 2007;27:8510–8521. doi: 10.1128/MCB.01615-07. [DOI] [PMC free article] [PubMed] [Google Scholar]
- 33.Miller SA, Huang AC, Miazgowicz MM, Brassil MM, Weinmann AS. Coordinated but physically separable interaction with H3K27-demethylase and H3K4-methyltransferase activities are required for T-box protein-mediated activation of developmental gene expression. Genes & development. 2008;22:2980–2993. doi: 10.1101/gad.1689708. [DOI] [PMC free article] [PubMed] [Google Scholar]
- 34.Miller SA, Mohn SE, Weinmann AS. Jmjd3 and UTX play a demethylase-independent role in chromatin remodeling to regulate T-box family member-dependent gene expression. Molecular cell. 2010;40:594–605. doi: 10.1016/j.molcel.2010.10.028. [DOI] [PMC free article] [PubMed] [Google Scholar]
- 35.Oestreich KJ, Read KA, Gilbertson SE, Hough KP, McDonald PW, Krishnamoorthy V, Weinmann AS. Bcl-6 directly represses the gene program of the glycolysis pathway. Nature immunology. 2014;15:957–964. doi: 10.1038/ni.2985. [DOI] [PMC free article] [PubMed] [Google Scholar]
- 36.Oestreich KJ, Weinmann AS. Transcriptional mechanisms that regulate T helper 1 cell differentiation. Current opinion in immunology. 2012;24:191–195. doi: 10.1016/j.coi.2011.12.004. [DOI] [PMC free article] [PubMed] [Google Scholar]
- 37.Pollizzi KN, Waickman AT, Patel CH, Sun IH, Powell JD. Cellular size as a means of tracking mTOR activity and cell fate of CD4++ T cells upon antigen recognition. PloS one. 2015;10:e0121710. doi: 10.1371/journal.pone.0121710. [DOI] [PMC free article] [PubMed] [Google Scholar]
Associated Data
This section collects any data citations, data availability statements, or supplementary materials included in this article.


