1. INTRODUCTION
When conducting comparative effectiveness research, it is important to understand the completeness of sources of health care utilization data and how any gaps in the data may affect findings [1]. One method for assessing data completeness is to compare multiple sources of the same information collected through different methodologies. For example, comparisons can be made between primary data collection of self-reported hospitalizations and hospital claims. Each data source has strengths and weaknesses, as one data source may capture hospitalizations that the other misses. Researchers can identify discrepancies between data sources and use the knowledge to improve estimates. Statistical techniques can be used to adjust for factors known to be associated with missing data.
In the case of research using hospitalizations as a primary outcome, some studies have found high concordance between self-reports and either hospital medical records or Medicare claims from the Centers for Medicare & Medicaid Services (CMS) [2, 3]. Other studies have identified important gaps in different sources of hospitalizations and shown that some sources may systematically under-report or over-report hospitalizations. Examples of such gaps include under-reporting hospitalizations in particular geographic areas [4] and under- [5] or over-reporting [6] of hospitalizations in self-reports. Therefore, the existing evidence does not indicate a clear pattern in the extent or type of discrepancies between different data sources for hospitalizations. The inconsistent findings suggest that more research may be useful to identify factors associated with the completeness of hospitalization records.
We compare primary data collection of hospitalizations from an on-going prospective cohort study to administrative Medicare hospital records with the objective to identify the strengths and weaknesses of each data source. Unlike data sources from previous studies that relied solely on self-reports [2–3, 5–6], the cohort study identified hospitalizations through a combination of self-reports and surveillance of medical records. We consider factors that may affect the completeness of hospitalization data including programmatic factors (Medicare Advantage or fee-for-service enrollment), personal characteristics (e.g., veteran status or proximity to death), and study attributes (e.g., use of hospitals out of the study area or loss to follow-up). Evidence on how these factors relate to missing hospitalizations for each data source may help researchers avoid erroneous conclusions by increasing understanding of the frequency and causes of missing hospitalization data.
2. METHODS
2.1. Population / Data Sources
The Atherosclerosis Risk in Communities Study (ARIC) is an on-going longitudinal cohort study funded by the National Heart, Lung, and Blood Institute (NHLBI). Cohort members aged 45–64 were selected in 1987–1989 through population-based random sampling from four US geographic regions: Forsyth County, North Carolina; Jackson, Mississippi; suburbs of Minneapolis, Minnesota; and Washington County, Maryland [7]. Notably, Forsyth County is the only site that sampled enough blacks and whites to analyze the two races separately. The Jackson field center sample only includes blacks and the Minneapolis and Washington County samples are almost entirely white. The analysis drops non-whites from Minneapolis and Washington County and other races besides white and blacks at Forsyth County because the number of these individuals was too small to control for race at these sites.
ARIC conducts ongoing surveillance of hospitalizations for cohort participants through self-report during annual follow-up interviews (AFU) by telephone and review of hospitalization records for all cohort participants. ARIC identifies records through established agreements with hospitals in the study areas and general outreach with hospitals outside study areas. The combination of the cohort self-report and active surveillance components may make ARIC hospitalizations records more complete than other cohort studies that only use one of the two components. In the ARIC hospitalizations from 2006–2011, 65 percent of stays were obtained through self-report, while 35 percent were obtained only through active hospital record surveillance. Although ARIC was able to locate the hospital record for 92% of the self-reported stays (indicating that many would have been obtained through hospital surveillance also), relying on self-report alone would result in many missing stays. During the AFU, investigators ask cohort members about any hospitalizations that occurred since the last communication. If the cohort member has given consent, investigators also request hospital records from hospitals, whether or not reported by the individual during the AFU. Self-reported hospitalizations are confirmed with the hospital and medical records obtained to abstract, at a minimum, discharge date and discharge codes. Although investigators are unable to access records if the cohort member retracted consent [8], fewer than twenty cohort members retracted informed consent for accessing hospital records as of September 2010. Unreported stays at hospitals outside of the ARIC field center regions will be missed because ARIC does not have ongoing agreements outside of the study catchment areas. Hospital stays that are shorter than 24 hours or are for inpatient rehabilitation services or hospice care are not captured by ARIC cohort surveillance of hospitalized events. If a cohort member dies, the investigators ask a proxy to report hospitalizations since the last contact with the study participant. The ARIC study achieved excellent participation over time; by 2011, 90 percent of the surviving cohort still participated in the AFU [9].
Medicare Provider and Analysis Review (MedPAR) data are constructed as a single record per inpatient stay by CMS for Medicare beneficiary admissions to hospitals (short- or long-stay) or skilled nursing facilities (SNF). The MedPAR file does not contain records for patients who present at the emergency room and are kept for observation only (i.e., never admitted to the hospital as an inpatient) even though these observation stays (which are paid under Part B) may last more than 24 hours [10]. Although MedPAR covers 100 percent of Medicare beneficiaries with inpatient admissions, including fee-for-service (FFS) and Medicare Advantage (MA) managed care enrollees [11], MA stay records historically have been incomplete in MedPAR because submission of MA inpatient stay information as shadow bills was requested by CMS but not tied to payment. Beginning in 2008, CMS tied a hospital’s “Disproportionate Share Hospital” (DSH) payment to submission of shadow bills for MA enrollees staying at the hospital [12]. As a result, the completeness of MedPAR hospital records for MA enrollees may have increased since 2008.
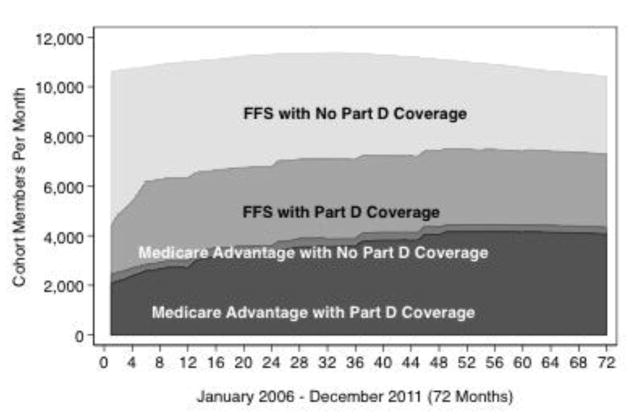
The analysis uses short-stay hospitalizations of Medicare-enrolled ARIC cohort members reported by the ARIC Study and MedPAR between 2006 and 2011. The ARIC study obtained Medicare administrative and claims files for cohort members by providing key variables (social security numbers [SSN], gender, birthdate) and linking records if SSN plus one other key variable matched. This procedure linked 99% of ARIC participants expected to match (e.g., alive after 65 and non-missing SSN). Figure 1 shows the cohort enrollment in Medicare (FFS versus MA, and with or without Part D) over the study period. We merged the ARIC and MedPAR short stay hospitalization records by matching on ARIC ID and discharge date. Discharge dates within seven days of each other were considered matches. ARIC hospitalizations were excluded if the participant was not yet enrolled in Medicare at the time of discharge. Additionally, we used the Medicare outpatient file to identify 2,188 observation stays from 2006–2011 for the cohort members; merging these records with ARIC records led to the exclusion of 542 observation stays that ARIC identified as hospitalizations but would not have matching MedPAR records. Since ARIC did not code hospitalizations shorter than 24 hours, we believe this process eliminated most if not all of the observation stays. MedPAR records were excluded if the stay was in a skilled nursing facility (SNF) or a long-stay hospital (except for 86 SNF or long-stay records that matched an ARIC hospital record discharge date and were for stays of fewer than 30 days, since such stays might represent internal facility transfers or swing-bed utilization). Discharge dates within one day of each other were considered an exact match; discharges were considered a close match if the date in MM/DD/YYYY format differed by one digit and diagnosis codes from both sources were identical. We did not differentiate between exact and close matches during the analysis. If the discharge was not a match after these steps, then it was considered to be only in MedPAR or ARIC, depending on the source.
Figure 1. ARIC Cohort Medicare Enrollment.
FFS vs Medicare Advantage, Part D versus No Part D Coverage
2.2. Statistical Analysis
All analyses assessed the match status of discharges separately for FFS and MA enrollees. We first aggregated the discharges by person-month and graphed the proportion of discharges over time by concordance status: Matched, MedPAR Only, or ARIC Only. For this descriptive analysis, discharges for individuals who died during the month were weighted by the number of days the person was alive in the month divided by the number of days in the month.
We used multinomial logit regression analysis with the merged file of hospital discharge records to assess associations of person characteristics with match concordance status. We controlled for five socio-demographic characteristics: study site, race, age, gender, and Medicaid enrollment at the time of the discharge (indicated by the state-buy-in variable available in Medicare enrollment files). We hypothesized that four additional variables may be associated with match concordance:
Veteran status, as veterans may be treated at Veterans Administration hospitals, which do not submit claims to Medicare;
Whether the person was within three months of death at the time of the discharge, as hospitalizations often increase dramatically as death approaches [13] and MedPAR records might be more complete if ARIC was unable to obtain a proxy interview with a decedent’s caregiver or if a proxy respondent had poor recall;
Whether the person still was participating in the AFU interviews at the time of the discharge, since study attrition could result in reduced completeness of the ARIC records; and
Whether the stay was in a hospital in the ARIC study catchment area, since MedPAR records might be more complete for hospitals that were not part of regular ARIC surveillance.
We obtained information on veteran status from the Life Course Study that was conducted in the ARIC cohort [14]. For information on study attrition, the discharge file was matched with information on the dates and completion status of AFU interviews and whether the cohort member consented to hospital abstraction. We defined AFU coverage using the date when the cohort member most recently agreed to be interviewed. We consider all hospitalizations occurring on or before this date as having AFU coverage and all hospitalizations after this date as not having AFU coverage. After this date, hospitalizations could only be identified through cohort surveillance. As such, the variable is a proxy for the value of AFU coverage in addition to cohort surveillance. Although ARIC attempts to contact a proxy to identify hospitalizations after the death of a cohort member, we did not incorporate proxy interviews in the definition of AFU coverage to improve generalizability. By excluding the proxy interviews the results are applicable to cohort studies that do not conduct proxy interviews. ARIC hospital surveillance for the cohort verified all hospitalizations reported during AFU and proxy interviews.
We estimated multinomial logit models because the dependent variable of interest (discharge concordance status) is a categorical variable with three possible values (Matched, ARIC only, or MedPAR only) [15]. The multinomial logit model assumes the Independence of Irrelevant Alternatives, which states that adding or removing a category from the model does not affect the relative odds for any two categories in the model. We tested this assumption using the Hausman diagnostic test [15, 16], which showed no violation of this assumption. We adjusted the standard errors for clustering by cohort member to correct for correlations among discharges for the same cohort member.
The multinomial logit model was:
CONCORDANCE STATUSi= β0 + β1SITE/RACEi + β2MALEi + β3STATE_BUY_INi + β4VETERANi + β5WITHIN_3_MONTHS_OF_ DEATHi + B6*AFU_COVERAGE + β7OUTSIDE_CATCHMENT_AREAi + γYEARi + δAGE_CATEGORYi + εi
We estimated the models separately based on whether the cohort member was in FFS or MA at discharge.
3. RESULTS
3.1. Overall Concordance and Trends in Concordance
Figure 1 shows the cohort enrollment over time in Medicare, FFS versus MA, and Medicare Part D. By 2008, all cohort members were over 65; the number of cohort members declines after 2008 due to deaths. Enrollment in Part D and MA increased over the study period (2006–2011).
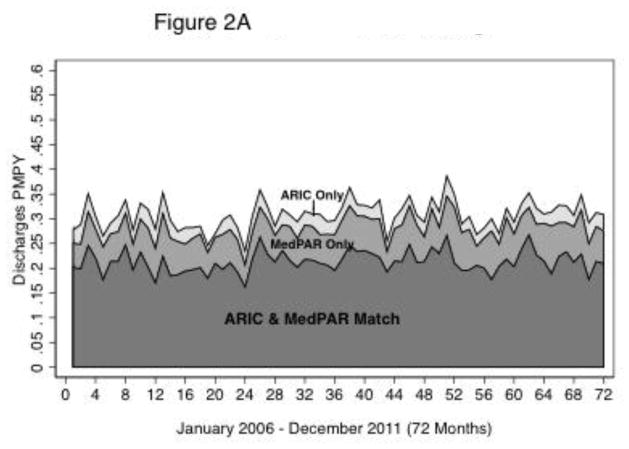
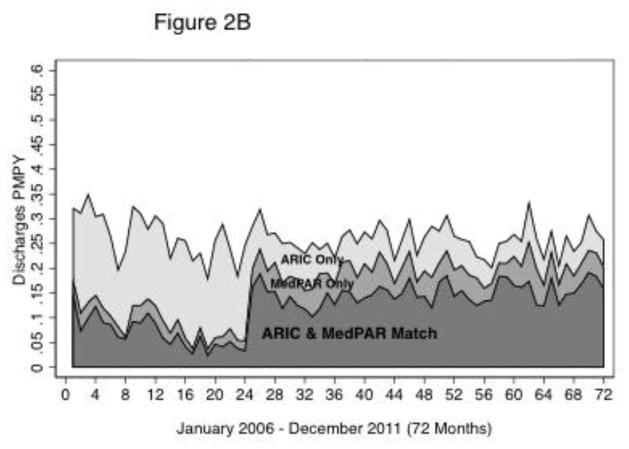
Figure 2A shows that the monthly FFS discharge distribution over the three concordance categories (Match, MedPAR only, or ARIC only) remained relatively stable from 2006 to 2011. The annual proportion of discharges that matched for FFS ranged from 69.1 percent to 71.1 percent (Table 1). The discharges that did not match were more likely to be MedPAR Only (19.5 percent to 22.6 percent) than ARIC Only (8.18 to 10.1 percent). In contrast, Table 1 and Figure 2B show that the distribution of MA discharges by concordance status shifted considerably over the same period. From 2006–2007, the majority of MA discharges were ARIC Only, reflecting the fact that most hospitals did not routinely submit shadow bills for hospital stays for MA enrollees prior to 2008. After December 2007 (month 24) and the new requirement by CMS for DSH reimbursement, the pattern shifted and the majority of discharges were matches [12]. The second section of Table 1 shows that matches for hospitalizations occurring among cohort members enrolled in MA rose from 18.2 percent in 2007 to 54.4 percent in 2008. The percentage of MedPAR Only discharges also increased from 7.9 percent in 2007 to 18.3 percent in 2008, while the percentage of ARIC Only discharges declined from 73.9 percent in 2007 to 27.3 percent in 2008. Following this shift between 2007 and 2008, the distribution of discharges became much more stable from 2008 through 2011, though ARIC Only discharges were slightly more frequent than MedPAR Only discharges.
Figure 2.
Figure 2A: ARIC Cohort Discharges:
FFS Discharge Measures By Month By Source
Figure 2B: ARIC Cohort Discharges:
MA Discharge Measures By Month By Source
Table 1.
Hospital Discharge Concordance by Medicare Program, Year and Site
| Site | ||||||||
|---|---|---|---|---|---|---|---|---|
| Concordance Status | ||||||||
| 2006 | 2007 | 2008 | 2009 | 2010 | 2011 | Change 2006–11 (% Pts) | ||
| FFS | Matched | 69.71% | 69.52% | 71.11% | 70.93% | 69.10% | 69.23% | −0.5 |
|
| ||||||||
| ARIC Only | 10.10% | 9.12% | 9.44% | 8.18% | 8.33% | 9.60% | −0.5 | |
|
| ||||||||
| MedPAR Only | 20.19% | 21.36% | 19.45% | 20.89% | 22.57% | 21.17% | 1 | |
|
| ||||||||
| Total Discharges | 2,477 | 2,230 | 2,373 | 2,296 | 2,075 | 2,026 | ||
|
| ||||||||
| MA (Total & by Site) | Matched | 30.80% | 18.17% | 54.44% | 57.53% | 60.88% | 59.99% | 29.2 |
|
| ||||||||
| ARIC Only | 60.76% | 73.90% | 27.30% | 23.46% | 22.47% | 21.12% | −39.6 | |
|
| ||||||||
| MedPAR Only | 8.44% | 7.93% | 18.25% | 19.01% | 16.65% | 18.89% | 10.5 | |
|
| ||||||||
| Total Discharges | 831 | 855 | 1,010 | 1,127 | 1,149 | 1,171 | ||
|
| ||||||||
| Forsyth County, NC | Matched | 0.20% | 1.45% | 73.91% | 73.44% | 71.76% | 70.90% | 70.7 |
|
| ||||||||
| ARIC Only | 99.80% | 98.00% | 13.74% | 12.50% | 13.47% | 13.73% | −86.1 | |
|
| ||||||||
| MedPAR Only | 0.00% | 0.54% | 12.35% | 14.06% | 14.77% | 15.37% | 15.4 | |
|
| ||||||||
| Total Discharges | 270 | 298 | 334 | 417 | 409 | 425 | ||
|
| ||||||||
| Minneapolis, MN | Matched | 40.85% | 37.70% | 51.47% | 56.36% | 62.88% | 60.55% | 19.7 |
|
| ||||||||
| ARIC Only | 39.77% | 45.36% | 17.30% | 13.05% | 15.02% | 14.08% | −25.7 | |
|
| ||||||||
| MedPAR Only | 19.38% | 16.94% | 31.24% | 30.59% | 22.10% | 25.37% | 6 | |
|
| ||||||||
| Total Discharges | 274 | 265 | 338 | 404 | 392 | 412 | ||
|
| ||||||||
| Jackson, MS | Matched | 44.71% | 8.38% | 38.54% | 43.38% | 55.65% | 58.27% | 13.6 |
|
| ||||||||
| ARIC Only | 48.68% | 84.52% | 50.00% | 44.66% | 30.44% | 22.98% | −25.7 | |
|
| ||||||||
| MedPAR Only | 6.61% | 7.11% | 11.46% | 11.97% | 13.91% | 18.75% | 12.1 | |
|
| ||||||||
| Total Discharges | 222 | 208 | 259 | 247 | 256 | 256 | ||
|
| ||||||||
| Washington Cnty MD | Matched | 79.81% | 39.96% | 36.49% | 15.18% | 18.60% | 6.67% | −63.1 |
|
| ||||||||
| ARIC Only | 16.35% | 52.56% | 54.05% | 77.68% | 71.51% | 89.33% | 63 | |
|
| ||||||||
| MedPAR Only | 3.85% | 7.48% | 9.46% | 7.14% | 9.88% | 4.00% | 0.2 | |
|
| ||||||||
| Total Discharges | 65 | 84 | 79 | 59 | 92 | 78 | ||
FFS = fee for service; MA = Medicare Advantage
Note: The percentages are calculated from discharges that have been weighted to be per-member per-year.
The total discharges are calculated using the raw discharges that have not been weighted.
The trends in concordance status for MA enrollees varied substantially by field center (the bottom half of Table 1). In particular, the increase in MA discharge matches beginning in 2008 was driven by the Forsyth County and, to a lesser extent, the Minneapolis and Jackson field centers, which all had substantial increases in the matched and MedPAR Only discharges and decreases in ARIC Only discharges over time. The matched discharges in Forsyth County increased from 1.5 percent in 2007 to 73.9 percent in 2008. Matched discharges in Minneapolis increased from 37.7 percent to 51.5 percent. Matched discharges in Jackson increased by 13.6 percentage points over the time period. The experience in Washington County, however, was extremely different. Although this area had the fewest MA discharges per year across all four field centers (Table 1), the submission of shadow bills for MedPAR over time appears to have decreased rather than increased. The experience in Washington County demonstrates that some hospitals (e.g., those with a low share of MA enrollees) still appear not to submit shadow bills despite the incentive to submit in order to have their Medicare caseload contribute to their DSH payment beyond 2008.
3.2. Characteristics Associated with Concordance
The first column of Table 2 provides descriptive statistics for the sample of 13,477 hospital stays for FFS Medicare enrollees used in the multinomial logit models of factors associated with concordance of hospital stays from the two sources. For presenting results, we focus on the estimated marginal effects for each characteristic, which indicate the change in the probability (percentage point difference) of being in a concordance category. The findings for FFS cohort members (Table 2) show substantial variation by site and race. Compared to Minneapolis, hospitalizations for cohort members from Washington County were more likely to match and were less likely to be MedPAR Only; cohort members in Washington County were also less likely to have ARIC Only hospitalizations than cohort members in Minneapolis. The 95 percent confidence intervals for comparison to Minneapolis show that hospital stays for blacks in Jackson and for blacks and white in Forsyth County as well as Washington County were significantly less likely to be MedPAR Only (Table 2). The proportion of concordant hospitalizations increased with age while the proportion of ARIC Only hospitalizations decreased with age. Compared to females, males were less likely to match and more likely to be ARIC Only. Stays for persons enrolled in Medicaid through the state buy-in were 4.0 percent less likely to be ARIC Only. Consistent with Figure 2A, concordance proportions varied little over time by year for FFS enrollees.
Table 2.
Marginal Effects from Multinomial Logit Regression of ARIC and MedPAR Matches: FFS Enrollees
| ARIC & MedPAR Match | MedPAR Only | ARIC Only | |||||
|---|---|---|---|---|---|---|---|
|
| |||||||
| Characteristic | Sample Percent | Marginal Effect | 95% CI | Marginal Effect | 95% CI | Marginal Effect | 95% CI |
| Site/Race | |||||||
| Minneapolis, MN | |||||||
| White | 20.37% | Reference | Reference | Reference | |||
| Jackson, MS Black | 26.84% | −3.17% | (−6.81%, 0.48%) | 0.06% | (−2.81%, 2.93%) | 3.10%* | (0.24%, 5.97%) |
| Forsyth, NC White | 16.95% | 1.96% | (−1.23%, 5.16%) | −3.29%* | (−5.84%, −0.75%) | 1.33% | (−0.99%, 3.65%) |
| Forsyth, NC Black | 2.86% | 5.24% | (−1.37%, 11.86%) | −9.63%*** | (−13.88%, −5.37%) | 4.38% | (−0.97%, 9.74%) |
| Washington Cnty, MD White | 32.97% | 12.33%*** | (9.53%, 15.14%) | −10.27%*** | (−12.51%, −8.03%) | −2.06%* | (−4.01%, −0.12%) |
|
| |||||||
| Age 60–70 | 19.95% | Reference | Reference | Reference | |||
| Age 70–75 | 25.23% | 3.10%* | (0.36%, 5.83%) | 1.33% | (−1.17%, 3.82%) | −4.42%*** | (−5.90%, −2.95%) |
| Age 75–80 | 27.22% | 2.75% | (−0.16%, 5.66%) | 1.41% | (−1.28%, 4.10%) | −4.16%*** | (−5.73%, −2.60%) |
| Age 80+ | 27.60% | 4.83%** | (1.82%, 7.83%) | 0.42% | (−2.29%, 3.14%) | −5.25%*** | (−6.88%, −3.62%) |
|
| |||||||
| Female | 56.87% | Reference | Reference | Reference | |||
| Male | 43.13% | −3.71%** | (−6.47%, −0.95%) | 0.98% | (−1.44%, 3.39%) | 2.73%** | (0.90%, 4.56%) |
|
| |||||||
| No State Buy-in | 83.13% | Reference | Reference | Reference | |||
| State Buy-in | 16.87% | 2.11% | (−1.07%, −5.28%) | 1.94% | (−1.00%, 4.87%) | −4.04%*** | (−5.92%, 2.16%) |
|
| |||||||
| Non-Veteran | 74.71% | Reference | Reference | Reference | |||
| Veteran | 25.29% | −0.98% | (−4.28%, 2.31%) | −6.41%*** | (−8.92%, −3.89%) | 7.39%*** | (4.81%, 9.97%) |
|
| |||||||
| >3 Months to | |||||||
| Death | 86.67% | Reference | Reference | Reference | |||
| ≤3 of Death | 13.33% | 5.29%** | (2.28%, 8.3%) | −7.64%*** | (−9.76%, −5.53%) | 2.35% | (−0.20%, 4.91%) |
|
| |||||||
| Not Covered by | |||||||
| AFU | 34.28% | Reference | Reference | Reference | |||
| Covered by AFU | 65.72% | 8.05%*** | (5.44%, 10.67%) | −10.03%*** | (−12.39%, −7.67%) | 1.98%* | (0.44%, 3.51%) |
|
| |||||||
| In Catchment Area | 81.96% | Reference | Reference | Reference | |||
| Outside Catchment Area | 18.04% | −32.06%*** | (−35.00%, −29.13%) | 33.27%*** | (30.30%, 36.24%) | −1.21% | (−2.68%, 0.27%) |
|
| |||||||
| 2006 | 18.38% | Reference | Reference | Reference | |||
| 2007 | 16.55% | −0.34% | (−3.18%, 2.51%) | 1.21% | (−1.41%, 3.83%) | −0.88% | (−2.53%, 0.78%) |
| 2008 | 17.61% | 0.13% | (−2.86%, 3.11%) | −0.15% | (−2.83%, 2.52%) | 0.03% | (−1.85%, 1.90%) |
| 2009 | 17.04% | 0.80% | (−2.17%, 3.76%) | 0.39% | (−2.25%, 3.03%) | −1.19% | (−3.01%, 0.64%) |
| 2010 | 15.40% | −0.14% | (−3.24%, 2.96%) | 0.71% | (−2.06%, 3.49%) | −0.57% | (−2.48%, 1.33%) |
| 2011 | 15.03% | 1.19% | (−1.99%, 4.37%) | −2.89%* | (−5.60%, −0.18%) | 1.70% | (−0.50%, 3.89%) |
N=13,477
p<0.05
p<0.01
p<0.001
Note: “60–70” includes cohort members less than 70 years old, “70–75” include s cohort members greater than or equal to 70 years and less than 75 years old, “75–80” includes cohort members greater than or equal to 75 years old and less than 80 years old, “80+” includes cohort members greater than or equal to 80 years old. There were 143 cohort members enrolled in FFS that were between 60 and 65. They were grouped with individuals between 60 and 70 years old because the number was insufficient for a separate category.
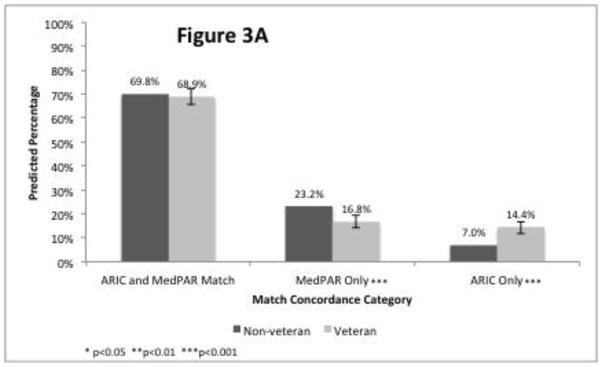
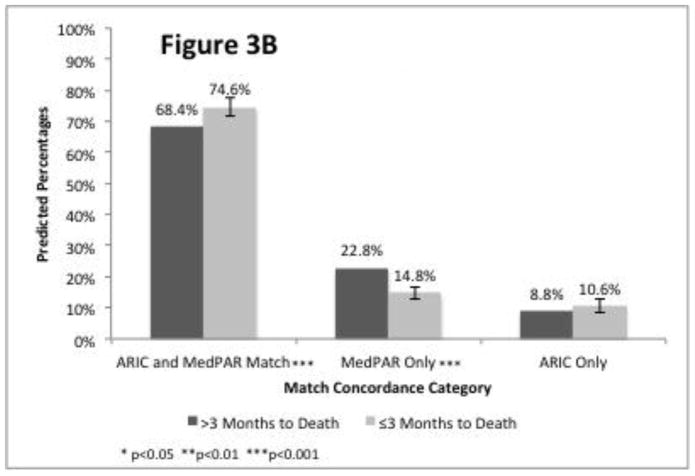
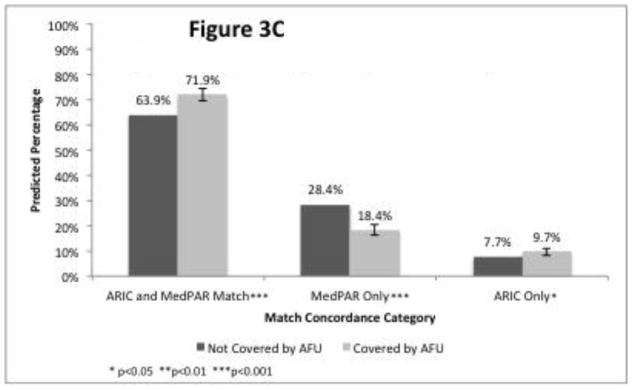
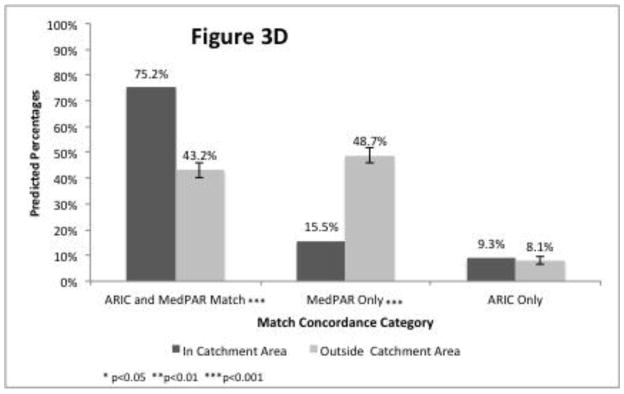
The estimated marginal effects (Table 2) and percentages predicted from the regression (Figure 3) for the three concordance categories support three of the four hypothesized associations between person or programmatic characteristics. Stays for veterans (compared to stays for non-veterans) in a cross-tabulation of concordance and match status (Appendix Table A1) were less likely to be MedPAR Only (16.5% vs. 23.3%), more likely to be ARIC Only (16.1% vs. 6.7%), and similar in matching (67.5% vs. 70.1%). The marginal effects are similar (Table 2), with stays for veterans being significantly less likely to be MedPAR Only and significantly more likely to be ARIC Only, though not significantly different for matching. The percentages predicted from the regression for the concordance categories stratified by veteran status appear in Figure 3A. Contrary to our hypothesis, hospitalizations for persons within three months of death were more likely to match and less likely to be MedPAR Only, as shown by the marginal effects in Table 2 and Figure 3B. Consistent with the hypothesis that ARIC stays will be more complete for people who do not drop out of study contact, continued AFU participation was associated with a higher proportion of stays that matched or were ARIC Only and a reduced proportion of discharges that were MedPAR Only (Table 2 and Figure 3C). Hospitalizations occurring within the catchment area were substantially and significantly more likely to match and less likely to be MedPAR Only (Table 2 and Figure 3D). Hospitalizations outside of the study catchment area were 33.3 percentage points more likely to be available through MedPAR Only compared to hospitalizations within the catchment area, the largest difference associated with any variable studied.
Figure 3.
Figure 3A: Veteran Status
Figure 3B: Proximity to Death
Figure 3C: AFU Coverage (Still Completing Yearly Interviews)
Figure 3D: Hospital is in ARIC Catchment Area
Table A1.
Concordance and Veteran Status
| Concordance Status | Veteran | Non-veteran | |||
|---|---|---|---|---|---|
| Freq. | Pct. | Freq. | Pct. | ||
| FFS | Matched | 2,299 | 67.5% | 7,054 | 70.1% |
|
| |||||
| ARIC Only | 548 | 16.1% | 673 | 6.7% | |
|
| |||||
| MedPAR Only | 561 | 16.5% | 2,342 | 23.3% | |
|
| |||||
| Total Discharges | 3,408 | 10,069 | |||
|
| |||||
| MA | Matched | 747 | 51.4% | 2,260 | 48.2% |
|
| |||||
| ARIC Only | 499 | 34.4% | 1,660 | 35.4% | |
|
| |||||
| MedPAR Only | 206 | 14.2% | 771 | 16.4% | |
|
| |||||
| Total Discharges | 1,452 | 4,691 | |||
MA results (available in an online Appendix Table A2) are similar to the FFS results, although a few notable exceptions occurred. Differences in concordance by geographic site show that compared to Minneapolis, the other sites have higher proportions of ARIC Only stays, even when controlling for time to account for the CMS transmittal on MA shadow bill submission. The marginal effects for year show that matched and MedPAR Only stays were relatively less common in 2006 and 2007 compared to 2008–2011. Concordance was not significantly associated with Veteran status. The effects of continued AFU participation and being within three months of death are similar in both direction and magnitude to the effects found for FFS enrollees. As with the FFS analysis, the most substantive (and statistically significant) effect for MA enrollees was that hospitalizations outside of the study catchment area were 24.9 percentage points more likely to be available through MedPAR Only compared to hospitalizations within the catchment area.
Table A2.
Marginal Effects from Multinomial Logit Regression of ARIC and MedPAR Matches: MA Enrollees
| ARIC & MedPAR Match | MedPAR Only | ARIC Only | |||||
|---|---|---|---|---|---|---|---|
|
| |||||||
| Characteristic | Sample Percent | Margin al Effect | 95% CI | Margin al Effect | 95% CI | Margin al Effect | 95% CI |
| Site/Race | |||||||
| Minneapolis, MN White | 33.94% | Reference | Reference | Reference | |||
| Jackson, MS Black | 23.57% | −17.47%*** | (−22.11%, 12.82%) | −7.06%*** | (−10.21%, 3.91%) | 24.53%*** | (19.63%, 29.43%) |
| Forsyth, NC White | 30.10% | −5.11%** | (−8.67%, 1.55%) | −9.84%*** | (−12.35%, 7.33%) | 14.95%*** | (11.56%, 18.34%) |
| Forsyth, NC Black | 4.95% | −8.50%** | (−14.66%, 2.34%) | −10.71%*** | (−14.66%, 6.77%) | 19.21%*** | (12.89%, 25.54%) |
| Washington Cnty, MD White | 7.44% | −25.26%*** | (−33.74%, 16.78%) | −12.99%*** | (−15.09%,−10.89%) | 38.25%*** | (29.26%, 47.23%) |
|
| |||||||
| Age 60–70 | 18.48% | Reference | Reference | Reference | |||
| Age 70–75 | 26.81% | 2.86% | (−2.23%, 7.95%) | 0.20% | (−3.79%, 4.20%) | −3.06% | (−7.40%, 1.28%) |
| Age 75–80 | 25.96% | 2.23% | (−2.72%, 7.18%) | −0.05% | (−4.18%, 4.08%) | −2.18% | (−6.44%, 2.08%) |
| Age 80+ | 28.75% | 2.56% | (−2.41%, 7.53%) | −0.45% | (−4.70%, 3.79%) | −2.11% | (−6.32%, 2.11%) |
|
| |||||||
| Female | 57.53% | Reference | Reference | Reference | |||
| Male | 42.47% | −1.81% | (−6.13%, 2.51%) | −2.40% | (−5.58%, 0.78%) | 4.21%* | (0.34%, 8.09%) |
|
| |||||||
| No State Buy-in | 87.09% | Reference | Reference | Reference | |||
| State Buy-in | 12.91% | 5.88% | (−0.31%, 12.08%) | 1.00% | (−3.74%, 5.73%) | −6.88%* | (−12.26%, 1.50%) |
|
| |||||||
| Non-Veteran | 76.36% | Reference | Reference | Reference | |||
| Veteran | 23.64% | 2.52% | (−2.54%, 7.58%) | −1.04% | (−4.76%, 2.67%) | −1.48% | (−6.22%, 3.27%) |
|
| |||||||
| >3 Months to Death | 88.60% | Reference | Reference | Reference | |||
| ≤3 of Death | 11.40% | 4.75% | (−0.32%, 9.81%) | 7.03%*** | (−9.65%, 4.42%) | 2.29% | (−2.65%, 7.23%) |
|
| |||||||
| Not Covered by AFU | 33.97% | Reference | Reference | Reference | |||
| Covered by AFU | 66.03% | 5.15%* | (1.07%, 9.23%) | −14.06%*** | (−17.71%, 10.40%) | 8.90%*** | (5.31%, 12.49%) |
|
| |||||||
| In Catchment Area | 88.56% | Reference | Reference | Reference | |||
| Outside Catchment Area | 11.44% | −22.51%*** | (−27.56%, 17.45%) | 24.87%*** | (19.30%, 30.44%) | −2.36% | (−8.02%, 3.29%) |
|
| |||||||
| 2006 | 13.53% | Reference | Reference | Reference | |||
| 2007 | 13.92% | −14.21%*** | (−20.97%, 7.44%) | 1.66% | (−3.84%, 7.17%) | 12.54%*** | (6.74%, 18.35%) |
| 2008 | 16.44% | 14.37%*** | (8.22%, 20.51%) | 7.98%** | (2.80%, 13.16%) | −22.34%*** | (−26.06%, 18.63%) |
| 2009 | 18.35% | 16.95%*** | (10.99%, 22.92%) | 7.95%** | (2.83%, 13.06%) | −24.90%*** | (−28.50%, 21.30%) |
| 2010 | 18.70% | 21.79%*** | (15.97%, 27.60%) | 4.06% | (−0.76%, 8.89%) | −25.85%*** | (−29.50%, 22.19%) |
| 2011 | 19.06% | 21.98%*** | (16.00%, 27.96%) | 3.71% | (−1.29%, 8.72%) | −25.69%*** | (−29.46%, 21.93%) |
N=6,143
p<0.05
p<0.01
p<0.001
Note: “60–70” includes cohort members less than 70 years old, “70–75” includes cohort members greater than or equal to 70 years and less than 75 years old, “75–80” includes cohort members greater than or equal to 75 years old and less than 80 years old, “80+” includes cohort members greater than or equal to 80 years old. There were 143 cohort members enrolled in FFS between 60 and 65. They were grouped with individuals between 60 and 70 years old because the number was insufficient for a separate category.
4. CONCLUSIONS
Overall, the results suggest that, separately, ARIC and MedPAR have relatively complete hospitalization data for FFS (79 percent of hospitalizations for ARIC and 90 percent of hospitalizations for MedPAR from the combined sources), though no gold standard exists. However, ARIC and MedPAR miss, respectively, approximately 20 or 10 percent of total hospitalizations based on the combined hospitalizations reported by both sources. The result is not directly comparable to previous research [2–3, 4–5] because ARIC supplements self-reports with medical record surveillance. Nevertheless, the finding is consistent with prior findings that self-reported data and claims data have a high degree of concordance overall [2, 3], but that each source underreports certain hospitalizations [4, 5]. Analyses that use either only one source (e.g., study surveillance such as that conducted by ARIC or CMS administrative claims) may result in biased estimates due to missing hospitalizations, while combining the two sources likely improves hospitalization event ascertainment.
The new contribution of this analysis is the identification of several factors associated with missing records from two different source and quantification of the magnitude of the missing data problem. ARIC is more complete for hospital stays for veterans, likely because veteran status may reflect access to VA hospitals and the VA does not report claims to Medicare[11]. However, ARIC was also more complete for persons within the last three months of life; while ARIC surveillance excludes hospice stays, it is possible that some inpatient hospice stays occurring in inpatient hospitals could have been coded if the hospice coverage was not clear. ARIC records also were more complete for persons still participating in the AFU telephone interview, which demonstrates the value of the comprehensive efforts by ARIC to obtain information on hospitalizations. ARIC was relatively less complete for hospital stays that occurred outside the ARIC catchment areas, reflecting the value of the arrangements ARIC established with hospitals in the catchment areas to abstract cohort member records. Although MedPAR was only more complete than ARIC with respect to one of the four hypothesized person/programmatic factors (catchment area), the proportion of hospital stays available from MedPAR Only was substantial since MedPAR catches Medicare-covered hospitalizations outside of the ARIC catchment area that may be missed by surveillance. This percentage improvement from MedPAR in Figure 3D is greater in magnitude than the percentage improvement from ARIC for the other three reasons (Figure 3A–3C), though out-of-catchment area hospitalizations only accounted for 18 percent of total hospitalizations (Table 2). Finally, concordance varied substantially across the geographic sites; while the total number of sites is limited, the extent to which beneficiaries use out-of-area hospitals by site (data not shown) may cause some of the observed differences. For example, the proportion of out-of-area hospitalizations was higher and the concordance was correspondingly lower for Minneapolis relative to the other sites.
One notable finding is that the completeness of MA hospitalizations in MedPAR improved dramatically starting in 2008. This shift in the reporting of MedPAR discharges occurred shortly after the CMS transmittal to hospitals regarding shadow bills for MA beneficiaries[12]. This result has implications for using MedPAR data for studying MA hospitalizations. While MedPAR only seemed to capture a quarter of hospitalizations in 2007, MedPAR captured 72–78 percent of hospitalizations after the transmittal. This increased concordance may enable some studies that were not possible before 2008. However, hospitals in some areas still may have low submission rates of shadow bills.
Additionally, the analysis has potential implications for possible benefits from using electronic medical records (EMR) to identify hospitalizations that MedPAR does not capture. The regression results suggest that ARIC cohort surveillance procedures identify additional hospitalizations compared to MedPAR. Since surveillance is expensive and time-consuming, the increasing availability of EMR and attention toward meaningful use could provide less costly and more complete sources of data on hospitalizations for longitudinal analyses. While EMR have advantages over surveillance, potential drawbacks include the additional costs pertaining to acquisition, interoperability across EMR systems, and the fragmented nature of US healthcare. Researchers will have to weigh the pros and cons of EMR when deciding how to incorporate such sources into their research.
The analysis has several limitations. As noted previously, the ARIC study takes place in four geographic areas, and some results may not be generalizable to other regions. Even within these four areas, substantial heterogeneity in discharge concordance occurred for MA enrollees. The ARIC study does not allow for meaningful comparisons by race, as the only site with a mix of white and non-white cohort members is Forsyth County. Since many analyses focus on racial disparities in care and outcomes, it may be desirable to determine the extent to which variation in concordance by site reflects racial or socio-economic differences rather than geographic differences.
An important limitation of generalizability of the results is that the ARIC study devoted considerable resources to collecting hospitalization data, so self-reported hospitalizations from other studies may differ in accuracy or completeness. Notably, the ARIC methodology includes obtaining self-reported hospitalization data from cohort members during the AFU and surveillance of patient records from hospitals in the study areas for participants who provided consent. Since ARIC uses both self-reported data and hospital surveillance, it is unclear whether the results would apply to other data sources that use either self-reported data or hospital surveillance. Although not a focal point of this assessment, the ARIC study could shed light on the relative costs and benefits of supplementing self-reported hospitalizations with surveillance of hospitalization records. But even with the hospital surveillance, the analysis shows that up to 20 percent of total hospital stays for the cohort were either not reported or were out of the study area.
Therefore, the analysis confirms the value of data from multiple sources. Although combining the sources may still miss some hospitalizations, such as stays at VA hospitals that were not self-reported and were outside of the study catchment areas, the sources increase the total number of stays by 10 to 20 percent for FFS enrollees. This study also provides a novel assessment of factors associated with the completeness of hospitalizations in Medicare administrative files and primary data collection of hospitalizations. Future research using different data sources or geographic regions could help determine the generalizability of the findings. Regardless, longitudinal studies of aging cohorts may ensure the validity of outcomes research by using multiple data sources given the fragmented nature of US healthcare.
Acknowledgments
The Atherosclerosis Risk in Communities Study is carried out as a collaborative study supported by National Heart, Lung, and Blood Institute contracts (HHSN268201100005C, HHSN268201100006C, HHSN268201100007C, HHSN268201100008C, HHSN268201100009C, HHSN268201100010C, HHSN268201100011C, and HHSN268201100012C). The authors thank the staff and participants of the ARIC study for their important contributions.
Footnotes
Publisher's Disclaimer: This is a PDF file of an unedited manuscript that has been accepted for publication. As a service to our customers we are providing this early version of the manuscript. The manuscript will undergo copyediting, typesetting, and review of the resulting proof before it is published in its final citable form. Please note that during the production process errors may be discovered which could affect the content, and all legal disclaimers that apply to the journal pertain.
References
- 1.Patient-Centered Outcomes Research Institute Methodology Committee. Hickam David, Totten Annette, Berg Alfred, Rader Katherine, Goodman Steven, Newhouse R., editors. The PCORI Methodology Report. 2013 http://www.pcori.org/content/research-methodology.
- 2.Roberts RO, Bergstralh EJ, Schmidt L, Jacobsen SJ. Comparison of self-reported and medical record health care utilization measures. J Clin Epidemiol. 1996;49(9):989–95. doi: 10.1016/0895-4356(96)00143-6. [DOI] [PubMed] [Google Scholar]
- 3.Zuvekas SH, Olin GL. Validating household reports of health care use in the medical expenditure panel survey. Health Serv Res. 2009;44(5 Pt 1):1679–700. doi: 10.1111/j.1475-6773.2009.00995.x. [DOI] [PMC free article] [PubMed] [Google Scholar]
- 4.Cai S, Mukamel DB, Veazie P, Temkin-Greener H. Validation of the Minimum Data Set in identifying hospitalization events and payment source. J Am Med Dir Assoc. 2011;12(1):38–43. doi: 10.1016/j.jamda.2010.02.001. [DOI] [PMC free article] [PubMed] [Google Scholar]
- 5.Wallihan DB, Stump TE, Callahan CM. Accuracy of self-reported health services use and patterns of care among urban older adults. Med Care. 1999;37(7):662–70. doi: 10.1097/00005650-199907000-00006. [DOI] [PubMed] [Google Scholar]
- 6.Wolinsky FD, Miller TR, An H, et al. Hospital episodes and physician visits: the concordance between self-reports and medicare claims. Med Care. 2007;45(4):300–7. doi: 10.1097/01.mlr.0000254576.26353.09. [DOI] [PMC free article] [PubMed] [Google Scholar]
- 7.The ARIC Investigators. The Atherosclerosis Risk in Communities (ARIC) Study - Design and Objectives. American Journal of Epidemiology. 1989;129(4):687–702. [PubMed] [Google Scholar]
- 8.ARIC Coordinating Center. ARIC Protocol Manual 1 General Description and Study Management. The National Heart, Lung, and Blood Institute; 1987. [Google Scholar]
- 9.Collaborative Studies Coordinating Center Internal Document: Table 1. Follow-up Response Rates (%) for Contact Years 2–24. Chapel Hill, North Carolina: [Accessed February 22 2014]. https://www2.cscc.unc.edu/aric/ [Google Scholar]
- 10.United States Department of Health and Human Services; Office of the Inspector General, editor. Hospitals’ Use of Observation Stays and Short Inpatient Stays for Medicare Beneficiaries, OEI-02-12-00040. Washington, DC: 2013. [Google Scholar]
- 11.Centers for Medicare & Medicaid Services (CMS) [Accessed February 9 2014];Medicare Provider Analysis and Review (MEDPAR) File. 2013 http://www.cms.gov/Research-Statistics-Data-and-Systems/Files-for-Order/IdentifiableDataFiles/MedicareProviderAnalysisandReviewFile.html.
- 12.Centers for Medicare & Medicaid Services (CMS) Transmittal 1311: Capturing Days on Which Medicare Beneficiaries are Entitled to Medicare Advantage (MA) in the Medicare/Supplemental Security Income (SSI) Fraction. 2007
- 13.Stearns SC, Norton EC. Time to include time to death? The future of health care expenditure predictions. Health Economics. 2004;13(4):315–27. doi: 10.1002/hec.831. [DOI] [PubMed] [Google Scholar]
- 14.Chichlowska KL, Rose KM, Diez-Roux AV, et al. Life course socioeconomic conditions and metabolic syndrome in adults: the Atherosclerosis Risk in Communities (ARIC) Study. Ann Epidemiol. 2009;19(12):875–83. doi: 10.1016/j.annepidem.2009.07.094. [DOI] [PMC free article] [PubMed] [Google Scholar]
- 15.Kwak C, Clayton-Matthews A. Multinomial logistic regression. Nurs Res. 2002;51(6):404–10. doi: 10.1097/00006199-200211000-00009. [DOI] [PubMed] [Google Scholar]
- 16.Hausman J, McFadden D. Specification tests for the multinomial logit model. Econometrica: Journal of the Econometric Society. 1984:1219–40. [Google Scholar]


