

Abstract
Provider consolidation has been associated with higher health care prices and spending. Prevailing wisdom assumes that payment reform will accelerate consolidation, especially between physicians and hospitals and among physician groups, as providers position themselves to bear financial risk for the full continuum of patient care. Drawing from a number of data sources from 2008 onward, we examined the relationship between Medicare’s Accountable Care Organization (ACO) programs and provider consolidation. According to multiple measures, consolidation was underway in 2008–2010, before the Affordable Care Act (ACA) established the ACO programs. While the number of hospital mergers and specialty-oriented physician group size increased after the ACA, we found minimal evidence associating consolidation with ACO penetration at a market level or with ACO participation by physicians within markets. We conclude that payment reform has been associated with little acceleration in consolidation apart from trends already underway, but with some evidence of potential defensive consolidation in response to new payment models.
The past few years have seen rapid expansion of new payment models that hold health care providers accountable for total spending and quality of care for their patients. The Department of Health and Human Services recently announced that they have achieved their stated goal of tying 30% of Medicare payments to such alternative payment models by 2016.[1] The Accountable Care Organization (ACO) programs are the broadest of the alternative payment models, with over 460 participating provider organizations in 2016, covering 23.5% of fee-for-service Medicare beneficiaries.[2] The ACO programs set a global budget for total spending for an ACO’s patient population, with incentives for the ACO to lower spending below the budget and provide high quality of care. Commercial insurers have instituted similar payment systems, with many Medicare ACOs also participating in commercial ACO contracts.[3,4]
Although designed to remedy the incentives of fee-for-service payment systems, payment models that delegate financial risk to providers for the full continuum of their patients’ care have triggered concerns that providers will consolidate in response.[5,6] Provider consolidation may lead to higher prices (or budgets) negotiated with commercial insurers. Thus while ACOs may benefit the Medicare program, they may adversely affect the commercial population.
Provider consolidation generally takes two forms, horizontal (two hospitals merge) and vertical (a hospital system purchases a physician group), though both may be involved in a merger or acquisition (a merger of two health systems). The association between horizontal consolidation and higher prices has been well documented in hospital markets,[7] and to a lesser extent in physician markets.[8,9] Mounting evidence suggests that financial integration between physicians and hospitals also leads to higher prices and spending.[10,11]
Potential Reasons for Consolidation
There are many potential reasons for the horizontal and vertical consolidations that began before the establishment of the 2010 Affordable Care Act (ACA) Medicare ACO programs. Consolidation may allow providers to negotiate higher rates from commercial insurers, boost the number of referrals or admissions, amass sufficient capital to invest in lucrative services, pool their malpractice risk, compete for physician labor, reconfigure capacity in response to technological changes that shift care settings, or lower costs (e.g., of information technology) through economies of scale. Hospitals and physicians also may consolidate to take advantage of Medicare payment rules that favor provision of services in hospital outpatient departments, rather than physician offices.[12]
Empirical Evidence and the Prevailing Concern
There has been widespread concern that a wave of consolidation would follow the launch of the ACO programs because providers would seek greater scale and scope to enter and succeed under new payment models,[13,14] but there is little empirical evidence to support this worry. While there are conceptual reasons why larger provider organizations might be better suited to succeed in ACO contracts, research suggests that consolidation beyond a modest level may neither be necessary nor advantageous for providers operating under new payment models. Specifically, while large physician groups exhibit greater structural capacity for care management and perform better than smaller groups on some process measures of quality,[15,16,17] these gains may be achieved at organizational sizes far smaller than large integrated health systems and have not translated into better patient outcomes or more efficient care.[18,19] Moreover, previous studies do not support the assumption that establishing direct managerial control through ownership over the full spectrum of patient care is necessary to control spending and improve quality. Studies comparing medical groups and independent practice associations have produced mixed results,[15,20] and hospital ownership of physician practices has been associated with higher spending without clear gains in quality.[21]
The lack of evidence extends to payment systems that reward more efficient care. Under capitation incentives, large physician groups have exhibited lower spending levels than small practices, but no lower than medium-sized practices.[18] Thus far in the Medicare Shared Savings Program, independent physician groups have generated greater savings than larger vertically integrated organizations.[3,22] Organizations owning hospitals and specialty practices have weaker incentives than those that do not to limit use of inpatient and specialty care under ACO contracts, and evidence from Medicare and commercial ACO initiatives suggests that providers can successfully influence use of care in multiple settings without formal ownership arrangements uniting providers.[3,23,24]
Finally, if gaining bargaining power in price negotiations with commercial insurers has been the primary motive for consolidation, one would not expect acceleration in provider consolidation associated with ACO contracting, because the desire to command higher prices (or budgets) and negotiate better terms exists in both fee-for-service and alternative payment models. Payment reform could even reverse some previous reasons to consolidate, such as pooling resources to invest in profitable service lines under fee-for-service but cost centers under new payment models. Thus, it is not clear that we should expect providers participating or preparing to participate in new payment models to consolidate at a greater pace than the status quo.
However, contrary to the standard narrative, payment reform might prompt some providers to consolidate to preserve their market position, rather than to enter and succeed under risk contracts. Hospitals and specialists in particular might consolidate to rebuff payer pressure to enter risk contracts or to achieve sufficient market share to ensure continued referrals from ACOs that might otherwise steer patients to more efficient providers.
Study Overview
In this article, we examined the relationship between Medicare ACO program participation and multiple measures of horizontal and vertical consolidation from before to after the ACA. In two complementary analyses, we compared consolidation over these periods between markets with more vs. less ACO contracting by 2014 and between physicians within a market who entered an ACO contract by 2014 vs. those who did not.
Our analyses are descriptive but nevertheless useful in gauging the extent of consolidation associated with payment reform under various scenarios. For example, under the prevailing narrative of providers consolidating to enter and succeed under ACO contracts, we would expect increases from the pre-ACA to post-ACA periods to be greater in markets with higher levels of ACO program entry. Because patient populations covered by ACO contracts are defined by where patients receive outpatient care, primarily primary care, we would particularly expect (under the prevailing narrative) acceleration in horizontal consolidation among physician practices and vertical consolidation between hospitals and physicians to be associated with uptake of ACO contracts, especially consolidation involving primary care physicians (PCPs). By this rationale, we would also expect physicians whose practices entered the ACO programs to exhibit greater consolidation leading up to or shortly after their entry than other physicians in their markets.
If providers have consolidated primarily as a defensive response to payment reform, on the other hand, we would expect greater increases among non-participating physicians, with ambiguous effects on the market-level relationship between ACO program entry and consolidation over time.
Methods
STUDY DATA AND POPULATION
To assess provider consolidation, we used Medicare claims from 2008–2013, data from the American Hospital Association Annual Survey from 2008–2013, and the Irving Levin Associates’ Health Care Mergers and Acquisitions Database from 2008–2015. We used definitions of ACOs from the Centers for Medicare and Medicaid Services (CMS) to identify physicians and practices participating in ACOs and to assess ACO contracting at the metropolitan statistical area (MSA) level. Finally, we used the Truven Health MarketScan Commercial Database to measure commercial health care prices at the MSA level, as an indirect measure of consolidation that our direct measures may have not reflected.
We relied predominantly on Medicare claims for a 20% random sample of beneficiaries to calculate annual market-level measures of provider market structure. We excluded small markets with few physicians billing Medicare (Appendix Section I).[25] Our assessments of provider market structure from Medicare claims included 301,855 physician national provider identifiers billing under 103,745 tax identification numbers in 289 MSAs. A tax identification number may represent a solo practitioner, a practice, or a larger provider organization. Large organizations typically bill under multiple tax identification numbers.
For within-market analyses, we restricted national provider identifiers or tax identification numbers to those present in Medicare claims throughout the study period, so that we could assess the organizational characteristics of each in every study year after determining whether each was participating in an ACO contract starting in 2012, 2013, or 2014.
STUDY VARIABLES
MEDICARE ACO PARTICIPATION AND PENETRATION
We used the ACO Provider-level Research Identifiable File to identify tax identification numbers participating in a Medicare Shared Savings Program ACO contract that started in 2012, 2013, or 2014 and CMS definitions of Pioneer ACOs to identify national provider identifiers for physicians participating in a Pioneer contract.[26] In 2012, 32 organizations entered the Pioneer program and 114 entered the MSSP. In 2013 and 2014, an additional 106 and 115 organizations entered the MSSP, respectively. Based on MSSP rules, we attributed each beneficiary to the ACO or non-ACO tax identification number that accounted for the most allowed charges for qualifying outpatient evaluation and management services delivered to the beneficiary by a primary care physician during each year.[3] To calculate a measure of ACO penetration at the MSA level, we divided the number of ACO-assigned Medicare beneficiaries in each MSA by the count of assignment-eligible Medicare beneficiaries in the MSA (Appendix Section II).[25]
For within-market comparisons, we classified each physician as participating or not participating in an ACO by 2014. Physicians were identified as participating in an ACO if their national provider identifier was included in a Pioneer contract or if they billed primarily under a tax identification number included in a Medicare Shared Savings Program contract starting in 2012, 2013, or 2014.
PHYSICIAN-HOSPITAL INTEGRATION
We measured physician-hospital integration using place of service codes in Medicare claims that distinguish between a service provided in a physician practice owned by a hospital, as in a hospital outpatient department, and when it is rendered in the office setting.[27] Specifically, for each year from 2008–2013, we determined each physician’s share of Medicare claims for outpatient care that was billed with a hospital outpatient department setting code. We considered physicians to be practicing in a hospital-owned practice if they billed at least 90% of their outpatient care with a hospital outpatient department setting code (Appendix Section III).[25] From this physician-level variable, we calculated the share of physicians in a MSA who displayed billing patterns consistent with physician-hospital integration.
HOSPITAL AND PHYSICIAN MARKET CONCENTRATION
For market-level analyses, we calculated a Herfindahl-Hirschman Index (HHI), a standard measure of market concentration, for hospital and physician markets in each year from 2008–2013. Higher values corresponded to greater concentration. Using data from the American Hospital Association Annual Survey Database, we defined each hospital’s market share as its share of total hospital admissions in an MSA, accounting for common hospital ownership in the case of hospital systems. Using Medicare claims for professional services and tax identification numbers to define physician groups, we defined each group’s market share as its share of total allowed charges for outpatient care in the MSA. We also explored alternate measures of market concentration, including four-firm concentration ratio (Appendix Section IV).[25]
PHYSICIAN GROUP SIZE
For between-market and within-market comparisons, we assessed physician group (tax identification number) size, defined as the count of distinct physician national provider identifiers billing under each tax identification number in Medicare professional claims, excluding those with inpatient-based specialties. For between-market comparisons, we calculated a MSA-level average of group size, weighting each group by its share of national provider identifiers in the market. This MSA-level measure can be interpreted as a physician’s average practice size in the market. For a supplementary analysis, we also assessed physician group specialty mix, defined as the percent of national provider identifiers billing under each tax identification number who had a primary care specialty (Appendix Section V).[25]
MERGERS AND ACQUISITIONS
To identify instances of provider consolidation directly, we used data collected by Irving Levin Associates on publicly announced mergers and acquisitions involving physician groups or hospitals from 2008–2015.[28] We identified the tax identification number(s) for each acquired physician group using publicly available databases linking practice names to tax identification numbers, thereby allowing us to identify physicians that practiced in an acquired group (Appendix Section VI).[25] We linked the acquired tax identification numbers and their constituent national provider identifiers to those constituting MSSP or Pioneer ACO contracts. In within-market analyses, this linkage allowed us to compare changes in rates of acquisition from before to after the ACA for physicians entering ACO contracts in 2012, 2013, or 2014 vs. non-participating physicians.
COMMERCIAL PRICES
With commercial claims from the MarketScan database, we calculated a MSA-level price index for inpatient and outpatient care, using a market basket of services that covered a large share of spending. An index above one indicated an MSA where mean services prices exceeded the national mean and vice versa for an index below one (Appendix Section VII).[25]
INSURANCE MARKET STRUCTURE
We used HealthLeaders InterStudy data from 2008–2013 to create a commercial insurance market HHI, using the share of covered lives as the measure of an insurer’s market share, and to assess commercial health maintenance organization (HMO) penetration in each year, calculated as the percent of commercially insured persons enrolled in an HMO plan. Finally, we used the Medicare Beneficiary Summary File to assess HMO penetration in Medicare, calculated as the percent of Medicare beneficiaries in a Medicare Advantage HMO plan.
STATISTICAL ANALYSIS
BETWEEN-MARKET COMPARISONS
Using linear regression, we compared changes in provider consolidation from 2008–2010 to 2011–2013 between markets with higher vs. lower ACO penetration as of 2014. We considered 2008–2010 as the pre-period because we would not expect significant consolidation in response to the ACO programs prior to their enactment by the ACA in 2010. The post-period of 2011–2013 allowed for 1–3 years of anticipatory consolidation and up to 2 years of consolidation following ACO entry for providers entering ACO programs in 2012, 2013, or 2014.
We modeled each market-level measure of provider market structure (physician-hospital integration, physician group size, physician market concentration, hospital market concentration, and prices) as a function of an indicator for the post-period, an interaction between ACO penetration and the post-period, and MSA indicators. The interaction estimated the differential change in provider market structure from the pre-period to the post-period that was associated with greater entry into Medicare ACO programs as measured by 2014 ACO penetration. In the models, we also included commercial insurance market concentration, commercial HMO penetration, and Medicare HMO penetration to adjust for effects of insurance market changes on provider consolidation and prices
For each measure of provider market structure and prices, we present annual means by quartile of 2014 ACO contracting to facilitate interpretation of results. We also estimated overall national trends over the pre-period and tested whether these trends changed in the post-period. Finally, to explore potential ceiling effects (i.e., ACO contracting occurring predominantly in already concentrated markets with less opportunity for further consolidation), we restricted analyses to MSAs in the lower three quartiles of the distribution for a given measure.
WITHIN-MARKET COMPARISONS
To hold market factors constant, we conducted within-market comparisons of changes in organizational characteristics from 2008–2010 to 2011–2013 between physicians or physician groups that entered an ACO contract by 2014 vs. those that did not. The characteristics (linked to physicians via national provider identifiers or groups via tax identification numbers) included a physician-level indicator of practicing in a hospital-owned practice, physician group size, and a physician-level indicator of practicing in a group acquired by a hospital or other group, all of which we assessed in each study year. We modeled each characteristic as a function of MSA indicators, a time-invariant indicator for Medicare ACO participation in 2014, an indicator for the post-period, and an interaction between ACO participation and the post-period. The interaction estimated the differential change from the pre-ACA to post-ACA period in organizational structure for physicians who entered the ACO programs in 2012, 2013, or 2014, holding market factors constant. We weighted each tax identification number in the analysis of provider group size by the tax identification number’s size (number of physicians) at baseline in 2008–2010 to facilitate interpretation of result in terms of a physician’s average group size, consistent with our between-market analyses.
In a supplementary analysis, we similarly modeled physician group size and primary care orientation after stratifying groups based on their baseline primary care orientation to determine whether any growth in group size was primarily due to the incorporation of more primary care physicians or specialists.
LIMITATIONS
Our study had several limitations. First, our analyses are descriptive and do not support causal conclusions about the effects of the ACO programs on provider consolidation. For example, ACO contracting could be associated with provider consolidation not because of the change in payment incentives but rather because providers that consolidated for other reasons were, in turn, more likely to participate in the ACO programs. Nevertheless, by assessing the relationship between ACO contracting and provider consolidation, we were able to observe whether trends were consistent with widely-held expectations that new challenges from payment reform would accelerate consolidation as providers integrate to meet them.
Second, changes in market-level drivers of both ACO participation and provider consolidation could have obscured or exaggerated a relationship between the two. In addition, MSAs may not perfectly reflect the market for physician and hospital services. However, our supplemental between-physician comparisons within markets held MSA-level factors constant, did not rely on market definitions to assess consolidation, and supported similar conclusions.
Third, we could only assess provider consolidation to the extent it can be measured with claims data and publicly reported mergers and acquisitions. Our analysis of prices, however, should have reflected any unobservable provider consolidation, net of any independent effects of ACO contracting on price competition.
Finally, for most measures we could only assess consolidation through 2013 as related to ACO contracting through 2014, and therefore may have missed more recent consolidation. Our post-ACA period allowed for 3 years of consolidation among providers planning to enter the ACO programs, however, and approximately 1 in 5 fee-for-service Medicare beneficiaries were in ACO contracts by 2014.
STUDY RESULTS
Overall Trends
From 2008 to 2013, all measures of provider market concentration and prices increased significantly (p<0.001 for annual changes; Appendix Exhibit A1).[25] The average MSA experienced a cumulative increase from 2008 to 2013 in physician-hospital integration of 6.3 percentage points (from 16.8% of physicians in a hospital-owned practice to 23.1%), an increase in physician concentration (HHI) of 76 points, an increase in a physician’s average group size of 22 physicians, an increase in hospital concentration (HHI) of 279 points, and increases in inpatient and outpatient price indices of 28% and 14%, respectively. For most measures of concentration and prices, trends changed minimally from the pre-period to post-period (Appendix Exhibit A2).25 However, physician group size grew considerably faster during the post-period (trend increase of 1.6 physicians/group per year; p=0.09). There was also a clear surge in the number of hospital mergers in the post-period, but no clear increase in mergers and acquisitions involving physician groups apart from a spike in 2011 (Appendix Exhibit A3).[25]
Between-Market Analysis
By 2014, ACO penetration reached an average of 21.3% and varied considerably across MSAs (interquartile range, 2.7%–32.6%, Appendix Exhibit A4).[25] Notably, at baseline, markets with higher 2014 ACO penetration had significantly higher levels of physician-hospital integration, but more competitive hospital and insurance markets, and higher commercial HMO penetration (Exhibit 1).
EXHIBIT 1.
Characteristics of Metropolitan Statistical Areas, Physicians, and Physician Groups, by 2014 ACO Penetration, 2008–2010
| Pre-Period (2008–2010) | ||||
|---|---|---|---|---|
| 2014 ACO Penetration | ||||
| MSA-level Characteristics | Lowest Quartile (n=73) | Quartile 2 (n=72) | Quartile 3 (n=72) | Highest Quartile (n=72) |
| Physician-hospital integration, % | 13.6 | 15.7 | 18.1 | 23.8** |
| Physician group size, mean | 96.2 | 77.8 | 75.5 | 118.6 |
| Physician HHI, mean | 953 | 987 | 547 | 1036 |
| Hospital HHI, mean | 4950 | 4619 | 3181 | 4703** |
| Insurance HHI, mean | 2958 | 2550 | 2275 | 2480**** |
| Medicare HMO Penetration, % | 8.0 | 9.4 | 11.8 | 5.9 |
| Commercial HMO Penetration, % | 16.1 | 18.6 | 20.9 | 21.0**** |
| Inpatient Services Price Index | 0.80 | 0.80 | 0.78 | 0.77* |
| Outpatient Services Price Index | 0.96 | 0.89 | 0.92 | 0.96 |
| Pre-Period (2008–2010) | ||||
| Physician- or Practice-level (TIN) Characteristics | ACO Non-Participant (in 2012,2013, or 2014) | ACO Participant (in 2012,2013, or 2014) | ||
| Practice in a hospital-owned facility, % of physicians | 16.9% | 20.2%**** | ||
| Practice acquired, % of physicians | 0.1% | 0.4%**** | ||
| Physicians’ mean practice (TIN) size, # of physicians | 69.3 | 130.6**** | ||
NOTES
p<0.1,
p<0.05,
p<0.01,
p<0.001.
P-values come from a chi-squared test for trend over quartiles of ACO penetration. Physician’s average group size was calculated as the average count of physicians billing for outpatient care within a TIN, weighting each TIN by its share of total physicians in the MSA. MSA is Metropolitan Statistical Area. ACO is Accountable Care Organization. TIN is Tax Identification Number. HHI is Herfindahl Hirschman Index. HMO is Health Maintenance Organization.
Reported P-values come from a chi-squared test for trend over quartiles of ACO penetration. Physician’s average group size was calculated as the average count of physicians billing for outpatient care within a TIN, weighting each TIN by its share of total physicians in the MSA. MSA is Metropolitan Statistical Area. ACO is Accountable Care Organization. TIN is Tax Identification Number. HHI is Herfindahl Hirschman Index. HMO is Health Maintenance Organization.
In comparisons of provider market consolidation by 2014 ACO penetration, we found that although provider market structure differed at baseline by 2014 ACO penetration and changed over time, markets with higher 2014 ACO participation did not experience greater growth in physician-hospital integration or physician group size (Exhibit 2), or in physician market concentration, hospital market concentration, or commercial prices from the pre-ACA to post-ACA periods (Appendix Exhibits A5–A6).[25] Sensitivity analyses focusing on hospital integration of PCPs specifically, restricting to MSAs in the lower three quartiles of the distribution for each dependent variable, using an alternative measure of market concentration, or omitting insurance market structure variables yielded similar findings.
EXHIBIT 2. Provider Market Structure by Quartile of 2014 ACO Penetration, 2008–2013.
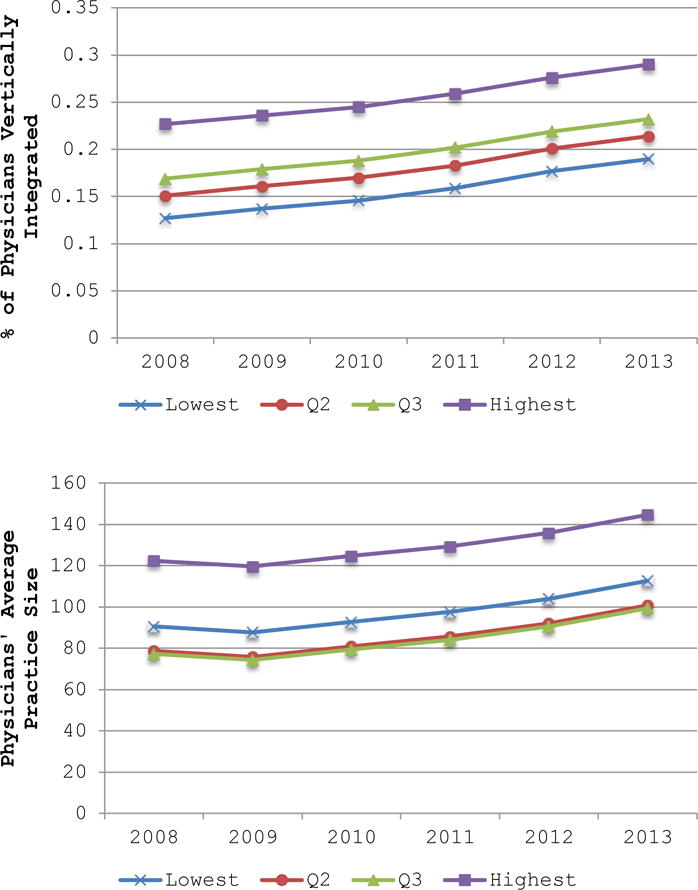
SOURCE Authors’ analysis of data from the Centers for Medicare and Medicaid.
NOTES Both panels result from separate between-market analyses, presenting the average annual value of the dependent variable, by quartile of 2014 ACO penetration. Physician’s average group size was calculated as the average count of physicians billing for outpatient care within a TIN, weighting each TIN by its share of total physicians in the MSA. ACO is Accountable Care Organization. TIN is Tax Identification Number.
Within-Market Analysis
Within MSAs prior to 2010, physicians who would later join an ACO were more likely to be integrated with a hospital, to practice in a large group, and be acquired by a hospital or physician group than physicians who would not join an ACO by 2014 (Exhibit 3, Appendix Exhibits A7–A8).[25] Of our measures of physician organizational structure, only group size increased differentially by ACO participation. From 2008–2010 to 2011–2013, a physician’s average group size grew by 11.4 more physicians for physicians whose practices entered the Medicare ACO programs than for other physicians in their MSA (p=0.002). Analysis of group size and primary care orientation after stratification by baseline specialty mix revealed that this growth in group size was driven largely by the addition of more specialists or specialty practices to organizations that were already large and composed primarily of specialists in the pre-period (Appendix Exhibit A9).[25]
EXHIBIT 3.
Changes in Organizational Structure from the pre-ACA to post-ACA period by 2014 ACO Program Participation
| Did not enter ACO programs by 2014 | Entered ACO programs by 2014 | ||||
|---|---|---|---|---|---|
| Physician- or Practice-level (TIN) Characteristics | Pre-Period (2008–2010) | Post-Period (2011–2013) | Pre-Period (2008–2010) | Post-Period (2011–2013) | Differential Change for ACO Program Participants |
| Practice in a hospital-owned facility, percent of physicians | 16.9% | 19.3% | 20.2% | 23.7% | 1.1% |
| Practice acquired, percent of physicians | 0.1% | 0.2% | 0.4% | 0.3% | −0.02% |
| Physicians’ mean practice (TIN) size, number of physicians | 69.3 | 77.2 | 130.6 | 149.9 | 11.4** |
SOURCE Authors’ analysis of data from the Centers for Medicare and Medicaid and Irving Levin Associates.
NOTES Each line results from separate within-market analyses, presenting the average pre- and post-period value of the dependent variable, by 2012, 2013, or 2014 ACO participation. Physician’s mean practice size was calculated as the average count of physician billing for outpatient care within a TIN, weighting each TIN by its share of total physicians in the MSA. Percent of physicians acquired was calculated as the share of physicians billing under a TIN that was identified as the target of a merger or acquisition in any given year. ACO is Accountable Care Organization. TIN is tax identification number
p<0.05
Discussion
Many have predicted that providers would respond to the rapid growth of new payment models by forming larger organizations to assume financial risk and succeed under these models. We found little evidence, however, to support this prediction.
From 2008 to 2013, markets with greater 2014 ACO participation did not experience differential changes in physician-hospital integration, physician group size, physician market concentration, hospital market concentration or, importantly, commercial prices. Within markets, we found that physicians who entered the Medicare ACO programs between 2012–2014 showed no differential increase in integration with hospitals or rates of acquisition from pre to post-ACA, when compared with other physicians in the same market. Physician groups that entered the ACO programs did exhibit significantly greater growth in size than other practices in their market. This differential increase in group size among ACO participants was driven largely by the addition of specialists, rather than PCPs, to already specialty-oriented practices, suggesting that they likely did not grow in order to become ACOs. For a specialty-oriented group to position itself to enter an ACO contract, one would expect a reorientation towards primary care. Similarly, we found no evidence of greater integration of PCPs with hospitals from pre to post-ACA related to ACO participation.
We also found an overall surge in hospital mergers after the ACA without changes in hospital market concentration related to ACO penetration, and a significant inverse relationship between hospital market concentration in the pre-ACA period and the extent of subsequent ACO contracting. These findings suggest that new payment models may have triggered some consolidation as a defensive reaction to the threat these models pose rather than as a means to achieve efficiencies in response to the new incentives. Hospitals and specialists in particular might consolidate both horizontally and vertically to achieve sufficient market share to resist payer pressure to enter risk contracts[18] or weaken the ability of ACOs to exploit competition in hospital and specialty markets to compel reductions in prices and service volume. Similarly, rhetoric about the benefits of integration under new payment models may have lent credence to arguments by hospitals and specialists about the clinical efficiencies from mergers and acquisitions that would have otherwise faced stiffer challenges before the ACA.
Policy Implications and Conclusion
In general, the overall weak relationship we found between ACO contracting and consolidation from the pre-ACA to post-ACA periods should ease concerns of critics of payment reform, who have argued that the inevitable provider consolidation necessary to support new payment models is a reason to slow the transition away from fee-for-service payment. Similarly, our findings would not support abandoning ACO-like global budget models in favor of smaller payment bundles to avoid price increases from the types of consolidation that many have assumed are required to manage a global budget.
Our findings do nothing, however, to diminish the importance of the trend towards less competitive provider markets and associated price increases. In fact, we also found suggestive evidence of acceleration in specialist and hospital consolidation potentially related to payment reform but not expected to support new payment models. While our methods cannot determine whether this consolidation has been defensive in nature or due to other factors like those driving consolidation before the ACA, our findings nevertheless question the prevailing wisdom that payment reform is driving consolidation of providers as they seek to enter and succeed under new payment models. Thus, even if there has been some defensive consolidation, the weak relationship between ACO contracting and forms of consolidation that would support ACO contracts has important implications for antitrust law enforcement. Specifically, our study supports skepticism of claims by providers that they are consolidating primarily to engage in risk contracts and achieve efficiencies.
APPENDIX
I. Metropolitan Statistical Area Inclusion Criteria
Because we used Medicare claims to assess physician-hospital integration, we limited our sample to include MSAs with at least 150 physicians billing Medicare annually between 2008 and 2013. We did this to avoid identifying changes in physician-hospital integration driven by random shifts between settings in Medicare claims for small numbers of beneficiaries in small markets. This restriction also likely improved within-MSA overlap between providers contributing to physician-integration assessed with Medicare claims and providers captured in MarketScan. This restriction resulted in a sample of 289 MSAs.
For our analyses where construction of the dependent variable relied on the MarketScan databases, we further limited our sample of MSAs. The MarketScan database includes inpatient and outpatient claims for a convenience sample of private health plans and self-insured employers. Because MarketScan data varied geographically in representativeness and included an increasing number of employers and health plans over the study period, we limited our analyses to the MSAs where the MarketScan preferred-provider organization (PPO) or point-of-service (POS) population in 2008–2013 represented at least 15% of commercially insured individuals with coverage through a PPO or POS health plan, according to the InterStudy HealthLeaders data. For the analyses using inpatient and outpatient price indices as the dependent variable, this restriction resulted in a sample of 226 MSAs.
II. Medicare ACO Penetration
To calculate a measure of ACO penetration at the MSA level, we divided the number of ACO-assigned Medicare beneficiaries in each MSA by the count of assignment-eligible Medicare beneficiaries in the MSA. Assignment-eligible beneficiaries are those continuously enrolled in Parts A and B [while alive] with at least one qualifying service.
III. Measure of Physician-Hospital Integration
Our measure of physician-hospital integration exploited a feature of the Medicare outpatient prospective payment system to calculate a MSA-level variable based on each individual physician’s share of outpatient care billed with a hospital outpatient department (HOPD) place of service code. To calculate this, we first reclassified 2–3 percent of Medicare Carrier file claims in the office setting (place of service code = 11) as occurring in HOPD settings (place of service code = 22) annually. Specifically, we reclassified these Carrier claims when they were found to have a matching claim in the Medicare Outpatient file with a setting code indicating HOPD settings (facility type = 1 and type of service = 3). We considered claims in the two files to refer to the same patient and service if the following matched: A) beneficiary ID, service date, and procedure code, and/or B) beneficiary ID, service date +/− seven days, and NPI of the service provider. We did this in light of recurring findings by the Office of the Inspector General that physicians erroneously record the place of service as an office setting when the service was actually performed in an HOPD or ambulatory surgical center.1
We excluded non-physician NPIs and physicians with primary specialties (the most frequently billed HCFA specialty code in any given year) that were primarily inpatient-based and did not practice in outpatient settings - including anesthesiology, pathology, critical care, and emergency medicine. We identified and excluded hospitalists as any primary care specialty (internal medicine, family practice, general practice, geriatric medicine, pediatric medicine, osteopathic manipulative medicine, preventive medicine, or hospice and palliative care) for whom inpatient claims made up at least 90 percent of their allowed charges in the Medicare Carrier File.2 Finally, we excluded physicians with fewer than 15 Carrier File claims. For the remaining physicians, we counted Carrier claims by place of service (i.e., office or HOPD) at the NPI-TIN-MSA level, assigning physicians to a primary TIN-MSA combination based on the plurality of their allowed charges in any given year. (In any given year, roughly 10 percent of physicians billed more than 15 Carrier file claims under two or more TINs, and 3 percent bill in two or more MSAs.) We constructed the measure of physician-hospital integration at the NPI level as:
where i indexed physician, j indexed TIN, and m indexed MSAs. A physician was considered financially integrated with a hospital if he/she billed >=90% of outpatient services in an HOPD. Given the well-documented errors in place-of-service coding, we classified a physician as financially integrated with a hospital under two additional circumstances. First, if a physician billed primarily under a TIN identified as a hospital. To identify hospital TINs, we created a list of TINs with nine or more unique NPIs and five or more office visits in the Carrier file, for any given year. We then searched the subscription TIN database, einfinder.com, and retrieved all names associated with each TIN. We considered a TIN to be a hospital if any of its names contained at least one of the following keywords: hospital, medical center, or systems. We identified 1784 TINs as hospitals. Second, we considered a physician integrated with a hospital when billing in a large (>=10 NPIs) TIN with at least 50% of NPIs billing >=90% of outpatient services in an HOPD.
From the NPI-level share variable, we calculated a MSA-level measure as the percent of NPI-TINs billing >=90 percent (or 25, 75, 100 percent – as sensitivity analyses) of their outpatient claims with an HOPD setting code.
IV. Hospital and Physician Four-Firm Concentration Ratio
To supplement our analysis of hospital and physician concentration using the Herfindahl Hirschman Index, we also calculated a four-firm concentration ratio. This is another frequently used measure of market structure that captures the total market share of the largest four firms in a market.
V. Physician Group Specialty Mix
To supplement our analysis of physician group size, we also assessed physician group specialty mix, defined as the percent of NPIs billing under each TIN who had a primary care specialty. Primary care specialties included general practice, family practice, internal medicine, osteopathic manipulative medicine, hospice and palliative care, pediatric medicine, geriatric medicine, and preventative medicine.2 We considered a TIN to be primary care-oriented at baseline if more than half of the NPIs billing as part of it had primary care specialties during the pre-period.
VI. Irving Levin Mergers & Acquisition Database
Using the Irving Levin Associates’ Health Care Mergers and Acquisitions Database from 2008–2015, we were able to identify instances of provider consolidation directly. Specifically, for every acquired physician group, we identified the TIN(s) associated with each group name using the Employer Identification Number Database.3 This allowed us to link acquired practice names to TINs for 79.2 percent of transactions. Practices that could not be linked to a TIN were disproportionately small (1–2 physicians) and for-profit.
VII. Price Indices
We calculated a price index, designed to capture the mean prices for a basket of services in a MSA, relative to national prices. To construct this measure, we first computed the mean price for every service-MSA combination: where i indexed service (DRG or CPT code for inpatient or outpatient indices, respectively), m indexed MSA, and t indexed year. We then calculated the national mean service price over all MSAs: . For each MSA, we computed total actual spending as the number of procedures in a given service, multiplied by the MSA average price for that service, and summed over all services in the county:
. We also calculated spending as if the service had been paid at the national mean price: . The price index was then: . An index above one indicated a MSA where mean service prices paid exceeded the national mean and vice versa for an index below one. We computed price indices annually, fixing the national mean service price at the value in 2013, so that the change in the index from 2008–2013 included both variation across markets and growth in average service prices over time.
The market basket included services that represented a large share of spending in both the pre- and post-periods.4 Specifically, we included:
The top 200 DRGs by spending
The top 200 outpatient CPTs by spending
Limiting to services that met the above criteria in both the pre- and post-periods (to create a stable market basket over time), we had 171 services in the inpatient market basket and 143 services in the outpatient market basket.
VIII. Time Trend and Trend Break Analysis
For all market-level measures of consolidation and prices, we tested for time trends and a change in trends from the pre-period to the post-period, holding other market factors constant. To quantify time trends, we estimated the following model:
where m indexed MSA and t indexed year. was our claims-based measure of physician-hospital integration, average TIN size, physician HHI, hospital HHI, and market-level price index (inpatient and outpatient). was the coefficient of interest, indicating a time trend during our study period.
To quantify any break in time trends from the pre-period to the post-period, we estimated the following model:
where m indexed MSA and t indexed year. was our claims-based measure of physician-hospital integration, average TIN size, physician HHI, hospital HHI, and market-level price (inpatient and outpatient). was the coefficient of interest, indicating a time trend during the post-period that differed from the pre-period trend.
APPENDIX EXHIBIT A1.
Annual Changes in Measures of Consolidation and Prices, Pre- to Post-Period
| (1) | (2) | (3) | (4) | (5) | (6) | |
|---|---|---|---|---|---|---|
| VARIABLES | Physician-Hospital Integration | Physician HHI | Weighted Average TIN Size | Hospital HHI | Inpatient Price Index | Outpatient Price Index |
| Year | 0.01*** | 17.18*** | 4.70*** | 53.86*** | 0.04*** | 0.02*** |
| (0.00) | (4.88) | (0.99) | (9.04) | (0.00) | (0.00) | |
| Observations | 1,734 | 1,734 | 1,734 | 1,734 | 1,356 | 1,356 |
| R-squared | 0.95 | 0.98 | 0.94 | 0.98 | 0.93 | 0.98 |
| MSA FE | Yes | Yes | Yes | Yes | Yes | Yes |
| F Statistic | 110.2 | 12.40 | 22.37 | 35.49 | 933.8 | 583.8 |
Robust standard errors in parentheses
p<0.01,
p<0.05,
p<0.1
SOURCE Authors’ analysis of data from the Centers for Medicare and Medicaid and Irving Levin Associates.
NOTES All columns present results from separate between-market analyses, clustering standard errors at the MSA level. Physician’s average group size is calculated as the average count of physician billing for outpatient care within a TIN, weighting each TIN by its share of total physicians in the MSA. MSA is Metropolitan Statistical Area. TIN is Tax Identification Number. HHI is Herfindahl Hirschman Index.
APPENDIX EXHIBIT A2.
Trend Breaks in Measures of Consolidation and Prices, Pre- to Post-Period
| (1) | (2) | (3) | (4) | (5) | (6) | |
|---|---|---|---|---|---|---|
| VARIABLES | Physician-Hospital Integration | Physician HHI | Weighted Average TIN Size | Hospital HHI | Inpatient Price Index | Outpatient Price Index |
| Year | 0.011*** | 9.596 | 2.513** | 51.860*** | 0.049*** | 0.023*** |
| (0.001) | (6.343) | (1.236) | (12.018) | (0.002) | (0.001) | |
| Year*Post | 0.002** | 5.418 | 1.559* | 1.428 | −0.006*** | 0.000 |
| (0.001) | (3.828) | (0.935) | (6.539) | (0.001) | (0.001) | |
| Observations | 1,734 | 1,734 | 1,734 | 1,734 | 1,356 | 1,356 |
| R-squared | 0.948 | 0.976 | 0.941 | 0.981 | 0.927 | 0.976 |
| MSA FE | Yes | Yes | Yes | Yes | Yes | Yes |
| F Statistic | 56.62 | 6.377 | 11.31 | 17.88 | 508.2 | 292.2 |
Robust standard errors in parentheses
p<0.01,
p<0.05,
p<0.1
SOURCE Authors’ analysis of data from the Centers for Medicare and Medicaid and Irving Levin Associates.
NOTES All columns present results from separate between-market analyses, clustering standard errors at the MSA level. Physician’s average group size is calculated as the average count of physician billing for outpatient care within a TIN, weighting each TIN by its share of total physicians in the MSA. MSA is Metropolitan Statistical Area. TIN is Tax Identification Number. HHI is Herfindahl Hirschman Index.
APPENDIX EXHIBIT A3.
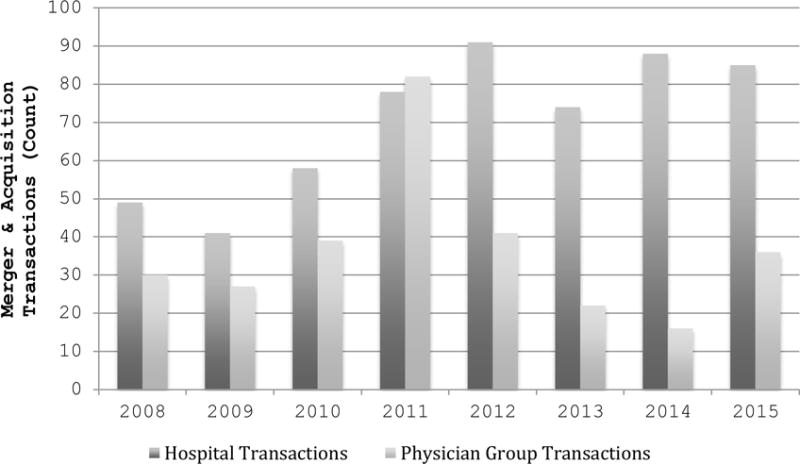
Healthcare Merger and Acquisition Count, 2008–2015
SOURCE Authors’ analysis of data from Irving Levin Associates.
APPENDIX EXHIBIT A4.
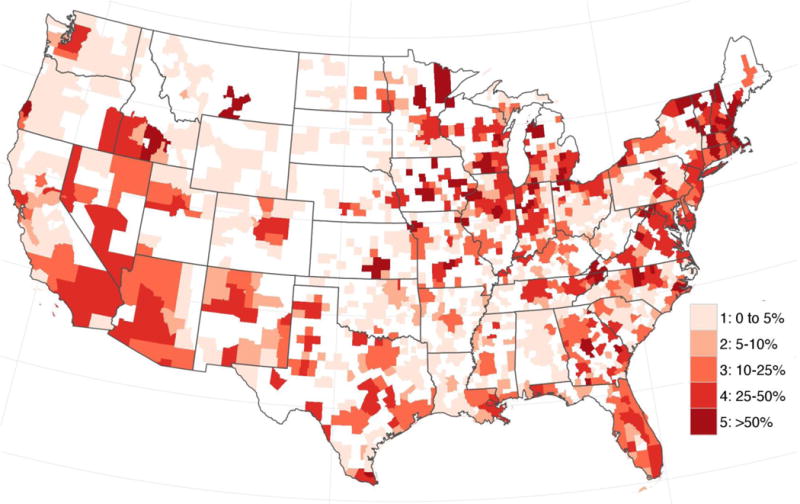
Estimated Percentage of Medicare Fee-For-Service Beneficiaries Participating in Accountable Care Organizations (ACOs), by Core-Based Statistical Area, 2014
SOURCE Authors’ analysis of data from the Centers for Medicare and Medicaid Services.
NOTES Estimated Percentage of Medicare Fee-For-Service Beneficiaries Participating in ACO is only shown for micropolitan and metropolitan statistical areas. Areas not included in either category due to small population size are blank.
IX. Main Results and Sensitivity Analyses
MSA-level regressions were of the form:
where m indexed MSA and t indexed year. was physician-hospital integration, average TIN size, Physician HHI, Hospital HHI, inpatient commercial price index, and outpatient commercial price index. was a continuous variable quantifying the percent of eligible beneficiaries enrolled in an ACO. Post was an indicator equal to one in 2011–2013. was a vector of insurance market characteristics including commercial insurance HHI, Medicare Advantage HMO share, and commercial insurance HMO share. was a vector of MSA fixed effects and was an idiosyncratic error term.
Physician- and physician group-level regressions were of the form:
where i indexed physician NPI or physician group TIN, m indexed MSA, and t indexed year. was an indicator for ownership or employment by a hospital, an indicator for merger and acquisition participation, and physician group size. was an indicator for whether the NPI ever billed Medicare Carrier File claims under a TIN with a Medicare ACO contract in 2012 or 2013. Post was an indicator equal to one in 2012 and 2013. was a vector of MSA fixed effects and was an idiosyncratic error term.
APPENDIX EXHIBIT A5.
Association Between MSA-level 2014 ACO Penetration and Provider Market Structure
| (1) | (2) | (3) | (4) | (5) | (6) | |
|---|---|---|---|---|---|---|
| VARIABLES | Physician-Hospital Integration | Physician HHI | Weighted Average TIN Size | Hospital HHI | Inpatient Price Index | Outpatient Price Index |
| Post | 0.04*** | 28.75 | 6.44 | 154.24*** | 0.11*** | 0.06*** |
| (0.01) | (24.18) | (6.23) | (35.93) | (0.01) | (0.01) | |
| Post*ACOpenetration2014 | −0.02 | 130.68 | 27.02 | −143.73 | −0.04 | 0.03 |
| (0.02) | (72.53) | (17.68) | (125.43) | (0.02) | (0.01) | |
| Insurance HHI | −0.00 | 0.02 | −0.00 | −0.06 | 0.00 | 0.00 |
| (0.00) | (0.02) | (0.00) | (0.04) | (0.00) | (0.00) | |
| MA HMO Share | −0.11 | 155.24 | 38.00 | 584.89 | 0.50* | −0.01 |
| (0.08) | (273.28) | (59.46) | (1,118.46) | (0.20) | (0.09) | |
| Commercial HMO Share | −0.09* | −37.08 | −42.44 | −643.11* | −0.26*** | −0.14* |
| (0.04) | (214.58) | (34.03) | (323.17) | (0.07) | (0.05) | |
| Observations | 1,734 | 1,734 | 1,734 | 1,734 | 1,356 | 1,356 |
| R-squared | 0.95 | 0.98 | 0.94 | 0.98 | 0.88 | 0.97 |
| MSA FE | Yes | Yes | Yes | Yes | Yes | Yes |
| F Statistic | 21.31 | 4.251 | 5.676 | 7.069 | 128.6 | 129.0 |
Robust standard errors in parentheses
p<0.001,
p<0.01,
p<0.05
SOURCE Authors’ analysis of data from the Centers for Medicare and Medicaid and Irving Levin Associates.
NOTES All columns are the results of separate between-market analyses, clustering standard errors at the MSA level. Physician’s average group size is calculated as the average count of physicians billing for outpatient care within a TIN, weighting each TIN by its share of total physicians in the MSA. MSA is Metropolitan Statistical Areas. ACO is Accountable Care Organization. HMO is Health Maintenance Organization. HHI is Herfindahl Hirschman Index.
APPENDIX EXHIBIT A6.
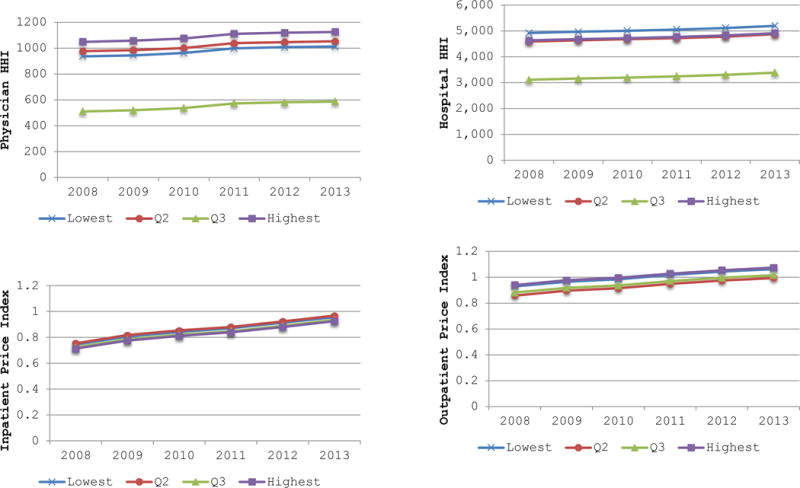
Provider Market Structure by Quartile of 2014 ACO Penetration, 2008–2013
SOURCE Authors’ analysis of data from the Centers for Medicare and Medicaid, the American Hospital Association, and Irving Levin Associates.
NOTES All panels result from separate between-market analyses, presenting the average annual value of the dependent variable, by quartile of 2014 ACO penetration. Physician’s average group size was calculated as the average count of physicians billing for outpatient care within a TIN, weighting each TIN by its share of total physicians in the MSA. ACO is Accountable Care Organization. HHI is Herfindahl Hirschman Index.
APPENDIX EXHIBIT A7.
Association between ACO Participation (2012, 2013, or 2014) and Physician-Hospital Integration and Physician Group Acquisition
| (1) | (2) | |
|---|---|---|
| VARIABLES | Financially Integrated with a Hospital | Acquired |
| ACOparticipant | 0.033 | 0.002 |
| (0.024) | (0.002) | |
| Post | 0.024*** | 0.001 |
| (0.003) | (0.001) | |
| ACOparticipant*Post | 0.011 | −0.002 |
| (0.009) | (0.003) | |
| Observations | 1,729,494 | 1,729,494 |
| R-squared | 0.112 | 0.014 |
| MSA FE | Yes | Yes |
| F Statistic | 23.15 | 1.064 |
Robust standard errors in parentheses
p<0.001,
p<0.01,
p<0.05
SOURCE Authors’ analysis of data from the Centers for Medicare and Medicaid and Irving Levin Associates.
NOTES Separate within-market analyses clustered standard errors at the MSA-level. Percent of physicians acquired was calculated as the share of physicians billing under a TIN that was identified as the target of a merger or acquisition in any given year. ACO is Accountable Care Organization. MSA is Metropolitan Statistical Area.
APPENDIX EXHIBIT A8.
Association between ACO participation (2012, 2013, or 2014) and Physician Group Size
| (1) | |
|---|---|
| VARIABLES | TIN Size |
| ACOparticipant | 61.31** |
| (19.77) | |
| Post | 7.93*** |
| (1.62) | |
| ACOparticipant*Post | 11.40** |
| (3.65) | |
| Observations | 569,955 |
| R-squared | 0.43 |
| MSA FE | Yes |
| F Statistic | 25.00 |
Robust standard errors in parentheses
p<0.001,
p<0.01,
p<0.05
SOURCE Authors’ analysis of data from the Centers for Medicare and Medicaid.
NOTES Within-market analyses clustered standard errors at the MSA-level. ACO is Accountable Care Organization. TIN is Tax Identification Number. MSA is Metropolitan Statistical Area.
APPENDIX EXHIBIT A9.
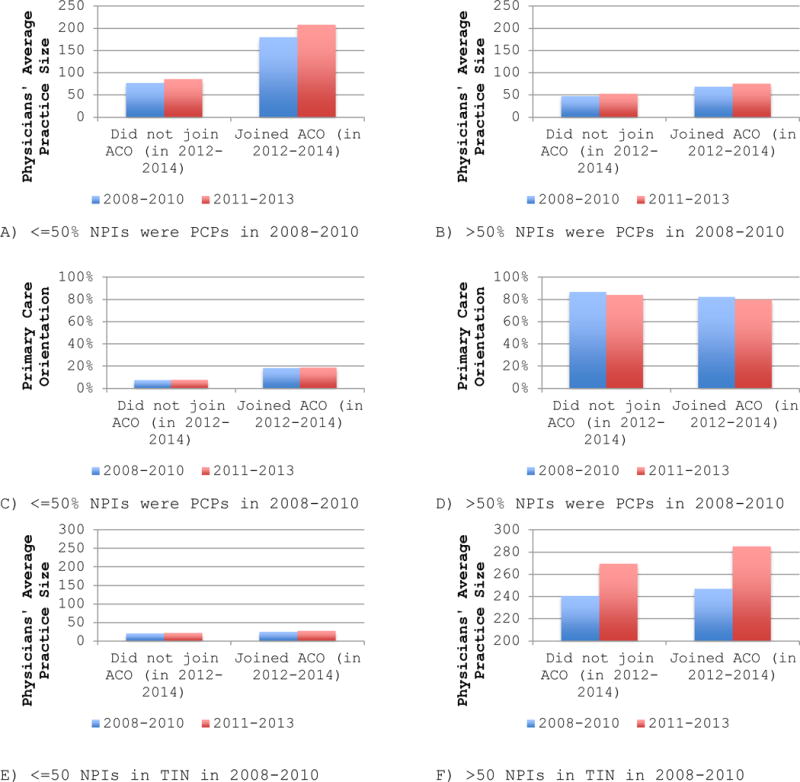
Physician Group Size by 2014 ACO Participation, 2008–2013, Stratified by Baseline Primary Care Orientation and Baseline Size
SOURCE Authors’ analysis of data from the Centers for Medicare and Medicaid.
NOTES All panels result from separate within-market analyses, presenting the average pre- and post-period value of the dependent variable, by 2012, 2013, or 2014 ACO participation. Physician’s average group size was calculated as the average count of physician billing for outpatient care within a TIN, weighting each TIN by its share of total physicians in the MSA. Primary care orientation was calculated as the share of physicians billing under a TIN with a primary care specialty. ACO is Accountable Care Organization.
- 1.Review of Place-of-Service Coding for Physician Services Processed by Medicare Part B Contractors During Calendar Year 2009. Offic of the Inspector General, Department of Health and Human Services; 2011. pp. 1–21. [Google Scholar]
- 2.Welch WP, Cuellar AE, Stearns SC, Bindman AB. Proportion Of Physicians In Large Group Practices Continued To Grow In 2009–11. Health Affairs. 2013;32(9):1659–1666. doi: 10.1377/hlthaff.2012.1256. [DOI] [PubMed] [Google Scholar]
- 3.Employer Identification Number Database. http://www.einfinder.com.
- 4.Neprash HT, Wallace JC, Chernew ME, McWilliams JM. Measuring Prices in Health Care Markets Using Commercial Claims Data. Health Services Research. 2015;50(6) doi: 10.1111/1475-6773.12304. [DOI] [PMC free article] [PubMed] [Google Scholar]
References
- 1.Shatto JD. Center for Medicare and Medicaid Innovation’s Methodology and Calculations for the 2016 Estimate of Fee-for-Service Payments to Alternative Payment Models. 2016 https://innovation.cms.gov/Files/x/ffs-apm-goalmemo.pdf.
- 2.HHS. New hospitals and health care providers join successful, cutting-edge federal initiative that cuts costs and puts patients at the center of their care. 2016 Jan; http://www.hhs.gov/about/news/2016/01/11/new-hospitals-and-health-care-providers-join-successful-cutting-edge-federal-initiative.html.
- 3.McWilliams JM, Hatfield LA, Chernew ME, Landon BE, Schwartz AL. Early Performance of Accountable Care Organizations in Medicare. New England Journal of Medicine. 2016;374(24):2357–2366. doi: 10.1056/NEJMsa1600142. [DOI] [PMC free article] [PubMed] [Google Scholar]
- 4.Muhlestein DB. Growth and Dispersion of Accountable Care Organizations, 2015. Health Affairs Blog. 2015 Mar; http://healthaffairs.org/blog/2015/03/31/growth-and-dispersion-of-accountable-care-organizations-in-2015-2/
- 5.Kocher R, Sahni NR. Hospitals’ race to employ physicians–the logic behind a money-losing proposition. NEJM. 2011;364(19):1790–1793. doi: 10.1056/NEJMp1101959. [DOI] [PubMed] [Google Scholar]
- 6.Baicker K, Levy H. Coordination versus competition in health care reform. NEJM. 2013;369(9):789–791. doi: 10.1056/NEJMp1306268. [DOI] [PMC free article] [PubMed] [Google Scholar]
- 7.Gaynor M, Town R. The Impact of Hospital Consolidation—Update The Synthesis Project - Robert Wood Johnson Foundation. 2012 [Google Scholar]
- 8.Baker LC, Bundorf MK, Royalty AB, Levin Z. Physician Practice Competition and Prices Paid by Private Insurers for Office Visits. JAMA. 2014;312(16):1653. doi: 10.1001/jama.2014.10921. [DOI] [PubMed] [Google Scholar]
- 9.Dunn A, Shapiro AH. Do Physicians Possess Market Power? Journal of Law and Economics. 2014;57:159–193. [Google Scholar]
- 10.Neprash HT, Chernew ME, Hicks AL, Gibson T, McWilliams JM. Association of Financial Integration Between Physicians and Hospitals With Commercial Health Care Prices. JAMA Internal Medicine. 2015;175(12):1932. doi: 10.1001/jamainternmed.2015.4610. [DOI] [PubMed] [Google Scholar]
- 11.Baker LC, Bundorf MK, Kessler DP. Vertical Integration: Hospital Ownership Of Physician Practices Is Associated With Higher Prices And Spending. Health Affairs. 2014;33(5):756–763. doi: 10.1377/hlthaff.2013.1279. [DOI] [PubMed] [Google Scholar]
- 12.Song Z, Wallace J, Neprash H, McKellar MR, Chernew M, McWilliams JM. Medicare Fee Cuts and Cardiologist-Hospital Integration. JAMA Internal Medicine. 2015;175(7) doi: 10.1001/jamainternmed.2015.2017. [DOI] [PMC free article] [PubMed] [Google Scholar]
- 13.Pear R. Consumer Risks Feared as Health Law Spurs Mergers. New York Times. 2010 Nov 20; [Google Scholar]
- 14.Mathews AW. Health-Care Providers, Insurers Supersize. The Wall Street Journal. 2015 Sep 21; [Google Scholar]
- 15.Rittenhouse DR, Shortell SM, Gillies RR, et al. Improving Chronic Illness Care: Findings From a National Study of Care Management Processes in Large Physician Practices. Medical Care Research and Review. 2010;67(3):301–320. doi: 10.1177/1077558709353324. [DOI] [PubMed] [Google Scholar]
- 16.Rittenhouse DR, Casalino LP, Shortell SM, et al. Small And Medium-Size Physician Practices Use Few Patient-Centered Medical Home Processes. Health Affairs. 2011;30(8):1575–1584. doi: 10.1377/hlthaff.2010.1210. [DOI] [PubMed] [Google Scholar]
- 17.Crespin DJ, Christianson JB, McCullough JS, Finch MD. Health System Consolidation and Diabetes Care Performance at Ambulatory Clinics. Health Services Research. 2016 Feb; doi: 10.1111/1475-6773.12450. [DOI] [PMC free article] [PubMed] [Google Scholar]
- 18.McWilliams JM. Delivery System Integration and Health Care Spending and Quality for Medicare BeneficiariesMedicare Integration, Spending, and Quality. JAMA Internal Medicine. 2013 Jun;:1. doi: 10.1001/jamainternmed.2013.6886. [DOI] [PMC free article] [PubMed] [Google Scholar]
- 19.Casalino LP, Pesko MF, Ryan AM, et al. Small Primary Care Physician Practices Have Low Rates Of Preventable Hospital Admissions. Health Affairs. 2014;33(9):1680–1688. doi: 10.1377/hlthaff.2014.0434. [DOI] [PubMed] [Google Scholar]
- 20.Mehrotra A, Epstein AM, Rosenthal MB. Do integrated medical groups provide higher-quality medical care than individual practice associations? Annals of Internal Medicine. 2006;145(11):826–833. doi: 10.7326/0003-4819-145-11-200612050-00007. [DOI] [PubMed] [Google Scholar]
- 21.Baker LC, Bundorf MK, Kessler DP. The Effect of Hospital/Physician Integration on Hospital Choice. NBER Working Paper Series. 2015 Aug;:1–26. [Google Scholar]
- 22.McWilliams JM. Changes in Medicare Shared Savings Program Savings from 2013 to 2014. JAMA. doi: 10.1001/jama.2016.12049. Published online September 09, 2016. [DOI] [PMC free article] [PubMed] [Google Scholar]
- 23.Song Z, Rose S, Safran DG, Landon BE, Day MP, Chernew ME. Changes in Health Care Spending and Quality 4 Years into Global Payment. NEJM. 2014;371(18):1704–1714. doi: 10.1056/NEJMsa1404026. [DOI] [PMC free article] [PubMed] [Google Scholar]
- 24.Colla CH, Lewis VA, Tierney E, Muhlestein DB. Hospitals Participating In ACOs Tend To Be Large And Urban, Allowing Access To Capital And Data. Health Affairs. 2016;35(3):431–439. doi: 10.1377/hlthaff.2015.0919. [DOI] [PMC free article] [PubMed] [Google Scholar]
- 25.To access the Appendix, click on the Appendix link in the box to the right of the article online.
- 26.Shared Savings Program Accountable Care Organizations (ACO) Provider-Level RIF. Research Data Assistance Center; http://www.resdac.org/cms-data/files/ssp-aco-provider-level-rif Accessed May 9, 2016. [Google Scholar]
- 27.MedPAC. Medicare payment differences across ambulatory settings. Report to the Congress Medicare and the Health Care Delivery System. 2013:1–32. [Google Scholar]
- 28.Health Care Services Acquisition Report. https://products.levinassociates.com/downloads/2016-health-care-services-acquisition-report-22nd-edition/