Abstract
In this paper, we introduce an algorithm framework for the automation of interferometric synthetic aperture microscopy (ISAM). Under this framework, common processing steps such as dispersion correction, Fourier domain resampling, and computational adaptive optics aberration correction are carried out as metrics-assisted parameter search problems. We further present the results of this algorithm applied to phantom and biological tissue samples and compare with manually adjusted results. With the automated algorithm, near-optimal ISAM reconstruction can be achieved without manual adjustment. At the same time, the technical barrier for the non-expert using ISAM imaging is also significantly lowered.
1. INTRODUCTION
Interferometric synthetic aperture microscopy (ISAM) [1–4] is an imaging modality that applies the solution to the inverse problem to data sets collected from optical coherence tomography (OCT) [5–7] to achieve focal-plane transverse resolution throughout the image. ISAM has been validated with histological sections [2] and demonstrated in real time [3,4].
In OCT, nonidealities, such as an imbalance of dispersion between the sample arm and the reference arm and the aberration caused by the objective lenses and the sample itself, cause a degradation in the resolution in the axial and transverse directions. Methods such as dispersion correction [8,9] and computational adaptive optics (CAO) [10,11] have been developed to address these issues. These procedures have been incorporated by the ISAM community into standard operating procedures for data processing and image reconstruction. However, to perform such an ISAM image reconstruction, manual selection and tuning of parameters such as the second- and third-order dispersion correction parameters, the focal plane depth, and the various weightings of each mode of dispersion correction are needed. This parameter tuning process is labor intensive, and optimal results cannot be guaranteed. In this paper, we present the theory and experimental results of a metrics-assisted parameter search method that enables automation of the whole process and achieves robust and near-optimal ISAM reconstructions. These results save numerous hours of labor and lower the technical barriers to ISAM imaging.
2. METRICS-ASSISTED ISAM
A. Background
A typical OCT data set S̃OCT(r||, k0) consists of an array of interference spectra measured at thousands of linearly spaced wavenumbers, k0, for each transverse scanning position r||. It is related to the spatial OCT reconstruction SOCT(r||, z) via a Fourier transform in the k0 dimension and related to the plane-wave decomposition via a two-dimensional Fourier transform in the r|| dimensions. In the following subsections, in order to improve the readability of the equations, data sets with the same subscript are, by default, equivalent under a Fourier transform of the corresponding dimensions, e.g.,
| (1) |
and
| (2) |
B. Spatial and Frequency Domain Metrics
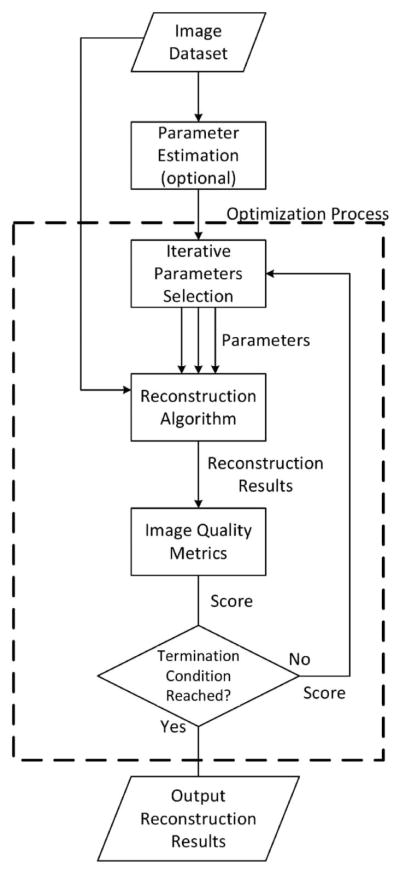
In an ISAM imaging system, the reconstruction algorithm can be divided into three stages: dispersion correction, Fourier re-sampling, and computational adaptive optics correction. Each stage requires some system parameters to be passed into the algorithm. Any deviation from the optimal value of the parameters will result in blurring effects or other artifacts in the image. To automate the process, we treat each stage as a parameter-search problem. We utilize image quality metrics to assign scores at each stage to measure the sharpness in corresponding dimensions for any possible combinations of parameters in the parameter space, so that each parameter-search problem is converted into an optimization problem. The process is described by the flowchart in Fig. 1. The sharpness metrics can be selected from or be a weighted combination of the metrics introduced below.
Fig. 1.
General description of the optimization process at each stage.
In this paper, we introduce and compare multiple metrics, which can be categorized into two classes, spatial-domain metrics and frequency-domain metrics.
For spatial-domain metrics, we focus on metrics that take the p-norm of the image amplitude,
| (3) |
where Sα1,…,αn(r||, z) represents the spatial image generated at some stage with parameter set (α1, …, αn), and p can take on a variety of values.
In the special case of p = ∞, it becomes the maximum-intensity metric, which takes the maximum intensity of the image,
| (4) |
The maximum-intensity metric is based on the intuition that, when appropriate parameters are passed in at each stage, the phase and/or directions of the plane waves become well aligned, thus creating strong constructive interference [10], resulting in high-intensity voxels and sharp images. An alternative metric with a similar intuition behind it is the image-power metric, where p = 2 [12].
In the special case of p = 0, with the addition of a thresholding process, it becomes the sparsity metric, which counts the number of voxels with an intensity higher than the noise level,
| (5) |
where Th(·, μ0) is the thresholding function with a cutoff μ0. The cutoff is set slightly higher than the noise floor of the image so that the metric can reflect the number of voxels occupied by the sparse content of the sample. The metric should reach a minimum when all blurring effects are corrected for.
When 1 ≤ p < ∞, the characteristics of the p-norm metrics transit smoothly between the two extremes.
The other class of metrics are the frequency-domain metrics. Based on the hypothesis that better images contain more high-spatial-frequency components than a blurry version of the same image, we may make use of a metric that measures high-spatial-frequency components in certain dimensions of the image. This metric takes on different forms depending on which dimensions are of concern. Below shows an example that focuses on the axial (z-directional) high-spatial-frequency components,
| (6) |
where a weighted p-norm of the spatial frequency components in the z direction is calculated, with a weighting, w(kz), that places emphasis on high axial spatial frequencies.
From our observations, each metric has its own pros and cons, which will be discussed in detail in Section 5.
C. Dispersion Correction
As the OCT setup inevitably contains some amount of imbalance in the dispersion between the sample arm and the reference arm, each wavelength component in the optical spectrum sees a small amount of change in the refractive index in the system. This effect causes a slowly varying phase shift ϕ(k0) in the data set S̃(r||, k0) along the wavenumber direction,
| (7) |
where k0 denotes the wavenumber coordinate, and S̃ideal(x, y, k0) refers to the ideal OCT data set that contains no dispersion mismatch. Equivalently in the spatial domain, this effect causes a convolution in the z direction, resulting in a lowered axial resolution,
| (8) |
which is a convolution in z with the spreading function hspread(z) = ∫ eik0z+iϕ(k0) dk0.
To correct this dispersion, one needs to determine the parameters that cancel out the second-order (group velocity dispersion) and the third-order components [9],
| (9) |
where kc is the point around which the Taylor series expansion is performed, usually the center point of the wavenumber space k0. This is a time-consuming process and requires considerable experience. Although it is possible to measure and store the dispersion-correction parameters of the OCT setup in the system, they may change as a result of displacement of the optical elements, stress on the optical fiber, or whether there is a cover glass on top of the sample. Thus, OCT systems with stored dispersion correction parameters still require frequent calibration.
In this stage, we adopt the method from [9] into our framework and extend it to work with multiple classes of metrics and optimization methods for different classes of images. The goal is to find the optimal combination of parameters (β2, β3) so that the dispersion correction produces the sharpest results in the axial (z) direction. The optimization problem is formulated as
| (10) |
where M( ) can be any one or a linear combination of the aforementioned sharpness metrics. The optimization methods will be discussed in detail in Section 3.
For volumetric data sets from high-resolution, transversely oversampled, large-field-of-view OCT systems, the amount of data could cause the parameter search to converge slowly. To address this issue, we propose down-sampling along the transverse dimensions prior to the parameter search. Since, in this stage, the sharpness in the axial direction is the main concern, down-sampling in the transverse dimensions has very little effect on the accuracy of the parameter search. After the parameter search is finished, the estimated parameters can then be applied to the full data set for dispersion correction.
D. Fourier Resampling
The most important step of ISAM is the Fourier-domain re-sampling, which brings the whole image into focus,
| (11) |
In this step, the depth of the focal plane zf is needed as a parameter.
Optimization over a large range of zf can be computationally expensive. So, before performing the optimization step, we propose estimating the focal plane depth first according to a sharpness–brightness score, Q(z), at each depth, produced by the transverse sharpness metrics, e.g., the high-spatial-frequency metrics,
| (12) |
where, again, w(k||) is a weighting that places emphasis on high transverse spatial frequencies. Here, we utilize the fact that the OCT image at the focal plane is sharper and brighter than the out-of-focus part, so the score Q(z) will peak near the focal plane depth ẑf . With this estimate, the range of optimization can be narrowed down to several Rayleigh ranges (zR) around the peak of Q(z). The optimization problem is then,
| (13) |
It is worth mentioning that, during the ISAM resampling step, where the data need to be circularly shifted vertically by zf pixels, instead of circularly shifting the matrix, the Fourier shift theorem can be used to handle noninteger zf values, thus enabling finer granularity in this step. Similar to the previous step, four types of metrics can be used. The high-transverse-spatial-frequency metric should quantify the sharpness in transverse (r||) directions instead of the axial (z) direction,
| (14) |
while the sparsity metrics, maximum-intensity metrics, and image-power metrics do not need to be changed since they measure the sharpness in all dimensions.
E. Aberration Correction
The final stage is aberration correction using computational adaptive optics [10,13–15]. Because of the aberration of the lens, the roughness of the sample surface, and the lens effect from refractive index variations in tissue, the wavefront of each plane-wave component of the scanning beam may become misaligned and thus form an imperfect focal spot. As a result, the resulting ISAM images may have an imperfect point-spread function. Common optical aberrations that appear in the ISAM images include astigmatism, coma, and third-order spherical aberration. OCT data sets that contain aberration can be modeled [10] by
| (15) |
where zn(k||) are the Zernike polynomials corresponding to each type of common aberration, labeled by number n, and wn describes the amount of the corresponding aberration. Note that wn in general can be different for each depth z0. Such aberrations cause blurring effects, such as spreading, tailing, and ringing in the transverse direction.
To correct for optical aberrations in the ISAM images, it is desirable to find out the proper weightings ŵn ≈ wn for each depth z0 and to cancel out the multiplicative phase term,
| (16) |
Without automation, the method of achieving this is to manually adjust each parameter ŵn until the image appears sharp by the user’s observation. This again is a repetitious and time-consuming process.
This process can be converted into the following optimization problem [10]:
| (17) |
The above-mentioned multidimensional optimization problem can be very expensive to solve using current computational power. So, based on the characteristics of each type of aberration, we categorize them into several semi-independent groups, as can be seen in Table 1 [16], where (ρk, θk) is the polar form of the (kx , ky) coordinates.
Table 1.
Common Types of Aberration in OCT
| Group | Label | Aberrations | Zernike Polynomials | |
|---|---|---|---|---|
| I | 1 | Astigmatism |
|
|
| 2 | Astigmatism |
|
||
| 3 | Defocus |
|
||
| II | 4 | Coma |
|
|
| 5 | Coma |
|
||
| III | 6 | Spherical |
|
|
| 7 | Defocus |
|
The optimization problem can then be divided into multiple steps with fewer dimensions within each stage. The first step is
| (18) |
The data set is then updated using the estimation ŵ1,…, ŵ3 from this stage,
| (19) |
The second step estimates ŵ4 and ŵ5 based on and then updates the data set again using ŵ4 and ŵ5 to produce . Similarly, the third step estimates ŵ6 and ŵ7 based on and then updates the data set again using ŵ6 and ŵ7 to produce the final results .
Since this step is performed plane by plane, all four metrics should be modified for proper dimensionality, i.e., for each plane z = z0,
| (20) |
| (21) |
| (22) |
and
| (23) |
3. MULTIDIMENSIONAL OPTIMIZATION
The previous section has established three optimization problems for the three stages of automated ISAM processing. For each of them, a variety of methods can be chosen to find the maximum or the minimum point, depending on the speed and accuracy requirements of the system.
The simplest and most robust of all the methods is the exhaustive grid search. An optimization problem with k parameters to determine,
| (24) |
can be implemented by k nested for loops in nonvectorized languages such as C/C++, Python, and Java to calculate the scores M(Sα1,…,αk) for each of the possible combinations of α1, …, αk within a certain boundary. The parameter combination corresponding to the maximum score is the optimal parameter set for this optimization problem. With an appropriate boundary set for each parameter, this method is guaranteed to find the global maximum (or minimum). But, on the other hand, this method is relatively slow and scales badly as the number of parameters k increase (O(nk)).
Another method that can be used is the gradient descent (or ascent) algorithm. The algorithm starts with a set of initial values, e.g., 0,
| (25) |
and iteratively updates them toward the local minimum (or maximum) along its local gradient,
| (26) |
where denotes the value of the kth parameter at the nth iteration, μ is a parameter that controls the rate of change, and the operator ∇ takes the gradient of M(Sα1,…,αk) along α1, …, αk dimensions. A smaller μ generally leads to a higher probability of convergence and a slower rate of convergence, and vice versa. In discrete arithmetic, the updating formula for each parameter can be implemented as
| (27) |
where δ is the step size for the finite difference. When the parameters, as well as the value of the objective function change little (depending on the precision requirement, e.g., less than 1%) in the few most recent iterations, convergence is reached, and the iteration process can be stopped. Gradient descent requires the objective function to be smooth and convex, otherwise it is possible that the parameters will converge at some local minimum (or maximum) instead of the global one. Converging at a local minimum will result in suboptimal reconstruction quality and may further affect the accuracy in the subsequent stages. Gradient descent is, in general, faster than grid search and scales linearly as the number of parameters, k, increases.
The above are just two simple examples of optimization techniques that can be used in solving this problem. More advanced techniques, such as simulated annealing, can be used to achieve higher robustness or speed. Cascaded procedures, such as a grid search on a coarse-grained grid followed by a gradient descent near each local maximum, may also help improve the robustness and speed.
4. IMPLEMENTATION AND RESULTS
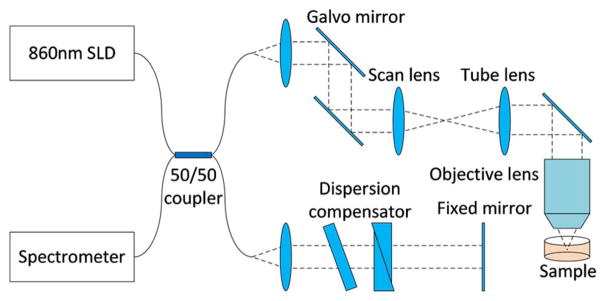
The algorithm was implemented in MATLAB using a workstation equipped with an Intel Xeon E3-1225v3 3.2 GHz Quad-core CPU. OCT data sets of a subresolution phantom (TiO2 particles) and human palm skin tissue were taken from the spectral domain OCT setup shown in Fig. 2. The system uses a superluminescent diode (SLD) light source centered at 860 nm, with a bandwidth of approximately 80 nm. The light is focused by a 0.6 NA objective lens forming a theoretical focal spot radius of 0.46 μm and a theoretical Rayleigh length of 0.8 μm in air, computed from the numerical aperture of the lens.
Fig. 2.
Schematic of the spectral domain OCT system used for collecting the data sets.
A. Results on Particle Phantom
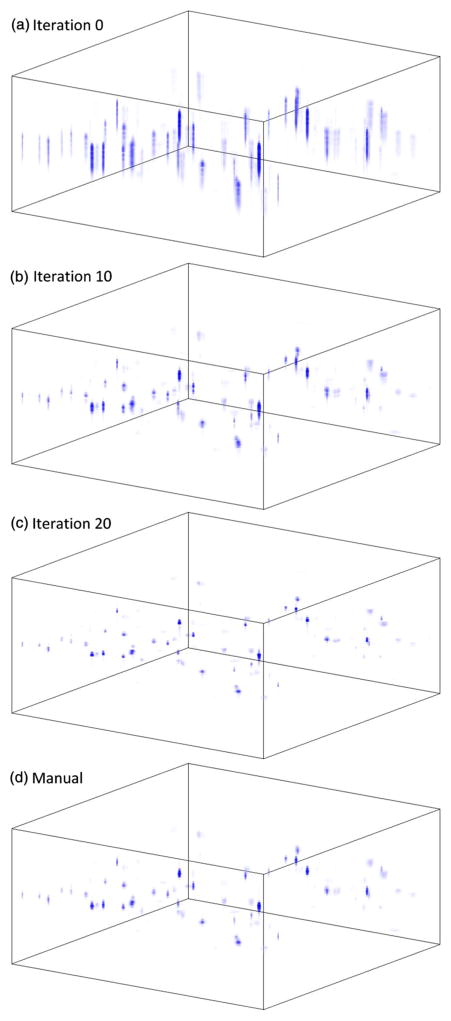
The algorithm was first validated using the particle phantom data set. The data set was first normalized according to the power spectrum and interpolated onto linear wavenumber grids. Then, an automated dispersion correction was performed on the data set using the gradient descent method. The effect at the start and at various iterations are shown in Figs. 3(a)–3(c), and the manual tuning result is shown in Fig. 3(d). The automated optimization procedure takes only 12 iterations to reduce the dispersion to a level comparable to manual tuning. The algorithm finally reached the optimum state at around iteration 20, where the vertical resolution reached its optimum.
Fig. 3.
(a) Volumetric plot of the raw OCT image in spatial domain before dispersion correction; (b) and (c) OCT image after 10 and 20 iterations of automated dispersion correction; (d) Manually tuned dispersion corrected data set.
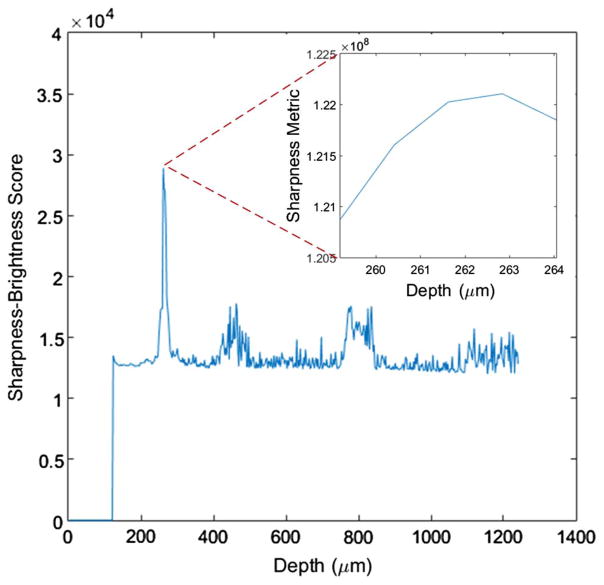
After the automated dispersion correction, the algorithm estimates the focal depth using the sharpness–brightness score computed for each depth. Note that any possible bright reflector, such as the cover slip on top of the sample, is removed from the data. The sharpness–brightness score for this data set is plotted in Fig. 4 and peaks at a depth of 261.6 μm.
Fig. 4.
Sharpness–brightness score of the sample for each depth; the inset plots the sharpness metric output for the finer focal plane depth search process.
Following the focal plane estimation is the fine grain optimization step, where the algorithm tries various focal plane depths within several Rayleigh lengths around the estimated depth. The results are shown in the inset of Fig. 4. For this data set, the optimum focal plane depth is 262.8 μm. With this optimum focal plane depth, the algorithm performs ISAM resampling.
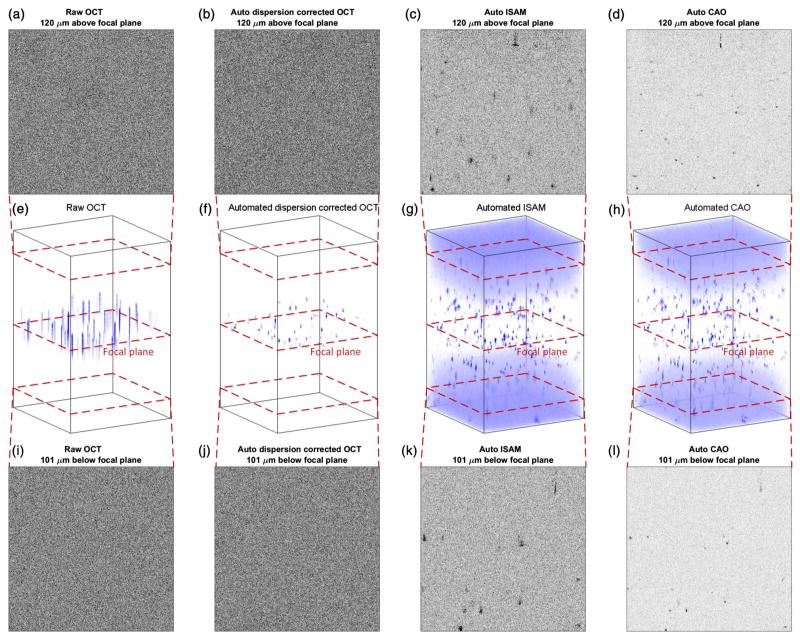
Finally, after ISAM resampling, the algorithm performs the automated computational adaptive optics for aberration correction. For each depth, the algorithm performs the three stages of aberration correction described in Section 2.C. Figure 5 shows a comparison of the raw OCT image, the image after automated ISAM resampling, and the image after automated computational adaptive optics in 3D volumetric rendering. Two en face planes far from the focal plane are displayed for each stage. It can be observed that the automated ISAM resampling significantly extends the depth of field, therefore many particle scatterers far from the focus show up clearly. Away from the focal plane, the signal-to-noise ratio (SNR) decreases linearly with distance [17], and the noise gradually shows up as the clouds at the top and bottom parts of the volumetric rendering. If a series of en face planes farther away from the focal plane were depicted, the point scatterers in the image would gradually be submerged under the rising noise floor. At this stage, the depth of imaging is no longer bounded by the depth of field of the imaging system. Instead, it is bounded by the decaying SNR. With the help of the automated aberration correction, the usable depth of imaging extends farther, and sharp and clean information is extracted from regions that were originally submerged in noise.
Fig. 5.
Panels (a)–(d) show an en face plane 120 μm above the focal plane during each stage of processing. Panels (e)–(h) show a volumetric rendering of the 3D particle phantom data set during each stage of processing. Panels (i)–(l) show an en face plane 101 μm below the focal plane during each stage of processing.
B. Results on Human Palm Tissue
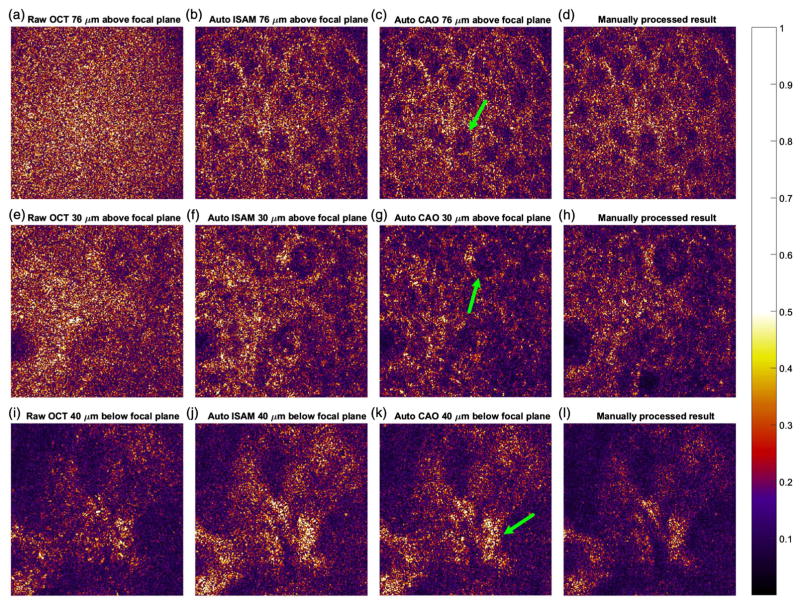
The algorithm was then tested on a data set taken using in vivo human palm skin tissue (also used in [18]). Since this data set came with matched dispersion, the automated dispersion correction selected α2 = α3 = 0 as the dispersion correction parameters. The algorithm then estimated and optimized the focal plane depth and selected 192.3 μm. With this parameter, ISAM was performed on the data set. Automated CAO was then performed on the data set layer by layer. Figure 6 shows a matrix of en face images from the raw OCT data, automated ISAM results, and the automated CAO results for the various layers reported in [18]. Figures 6(a)–6(c) show the epidermis layer 171 Rayleigh lengths away from the focal plane, with the nuclei of a granular cell labeled with the arrow. Figures 6(e)–6(g) show the superficial dermis layer 67 Rayleigh lengths away from the focal plane, with a dermal papillae labeled with the arrow. Figures 6(i)–6(k) show the structure deep in the dermis 90 Rayleigh lengths away from the focal plane, with probable collagen fiber bundles labeled with the arrow. Figures 6(d), 6(h), and 6(i) are the manually processed images of the same data set at similar depths, reproduced with authorization from the authors of [18]. Note that because of some difference in the method of data processing, the images produced by the automated algorithm and by manual tuning may not correspond to the exact same slice. However, the difference should be minimal. Compared to the manually fine-tuned images, it can be seen that the automated algorithm is able to achieve a similar performance as an experienced researcher on a highly complicated biological sample.
Fig. 6.
(a)–(c) En face plane 76 μm above the focal plane at each stage. (e)–(g) En face plane 30 μm above the focal plane at each stage. (i)–(k) En face plane 40 μm below the focal plane at each stage. (d), (h), and (i) are the reproduced manually processed results of the same data set at similar depths, previously published in [18].
5. DISCUSSION AND CONCLUSION
The algorithm described in this paper is a general framework for the automation of ISAM data processing. Many modifications can be made when implementing it for certain applications. For example, for systems with relatively slowly varying dispersion, the optimization process for dispersion correction (e.g., gradient descent) can start from the optimum value of the previous data set, instead of zero, which should take much fewer iterations to converge. This algorithm, with slight modification, can also be used for multifocal interferometric synthetic aperture microscopy (MISAM) [17] and polarization-sensitive interferometric synthetic aperture microscopy (PS-ISAM) [19].
From our observations, the performance of each type of metric varies with the types of samples that are being processed. We summarize our observations in Table 2. The runtime in MATLAB for each data set is 20–30 min. If implemented with a highly parallel processing unit, for instance, a GPU [4], using programming languages such as CUDA, we estimate the runtime to be within 2–3 min, according to the speed-up seen in similar applications. If performed manually, we estimate the workload for each data set to be 8–16 h for an experienced person.
Table 2.
Comparison of Different Types of Metrics
| Sample\Metrics | Maximum Intensity | Image Power | Sparsity | High Spatial Frequency |
|---|---|---|---|---|
| Particle phantom | Good | Good | Good | Good |
| Biological tissue | Poor | Good | Intermediate | Good |
| Computational cost | Low | Intermediate | Intermediate | High |
In this paper, we have presented an algorithm framework that automates the processing of dispersion correction, ISAM resampling, and computational adaptive optics to achieve near-optimal reconstruction. We tested the algorithm on a particle phantom data set and an in vivo human palm skin tissue data set and achieved results comparable to images manually adjusted by an experienced researcher. This algorithm significantly lowers the technical barrier for a nonexpert to utilize ISAM imaging technology and saves hours of processing time for each ISAM data set.
Acknowledgments
Funding. National Institutes of Health (NIH) (1 R01 CA166309); National Science Foundation (NSF) (CBET 14-03660); Howard Hughes Medical Institute (HHMI) International Student Research Fellowship; National Cancer Institute (NCI), National Institutes of Health, Department of Health and Human Services (HHSN261201400044C).
Footnotes
OCIS codes: (110.4500) Optical coherence tomography; (100.3175) Interferometric imaging; (110.1758) Computational imaging; (100.0100) Image processing.
References
- 1.Davis BJ, Schlachter SC, Marks DL, Ralston TS, Boppart SA, Carney PS. Nonparaxial vector-field modeling of optical coherence tomography and interferometric synthetic aperture microscopy. J Opt Soc Am A. 2007;24:2527–2542. doi: 10.1364/josaa.24.002527. [DOI] [PubMed] [Google Scholar]
- 2.Ralston TS, Marks DL, Carney PS, Boppart SA. Interferometric synthetic aperture microscopy. Nat Phys. 2007;3:129–134. doi: 10.1038/nphys514. [DOI] [PMC free article] [PubMed] [Google Scholar]
- 3.Ralston TS, Marks DL, Carney PS, Boppart SA. Real-time interferometric synthetic aperture microscopy. Opt Express. 2008;16:2555–2569. doi: 10.1364/oe.16.002555. [DOI] [PMC free article] [PubMed] [Google Scholar]
- 4.Ahmad A, Shemonski ND, Adie SG, Kim HS, Hwu WMW, Carney PS, Boppart SA. Real-time in vivo computed optical interferometric tomography. Nat Photonics. 2013;7:444–448. doi: 10.1038/nphoton.2013.71. [DOI] [PMC free article] [PubMed] [Google Scholar]
- 5.Huang D, Swanson EA, Lin CP, Schuman JS, Stinson WG, Chang W, Hee MR, Flotte T, Gregory K, Puliafito CA, Fujimoto JG. Optical coherence tomography. Science. 1991;254:1178–1181. doi: 10.1126/science.1957169. [DOI] [PMC free article] [PubMed] [Google Scholar]
- 6.Fercher AF. Optical coherence tomography. J Biomed Opt. 1996;1:157–173. doi: 10.1117/12.231361. [DOI] [PubMed] [Google Scholar]
- 7.Fercher AF, Drexler W, Hitzenberger CK, Lasser T. Optical coherence tomography-principles and applications. Rep Prog Phys. 2003;66:239–303. [Google Scholar]
- 8.Marks DL, Oldenburg AL, Reynolds JJ, Boppart SA. Autofocus algorithm for dispersion correction in optical coherence tomography. Appl Opt. 2003;42:3038–3046. doi: 10.1364/ao.42.003038. [DOI] [PubMed] [Google Scholar]
- 9.Wojtkowski M, Srinivasan VJ, Ko TH, Fujimoto JG, Kowalczyk A, Duker JS. Ultrahigh-resolution, high-speed, Fourier domain optical coherence tomography and methods for dispersion compensation. Opt Express. 2004;12:2404–2422. doi: 10.1364/opex.12.002404. [DOI] [PubMed] [Google Scholar]
- 10.Adie SG, Graf BW, Ahmad A, Carney PS, Boppart SA. Computational adaptive optics for broadband optical interferometric tomography of biological tissue. Proc Natl Acad Sci USA. 2012;109:7175–7180. doi: 10.1073/pnas.1121193109. [DOI] [PMC free article] [PubMed] [Google Scholar]
- 11.Shemonski ND, South FA, Liu YZ, Adie SG, Carney PS, Boppart SA. Computational high-resolution optical imaging of the living human retina. Nat Photonics. 2015;9:440–443. doi: 10.1038/NPHOTON.2015.102. [DOI] [PMC free article] [PubMed] [Google Scholar]
- 12.Paxman RG, Marron J. Aberration correction of speckled imagery with an image-sharpness criterion. 32nd Annual Technical Symposium; International Society for Optics and Photonics; 1988. pp. 37–47. [Google Scholar]
- 13.Hermann B, Fernández E, Unterhuber A, Sattmann H, Fercher A, Drexler W, Prieto P, Artal P. Adaptive-optics ultrahigh-resolution optical coherence tomography. Opt Lett. 2004;29:2142–2144. doi: 10.1364/ol.29.002142. [DOI] [PubMed] [Google Scholar]
- 14.Zhang Y, Rha J, Jonnal R, Miller D. Adaptive optics parallel spectral domain optical coherence tomography for imaging the living retina. Opt Express. 2005;13:4792–4811. doi: 10.1364/opex.13.004792. [DOI] [PubMed] [Google Scholar]
- 15.Zhang Y, Cense B, Rha J, Jonnal RS, Gao W, Zawadzki RJ, Werner JS, Jones S, Olivier S, Miller DT. High-speed volumetric imaging of cone photoreceptors with adaptive optics spectral-domain optical coherence tomography. Opt Express. 2006;14:4380–4394. doi: 10.1364/OE.14.004380. [DOI] [PMC free article] [PubMed] [Google Scholar]
- 16.Noll RJ. Zernike polynomials and atmospheric turbulence. J Opt Soc Am. 1976;66:207–211. [Google Scholar]
- 17.Xu Y, Chng XKB, Adie SG, Boppart SA, Carney PS. Multifocal interferometric synthetic aperture microscopy. Opt Express. 2013;22:16606–16618. doi: 10.1364/OE.22.016606. [DOI] [PMC free article] [PubMed] [Google Scholar]
- 18.Liu YZ, Shemonski ND, Adie SG, Ahmad A, Bower AJ, Carney PS, Boppart SA. Computed optical interferometric tomography for high-speed volumetric cellular imaging. Biomed Opt Express. 2014;5:2988–3000. doi: 10.1364/BOE.5.002988. [DOI] [PMC free article] [PubMed] [Google Scholar]
- 19.South FA, Liu YZ, Xu Y, Shemonski ND, Carney PS, Boppart SA. Polarization-sensitive interferometric synthetic aperture microscopy. Appl Phys Lett. 2015;107211106 doi: 10.1063/1.4936236. [DOI] [PMC free article] [PubMed] [Google Scholar]


