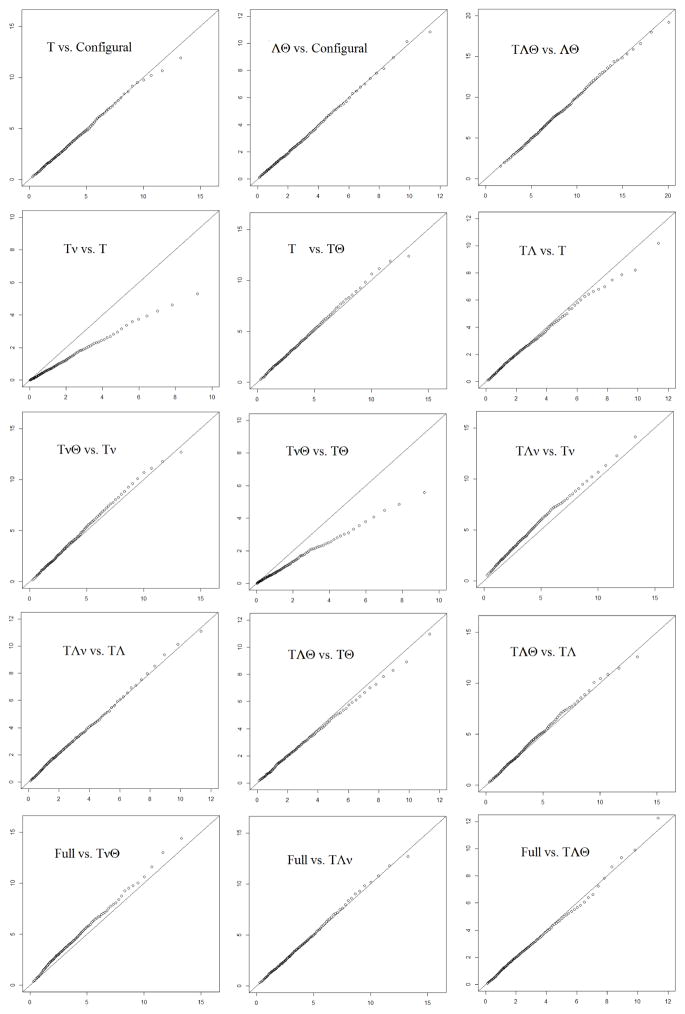
Figure 4.
Plots of the 1st-99th percentiles of the simulated distribution of the LRT statistic against those of a χ2 distribution with appropriate dfs. Data are in four categories. Each panel corresponds to a difference test represented by an arrow in Figure 1. In each panel, Greek letters denote invariant parameters in a model.

