

Abstract
The epithelial apical junctional complex (AJC) is an important regulator of cell structure and function. The AJC is compartmentalized into substructures comprising the tight and adherens junctions, and other membrane complexes containing the membrane proteins nectin, junctional adhesion molecule, and crumbs. In addition, many peripheral membrane proteins localize to the AJC. Studies of isolated proteins indicate a complex map of potential binding partners in which there is extensive overlap in the interactions between proteins in different AJC substructures. As an alternative to a direct search for specific protein-protein interactions, we sought to separate membrane substructures of the AJC in iodixanol density gradients and define their protein constituents. Results show that the AJC can be fractured into membrane substructures that contain specific membrane and peripheral membrane proteins. The composition of each substructure reveals a more limited overlap in common proteins than predicted from the inventory of potential interactions; some of the overlapping proteins may be involved in stepwise recruitment and assembly of AJC substructures.
INTRODUCTION
The apical junctional complex (AJC) is located at the apex of the lateral membrane of polarized epithelial cells and comprises a highly organized structure involved in regulating cell-cell adhesion, paracellular permeability, and cell polarity (Anderson et al., 2004). Many proteins have been localized to the AJC, and the multiple potential interactions between these proteins that have been documented have generated a complex picture of AJC organization (Nelson, 2003).
The organization of the AJC was initially defined by the electron microscopy of Farquhar and Palade (1963) that revealed two structures termed the zonula occludens (tight junction) and zonula adherens (adherens junction). Later studies identified specific proteins that localized to these substructures. The adherens junction is defined by the location of cadherins, and the tight junctions by proteins of the claudin family (Tsukita et al., 2001; Knust and Bossinger, 2002; Nelson, 2003), each of which form homophilic interactions with the same family of proteins on the adjacent cell to form the characteristic structural elements of the AJC. Additional transmembrane proteins of the Ig superfamily (junctional adhesion molecule [JAM] and nectin) have been located in the AJC (Takai and Nakanishi, 2003; Ebnet et al., 2004; Vogelmann et al., 2004).
The transmembrane proteins of the AJC are linked to scaffolding proteins in the cytoplasm, including the catenins and PDZ domain-containing proteins, which in turn bind to the actin cytoskeleton, and therefore an ever-expanding list of actin-associated proteins (Tsukita et al., 2001; Nelson, 2003; Takai and Nakanishi, 2003; Anderson et al., 2004). In addition, each of these scaffold proteins has multiple protein binding motifs that could link together different membrane subcomplexes into higher order protein complexes (Ebnet et al., 2004).
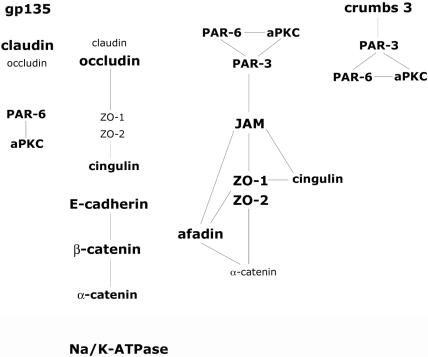
With the identification of a large repertoire of proteins that localize to the AJC, the task became the identification of their interactions with each other. Overall, >20 different research groups have defined a multitude of protein-protein interactions in the AJC (Figure 1). The complexity of protein interactions in the AJC that has emerged has come from a combination of protein interaction mapping involving genetic analysis in Drosophila and Caenorhabditis elegans, and direct fishing for protein-protein complexes in a variety of mammalian cells by immunoprecipitation and Western blotting, yeast two-hybrid, and pull-down assays by using bacterial fusion proteins. Despite the use of many different biological systems, experimental approaches, and states of AJC organization and assembly, current models of AJC protein organization integrate all this information into a very complex protein interaction map for a generic epithelial cell. The proteins displayed in Figure 1 are only the major components of the AJC, and the total number of proteins in these protein networks is growing fast (Van Aelst and Symons, 2002; Matter and Balda, 2003). For example, recent proteomics analyses have discovered many new proteins that are connected to the AJC (Brajenovic et al., 2004).
Figure 1.
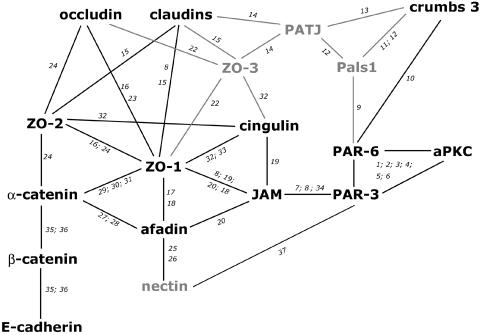
Protein-protein interaction map (proteins analyzed in this study in black). Numbers represent reference to previous studies: 1, Izumi et al. (1998); 2, Joberty et al. (2000); 3, Lin et al. (2000); 4, Suzuki et al. (2001); 5, Johansson et al. (2000); 6, Qiu et al. (2000); 7, Ebnet et al. (2001); 8, Itoh et al. (2001); 9, Hurd et al. (2003); 10, Lemmers et al. (2004); 11, Makarova et al. (2003); 12, Roh et al. (2002b); 13, Lemmers et al. (2002); 14, Roh et al. (2002a); 15, Itoh et al. (1999a); 16, Fanning et al. (1998); 17, Yamamoto et al. (1997); 18, Fukuhara et al. (2002); 19, Bazzoni et al. (2000); 20, Ebnet et al. (2000); 22, Haskins et al. (1998); 23, Furuse et al. (1994); 24, Itoh et al. (1999b); 25, Takahashi et al. (1999); 26, Reymond et al. (2001); 27, Tachibana et al. (2000); 28, Pokutta et al. (2002); 29, Itoh et al. (1991); 30, Itoh et al. (1997); 31, Imamura et al. (1999); 32, Cordenonsi et al. (1999); 33, D'Atri et al. (2002); 34, Ebnet et al. (2003); 35, Aberle et al. (1994); 36, Jou et al. (1995); 37, Takekuni et al. (2003).
These studies provide an important catalogue of potential protein-protein interactions in the AJC. However, there are some limitations of these approaches. Coimmunoprecipitation studies of overexpressed proteins are biased toward the protein of interest and they do not inform about the quantity of proteins in the complex relative to other complexes, or about the specificity of those interactions in the context of AJC substructures. For example, the scaffolding protein ZO-1 has been shown to interact with more than nine different proteins (Figure 1), including the tight junction transmembrane proteins claudins, occludin, and JAM via different binding domains. One model predicts that ZO-1 forms a backbone to link these proteins with each other to build a stable structure and to connect it to the actin cytoskeleton (Ebnet et al., 2004), whereas another suggests that they are in separate subcomplexes (Sasaki et al., 2003; Matsuda et al., 2004). It is not known whether all of these interactions occur simultaneously in the same subcellular space, whether they occur sequentially during AJC assembly, or whether ZO-1 is part of nine separate subcomplexes. Similar questions arise regarding other protein-protein interactions shown in Figure 1.
To examine protein distribution in the AJC, we used a systematic and unbiased approach to analyze 16 endogenous proteins known to associate with the AJC in mammalian epithelial cells. Using a previously described biochemical strategy (Yeaman, 2003), we are able to separate membrane substructures of the AJC together with associated protein subcomplexes in iodixanol density gradients. The protein composition of these substructures is correlated with three-dimensional analysis of high-resolution immunofluorescence microscopy. We conclude that many of these proteins are separated into distinct subcomplexes or may interact only transiently during AJC assembly, whereas others may be irrelevant to the formation and maintenance of the AJC in Madin-Darby canine kidney (MDCK) cells.
MATERIALS AND METHODS
Antibodies
PAR-3 antibodies were made against the N terminus of rat PAR-3 (AA 1-360) expressed in Escherichia coli and injected into rabbits (cDNA generously provided by S. Ohno, Yokohama City University School of Medicine, Yokohama, Japan). Immune serum of clone #567 recognizes mainly the 180-kDa isoform of canine PAR-3 and clone #568 mainly the 100-kDa isoform. Serum was affinity purified using recombinant PAR-3 protein (1-360) (immunofluorescence: 1:50; immunoblot: 1:250). PAR-6 antibodies were made against the C terminus of human PAR-6 (AA 250-345) expressed in Escherichia coli and injected into rabbits (cDNA generously provided by G. Steven Martin, University of California at Berkeley, Berkeley, CA). The immune serum recognizes canine PAR-6a isoform ∼38 kDa (IB: 1:50). Rabbit (rb) polyclonal (pc) antibody against PAR-6b isoform (beta2-4AP) was a kind gift from S. Ohno (Yamanaka et al., 2003). Antibody (rb, pc) against JAM-A has been described previously (IB: 1:250) (Amieva et al., 2003). Mouse (ms) monoclonal (mc) antibody against JAM-A (J10.4) was a kind gift from C. Parkos (Emory University School of Medicine, Atlanta, GA) (Mandell et al., 2004). Antibodies against occludin (IB: rb, pc; IF: ms, mc), claudin 1 (rb, pc), claudin 4 (ms, mc), ZO-1 (IB: rb, pc; IF: ms, mc and rb, pc), and ZO-2 (ms, mc) were purchased from Zymed Laboratories (South San Francisco, CA), aPKC (C-20) was from Santa Cruz Biotechnology (Santa Cruz, CA), l-afadin (rb, pc) was from Sigma-Aldrich (St. Louis, MO), and F-actin (ms, mc) was from Chemicon International (Temecula, CA). Antibody (rb, pc) against crumbs 3 was a kind gift from A. Le Bivic (Universite de la Mediterranee, Marseille, France) (Lemmers et al., 2004); antibody against cingulin (rb, pc) was kindly provided by S. Citi (Geneva, Switzerland). Antibodies against E-cadherin (IF: E2, rb, pc; IB: rr1, ms, mc), β-catenin, α-catenin, gp135, and Na/K-ATPase have been described previously (Gumbiner and Simons, 1986; Ojakian and Schwimmer, 1988; Hinck et al., 1994; Piepenhagen et al., 1995). Secondary antibodies (anti-mouse Alexa Fluor 680, anti-mouse and anti-rabbit Alexa Fluor 594, anti-mouse and anti-rabbit Alexa Fluor 488) and Alexa Fluor 680-coupled streptavidin were purchased from Molecular Probes (Eugene, OR), and anti-rabbit IRDye® 800 was from Rockland Immunochemicals (Gilbertsville, PA).
Cell Culture and Calcium-Switch Experiments
MDCK II cells were cultured in DMEM (Invitrogen, Carlsbad, CA) containing 10% fetal bovine serum, penicillin, streptomycin, and kanamycin as described previously (Nelson and Veshnock, 1987). For all experiments, cell-cell contact formation was synchronized in calcium-switch experiments as described previously (Yeaman, 2003). The protocol was modified as cells were generated by passing them at high density (2 × 10⁷ cells/150-mm TC culture dish) on two consecutive days. After trypsinization, cells were plated on collagen-coated 0.4-μm polycarbonate membranes (Transwell filters; Costar, Cambridge, MA) in low calcium media (LCM; 5 μM Ca2+). For barrier-function experiments, 1 × 10⁶ cells/12-mm well, for immunofluorescence, 2.5 × 10⁶ cells/24-mm well, and for density gradients, 2 × 10⁷ cells/75-mm well, were plated in LCM for 30 min to allow attachment. Cells were subsequently transferred into regular DMEM (1.8 mM Ca2+) for the time points indicated. For time points 3 d and 10 d, media were replaced every 24 h with fresh regular DMEM media.
Immunofluorescence
For confocal immunofluorescence microscopy, cells were fixed with 2% paraformaldehyde in 100 mM phosphate buffer, pH 7.4, and were permeabilized in phosphate-buffered saline (PBS) + 1% saponin + 3% bovine serum albumin for 10 min at room temperature. For staining with occludin, claudin 1, claudin 4, PAR-6b (3 d), and aPKC (3 d) antibodies, cells were fixed in ethanol for 30 min at 4°C followed by 30 s in acetone (-20°C). After staining with appropriate antibodies, samples were imaged with a confocal microscope (Bio-Rad, Hercules, CA), and the z-stacks were projected onto three-dimensional reconstructions by using Volocity 2.5.1 software (Improvision, Lexington, MA). Figures were assembled with Photoshop 7.0.
Cell Fractionation in Iodixanol Density Gradients
Membrane compartments were separated in self-forming linear 10-20-30% iodixanol density gradients as described previously (Yeaman, 2003). MDCK cells were chemically cross-linked with dithiobis(succinimidylpropionate) (DSP; Pierce Chemical, Rockford, IL) before mechanical breakage of cells (Yeaman et al., 2004). Briefly, cells were washed three times with ice-cold Ringer's saline before 6 ml of freshly prepared 200 μg/ml DSP in Ringer's saline was added to the apical compartment for 20 min at room temperature with gentle rocking. The reaction was quenched by five washes with quenching buffer (120 mM NaCl, 10 mM Tris, pH 7.4, + 50 mM NaH4Cl). After repeated passages through a ball-bearing homogenizer (Varian Physics Department, Stanford University, Stanford, CA), the postnuclear supernatant of mechanical broken cells was mixed with equal amounts of iodixanol [final concentration 30% (wt/vol); Nycomed, Oslo, Norway]. Equal volumes of 20 and 10% solutions of iodixanol were overlaid. After centrifugation at 350,000 × g for 3 h at 4°C in a Beckman Coulter VTI 65.1 rotor, fractions (0.5 ml) were collected from the top of the gradient. The refractive index (η) of each fraction was measured, and its density was determined in g/ml [δ = (η * 3.443) - 3.599] (Supplemental Figure 1A). Note that gradients are highly reproducible and fraction densities are comparable between gradients analyzed in this study.
To sediment previously separated membranes in a second iodixanol gradient, cells were allowed to form a polarized monolayer for 3 d and were separated in a 10-20-30% floating iodixanol gradient as described above. For the “top-bottom” gradient, fractions 19-22 were combined with half of fractions 4-9. These solutions were diluted to a 10% iodixanol solution and underlayered with equal volumes of 20 and 30% iodixanol solutions, respectively. After centrifugation at 350,000 × g for 3 h at 4°C in a Beckman Coulter VTI 65.1 rotor, fractions (0.5 ml) were collected from the top of the gradient. The refractive index (η) of each fraction was measured and its density was determined in grams per milliliter [δ = (η * 3.443) - 3.599] (Supplemental Figure 1A). Fraction densities are comparable with regular 10-20-30% floating iodixanol gradients.
Cell Surface Biotinylation
For cell surface biotinylation, MDCK II cells were biotinylated as described previously (Yeaman et al., 2004). Briefly, MDCK II cells were grown as a confluent monolayer for 3 d on 75-mm Transwell filters before washing three times in Ringer's saline. Sulfo-NHS-Biotin (Pierce Chemical) was used at a final concentration of 0.5 mg/ml in ice-cold Ringer's saline, 4 ml in apical and 7 ml in basal compartment. Cells were incubated twice for 20 min at 4°C with gentle rocking. After three wash steps with Ringer's saline, cells were cross-linked as described above.
Barrier Function Test: Paracellular Diffusion of Nonionic Molecular Tracers
Paracellular diffusion of nonionic molecular tracers [3H]inulin (Amersham Biosciences, Piscataway, NJ) and 10-kDa dextran Alexa Fluor 647 (Molecular Probes) was determined in calcium-switch experiment (Jou et al., 1998). At time points indicated, media were replaced as follows 200 μl of regular DMEM media with 100 μg/ml 10-kDa dextran Alexa Fluor® 647 and 4 nM [3H]Inulin in apical compartment (LCM for time point 0 h); 400 μl of regular DMEM media in basal compartment (LCM for time point 0 h). After incubation for 30 min at 37°C, 5% CO2 in cell incubator, media of basal compartments were analyzed with Odyssey infrared imaging system (LI-COR, Lincoln, NE) at 680-nm wavelength and scintillation counter, respectively. Each time point was done in triplicate, and data were background corrected for values of DMEM media only. Data of Odyssey infrared imaging system are expressed as Integrated Intensity (see “Data Analysis” below).
Gel Electrophoresis and Immunoblotting
Protein samples were boiled in SDS-sample buffer containing dithiothreitol (final concentration, 50 mM) for 10 min and separated in SDS polyacrylamide gels as described previously (Laemmli, 1970). After transfer to Protran 0.45-μm nitrocellulose membranes (Schleicher & Schuell, Keene, NH), proteins were blocked with LI-COR blocking buffer in PBS (1:1) for 1 h at room temperature. Immunostaining was performed with appropriate antibodies after Western blot protocol for Odyssey infrared imaging system with the following modifications (http://biosupport.licor.com/support/RnP/ody/West_07568/Western_07568.htm). Primary antibodies and fluorescently labeled secondary antibodies (1:30,000) were diluted in washing buffer (120 mM NaCl, 10 mM Tris, pH 7.4, + 0.1% Tween 20) and incubated for 1 h or 30 min at room temperature, respectively. Membranes were scanned with Odyssey infrared imaging system at 680- and 800-nm wavelength.
Data Analysis
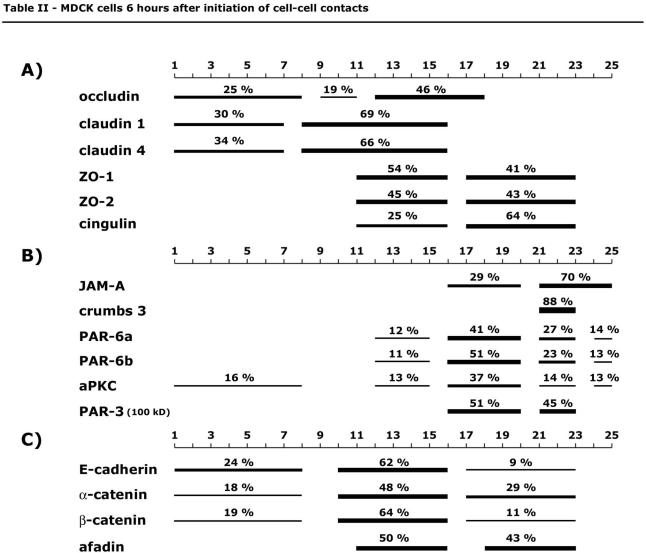
The amount of protein per fraction was determined with Odyssey software 1.2 after Western blot membranes were scanned with Odyssey infrared imaging system. Data are expressed as integrated intensity of a specified area and background corrected using the median background method (see user guide, version 1.2 for Odyssey infrared imaging system, chapters 8 and 12). Briefly, integrated intensity is the sum of the intensity values for all pixels enclosed by a shape, multiplied by the area of the shape (counts/mm2). The background is calculated and is subtracted using the median value of pixels at top and bottom of the perimeter of the area being quantified (border width 2). For each protein, the integrated intensities of fractions 1 through 25 in one gradient are summed up, and the amount in one fraction is expressed as percentage of the sum of fractions 1-25. Graphs for protein distribution along a gradient are generated using chart-type area with three-dimensional (3-D) visual effect in Microsoft Excel X for Mac software. Percentages in Tables 1 and 2 represent sum of percentages for specified protein in fractions, which form a peak, indicated by bars.
Table 1.
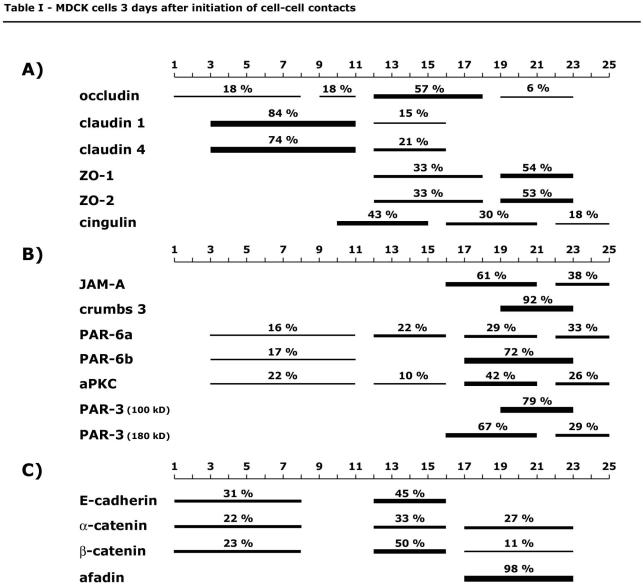
Table 2.
RESULTS
Membranes of MDCK II cells were separated in self-forming linear 10-20-30% iodixanol density gradients at six different time points after initiation of cell-cell contacts (3, 6, 9, and 12 h, and 3 and 10 d) during formation of the AJC in polarizing MDCK epithelial cells. Proteins were cross-linked before homogenizing cells to avoid partial disassembly of protein complexes during dilution after cell homogenization and iodixanol separation. In principal, membranes float up to their buoyant density during centrifugation. Thereby, proteins in the same membrane-associated complex will cosediment in the same distribution pattern in the density gradient, whereas proteins in different complexes have different distributions (Yeaman, 2003). Because of G-force, the sedimentation characteristics of different membrane substructures also will be determined by the amount of associated proteins.
Surface biotinylated proteins (apical and basal-lateral membranes) are located throughout the density gradient (Supplemental Figure 1B). This is in contrast to previous studies, where apical and basal-lateral membranes are localized to confined fractions around δ ∼1.07 g/ml and δ ∼1.10 g/ml, respectively (Yeaman et al., 2004). A reason for this difference may be that in the present study proteins were cross-linked before disrupting cells. However, closer inspection of well-known marker proteins of the apical (gp135) and basal-lateral (Na/K-ATPase) membranes revealed they were separated into different membrane fractions (Figure 9, A and B).
Figure 9.
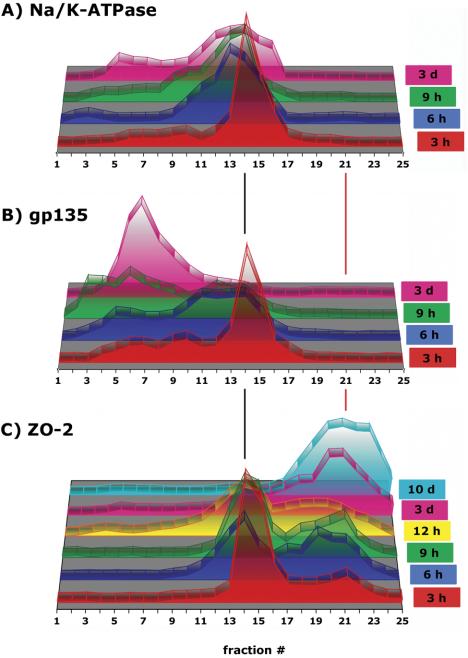
Distribution of proteins in 10-20-30% iodixanol gradients during formation of AJC. MDCK cells were grown as confluent monolayers on Transwell filters for time points indicated after cell-cell adhesion. After separation of fraction samples by SDS-PAGE followed by immunoblotting, signal intensity for each protein band was determined as integrated intensity (counts/mm2) and expressed as percentage of the sum of integrated intensities in fractions 1-25 (see Materials and Methods for details). In the 3-D graph, the y-axis (arbitrary units) is omitted to increase clarity of the graphical display.
We examined the distribution of 16 marker proteins of the AJC during development of cell polarity. The data from fully polarized MDCK cells 3 d and 10 d after initiation of cell-cell contacts are presented. These time points revealed similar results for the distributions of proteins by immunofluorescence and in density gradients, and therefore the data for 3 d are shown in detail. Earlier time points during the assembly of the AJC are then presented, and the data obtained for 6 h after initiation of cell-cell contacts are shown in detail; at this time, most of the proteins are localized to the AJC, but the paracellular barrier has not been yet formed.
Separation of Transmembrane Proteins of AJC in Polarized MDCK Cells
We examined six transmembrane proteins that form the core of the AJC: occludin, claudin, JAM-A, E-cadherin, nectin, and crumbs 3. Because of a lack of reactivity, we were unable to detect nectin and therefore used the nectin-binding protein afadin to mark the distribution of nectin.
The tight junction is formed by the transmembrane proteins occludin and members of the claudin family (Tsukita and Furuse, 2002), and electron microscopy of freeze fraction replicas of cells used in this study revealed that membrane strands characteristic of the tight junction are restricted to the apical tip of the lateral membrane (Jou et al., 1998). By immunofluorescence microscopy, occludin was confined to the apical tip of the lateral membrane in polarized cells (Figure 3B, I/II, and Video 3B, II). However, claudin 1 and claudin 4 were localized along the lateral membrane as well as at its apical tip where occludin was located (Figure 2B, I-IV, and Video 2B, II and III). The lateral membrane distribution of claudins below the AJC in MDCK II cells has been reported previously (Van Itallie et al., 2003), but it is in contrast to other studies in which they were found at the apical tip of the lateral membrane (Sonoda et al., 1999). Fractionation of membranes in iodixanol gradients revealed that occludin sedimented in three distinct peaks (Figure 2A). The majority of occludin (57%) sedimented in membrane fractions 12-18 (δ 1.114-1.182 g/ml; Supplemental Figure 1A), and 18% each in two lower density membrane peaks, fractions 1-8 (δ 1.013-1.078 g/ml) and 9-11 (δ 1.089-1.108 g/ml) (Table 1A). In contrast, the majority of claudin 1 and claudin 4, 84 and 74%, respectively, was located in low-density membrane fractions 3-11 (δ 1.027-1.108 g/ml) with a peak different from that of occludin in this region of the gradient. Only 15% of claudin 1 and 21% of claudin 4 cosedimented in fractions containing occludin (12-16; Figure 2A and Table 1A).
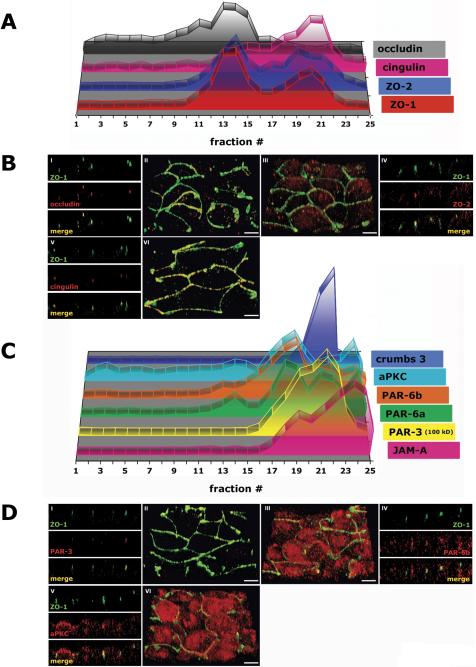
Figure 3.
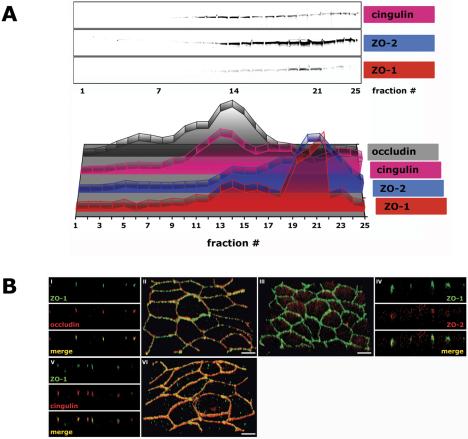
Tight junction proteins of the AJC in polarized epithelia (3 d after cell-cell adhesion). MDCK cells were grown as confluent monolayers on Transwell filters for 3 d after cell-cell adhesion. (A) 10-20-30% iodixanol gradient. Signal intensity for each protein band was determined as integrated intensity (counts/mm2) and expressed as percentage of the sum of integrated intensities in fractions 1-25 (see Materials and Methods for details). In the 3-D graph, the y-axis (arbitrary units) is omitted to increase clarity of the graphical display. (B) Immunofluorescence. II/III/VI are 3-D reconstructions of confocal z-stacks in a 45°-angled view. I/IV/V are z-sections of corresponding 3-D reconstructions. Bar, 5 μm.
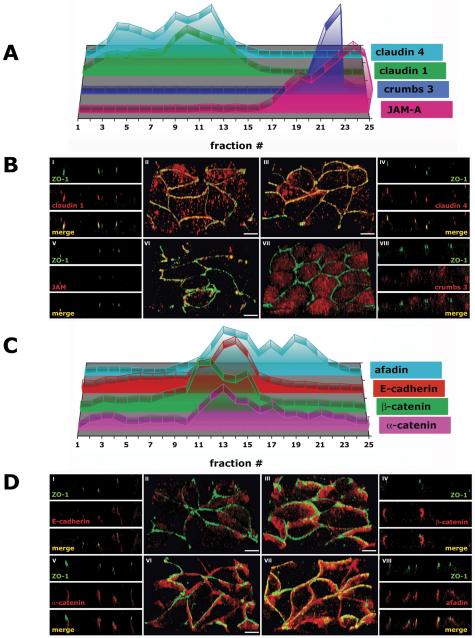
Figure 2.

Transmembrane proteins of the AJC in polarized epithelia (3 d after cell-cell adhesion). MDCK cells were grown as confluent monolayers on Transwell filters for 3 d after cell-cell adhesion. (A) 10-20-30% iodixanol gradient. Signal intensity for each protein band was determined as integrated intensity (counts/mm2) and expressed as percentage of the sum of integrated intensities in fractions 1-25 (see Materials and Methods for details). In the 3-D graph, the y-axis (arbitrary units) is omitted to increase clarity of the graphical display. (B) Immunofluorescence. II/III/VI/VII are 3-D reconstructions of confocal z-stacks in a 45°-angled view. I/IV/V/VIII are z-sections of corresponding 3-D reconstructions. Bar, 5 μm.
We examined claudin and occludin distributions in MDCK II cells grown for 10 d on filters to ensure the cells were completely polarized. However, we still found that claudin 1 and 4 were localized along the lateral membrane as well as at the AJC (Vogelmann, unpublished data). In density gradients, claudin 1 and claudin 4 were separated into three distinct peaks, but again only 17% of total claudin 1 and claudin 4 cofractionated with occludin in membrane fractions 12-16 (Figure 10D; our unpublished data). That a small fraction (∼20%) of claudins and the majority of occludin cosediment, whereas the majority of claudins is found in different membrane fractions is consistent with the immunofluorescence localization of some claudin and most of occludin at the AJC, and the majority of claudin but none of occludin along the length of the lateral membrane.
Figure 10.
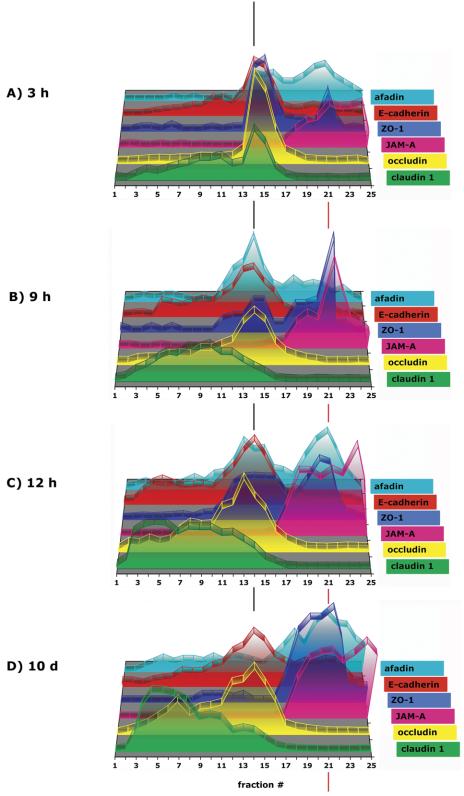
Formation of AJC in 10-20-30% iodixanol gradients. MDCK cells were grown as confluent monolayers on Transwell filters for time points indicated after cell-cell adhesion. After separation of fraction samples by SDS-PAGE followed by immunoblotting, signal intensity for each protein band was determined as integrated intensity (counts/mm2) and expressed as percentage of the sum of integrated intensities in fractions 1-25 (see Materials and Methods for details). In the 3-D graph, the y-axis (arbitrary units) is omitted to increase clarity of the graphical display.
By immunofluorescence microscopy, the transmembrane protein JAM-A was located principally at the AJC, and some was distributed along the lateral membrane (Figure 2B, V and VI, and Video 2B, VI). In iodixanol gradients, the majority of JAM-A (68%) sedimented in membrane fractions 16-21 (δ 1.158-1.214 g/ml), whereas the remainder sedimented in fractions 22-25 (δ 1.235-1.381 g/ml) much higher in density than membranes containing either occludin or claudins (Figure 2A and Table 1B). This is inconsistent with models, suggesting that claudins, occludin, and JAM-A could be linked together into a multitransmembrane complex at the AJC (Ebnet et al., 2004).
Crumbs 3, a recently described transmembrane protein of the AJC (Makarova et al., 2003; Lemmers et al., 2004), was mostly localized by immunofluorescence to the apical membrane with only partial overlap with the AJC (Figure 2B, VII and VIII, and Video 2B, VII). In iodixanol gradients underlayered with cell homogenate, crumbs 3 did not float up but remained in high-density membrane fractions 19-23 (92%; δ 1.190-1.269 g/ml) (Figure 2A and Table 1B). The sedimentation profile of crumbs 3 was different from that of gp135, another apical membrane protein (Figure 9B), although both proteins show a similar distribution by immunofluorescence (Figure 2B) (Ojakian and Schwimmer, 1988). The reason for this difference may be that gp135 has a higher affinity for glycosphingolipids containing microdomains of the apical membrane that float to the top of the gradient than the very dense crumbs 3-containing membranes that remain at the bottom of the gradient.
According to previous protein-protein interaction mapping, crumbs 3 could be incorporated into tight junctions via indirect interaction with claudin 1 (Roh et al., 2002b). However, the different membrane locations and sedimentation characteristics of crumbs 3 and claudin 1 membranes indicate little or no evidence of an interaction between these proteins.
Crumbs 3 and JAM-A show similar, but not identical sedimentation profiles at the bottom of the iodixanol gradient. However, these proteins have distinctly different membrane locations based on immunofluorescence microscopy (Figure 2B, V-VIII). A possible explanation of this apparent contradiction is that membranes containing JAM-A and crumbs 3 complexes are in fact different (hence, their different locations in the cell), but they did not separate by floatation in this iodixanol gradient because they are very dense and remained together at the bottom fractions of the gradient where the cell homogenate was loaded. Therefore, we used a second iodixanol gradient to attempt to separate JAM-A- and crumbs 3-containing membranes. In this experiment, the bottom fractions containing JAM-A and crumbs 3 complexes from the first iodixanol gradient were combined, diluted to 10% iodixanol, and then overlayered on top of 20 and 30% iodixanol and recentrifuged. Hence, the protein complexes were separated by sedimentation through the second iodixanol gradient in contrast to the first gradient in which we tried to separate them by floatation. Under this second condition, JAM-A and crumbs 3 membranes were clearly separated from each other: the crumbs 3 membranes sedimented in fractions 20-24 (δ 1.204-1.355 g/ml), whereas JAM-A-containing membranes sedimented in fractions 10-19 (δ 1.094-1.194 g/ml) (Figure 6). We conclude that JAM-A and crumbs 3 complexes are present in distinct locations in the cell on membranes that have different sedimentation characteristics, which, because of their apparent high densities, were revealed by sedimentation rather than floatation in iodixanol gradients.
Figure 6.
Sedimentation of bottom fractions 19-22 in second 10-20-30% iodixanol top-bottom gradient. MDCK cells were grown as confluent monolayers on Transwell filters for 3 d after cell-cell adhesion. After separation in a regular 10-20-30% floating iodixanol gradient, fractions 19-22 were combined with half of fractions 4-9. Membranes were spun from the top of the gradient in a 10-20-30% iodixanol gradient as described Materials and Methods. Signal intensity for each protein band was determined as integrated intensity (counts/mm2) and expressed as percentage of the sum of integrated intensities in fractions 1-25 (see Materials and Methods for details). In the 3-D graph, the y-axis (arbitrary units) is omitted to increase clarity of the graphical display.
Tight Junction Proteins of the AJC in Polarized MDCK Cells
Because of the different sedimentation profiles of occludin, claudin, and JAM-A in density gradients, we asked whether the tight junction scaffolding proteins ZO-1, ZO-2, and cingulin also separated into different protein subcomplexes. Note, endogenous ZO-3 protein levels are low in MDCK cells and ZO-3 was undetectable in iodixanol gradients, and hence it was not possible to determine ZO-3 distribution patterns. By immunofluorescence, ZO-1 and ZO-2 were localized to the apex of the lateral membrane similar to those of occludin and JAM-A, but not to the majority of claudins that localize along the lateral membrane (Figures 2B, V and VI, 3B, I-IV, and Video 3B, II and III). ZO-1 and ZO-2 sedimented in iodixanol gradients in two membrane fractions. The majority of ZO-1 (54%) and ZO-2 (53%) associated with membranes with high density 19-23 (δ1.190-1.269 g/ml), coincident with membranes containing the majority of JAM-A, one-third sedimented in fractions 12-18 (δ1.114-1.182 g/ml) with the majority of occludin membranes (Figure 3A and Table 1A), and little or none sedimented with claudin containing membranes. In iodixanol gradients of membranes from 10-d-old MDCK cells, almost all of ZO-1 and ZO-2 cosedimented with membranes containing JAM-A in high-density membranes, but little or none sedimented with claudin-containing membranes (Figures 9C and 10D).
Cingulin interacts indirectly with occludin and claudin via ZO proteins (Cordenonsi et al., 1999) and directly with JAM-A, and therefore it could interlink different membrane protein complexes. By immunofluorescence cingulin colocalized with ZO-1 at the AJC (Figure 3B, V and VI, and Video 3B, VI). Forty-three percent of cingulin cofractionated with membranes containing occludin, ZO-1, and ZO-2 in fractions 12-15 (δ1.114-1.144 g/ml) (note that these fractions also contain ∼20% of claudins). Cingulin also cosedimented with membranes containing JAM-A in two high-density membrane peaks in fractions 16-21 (30%; δ1.158-1.214 g/ml) and 22-25 (18%; δ1.235-1.381 g/ml) (Figure 3A and Table 1A). Iodixanol gradients of membranes from 10-d cells revealed that cingulin cosedimented with JAM-A in high-density membranes, but it was absent, together with ZO-1 and ZO-2, from occludin-containing membranes (Supplemental Figure 3C).
Adherens Junction Proteins of the AJC in Polarized MDCK Cells
Adherens junctions are mainly formed by the cadherin/catenin system, which consists of E-cadherin bound to β-catenin, which binds to α-catenin (Aberle et al., 1994; Jou et al., 1995). By immunofluorescence, E-cadherin, β-catenin, and α-catenin colocalized along the lateral membrane below the tight junction (Figure 4B, I-VI, and Video 4B, II, III, and VI). In iodixanol gradients, E-cadherin, β-catenin, and α-catenin were separated into two major membrane peaks; 31% of E-cadherin, 22% of β-catenin, and 23% of α-catenin cosedimented in low-density membrane fractions 1-8 (δ 1.013-1.078 g/ml), and 45% of E-cadherin, 50% of β-catenin, and 33% of α-catenin cosedimented in membrane fractions 12-16 (δ 1.114-1.158 g/ml) (Figures 2A and 4A and Table 1C).
Figure 4.
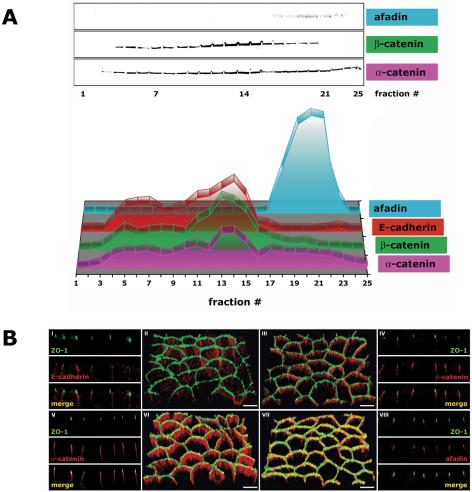
Adherens junction proteins of the AJC in polarized epithelia (3 d after cell-cell adhesion). MDCK cells were grown as confluent monolayers on Transwell filters for 3 d after cell-cell adhesion. (A) 10-20-30% iodixanol gradient. Signal intensity for each protein band was determined as integrated intensity (counts/mm2) and expressed as percentage of the sum of integrated intensities in fractions 1-25 (see Materials and Methods for details). In the 3-D graph, the y-axis (arbitrary units) is omitted to increase clarity of the graphical display. (B) Immunofluorescence. II/III/VI/VII are 3-D reconstructions of confocal z-stacks in a 45°-angled view. I/IV/V/VIII are z-sections of corresponding 3-D reconstructions. Bar, 5 μm.
The nectin/afadin complex is localized to the AJC (Takai and Nakanishi, 2003). Endogenous nectin levels are low in MDCK II cells, and we were unable to detect it in density gradients with the antibodies available to us. As in other studies (Fukuhara et al., 2002; Honda et al., 2003), we used the scaffolding protein afadin as a marker for nectin distribution in MDCK cells. There are two splice variants of afadin, s- and l-afadin, of which l-afadin is the nectin- and F-actin-binding protein (Takai and Nakanishi, 2003). l-Afadin sedimented in high-density membrane fractions 17-23 (δ 1.170-1.269 g/ml), distinct from membranes containing E-cadherin and catenins (Figure 4A).
l-Afadin cofractionated with a potential interaction partner ZO-1 in high-density membrane fractions (Figures 3A and 4A). Greater than 25% of α-catenin, another potential l-afadin and ZO-1 binding partner (Figure 1), cosedimented with l-afadin and ZO-1 in high-density membrane fractions, in a distribution different from that of E-cadherin and β-catenin (Figure 4A and Table 1C). This is in agreement with immunofluorescence in which some of α-catenin, but not E-cadherin and β-catenin, colocalized with ZO-1 and l-afadin (Figure 4B and Video 4B, VII and VII).
Polarity Proteins in the AJC in Polarized MDCK Cells
That JAM-A and crumbs 3 sedimented in high-density membrane fractions from polarized MDCK cells suggests that membranes containing these transmembrane proteins are associated with a larger protein complex. The PAR-3/PAR-6/aPKC polarity protein complex interacts directly with JAM-A and crumbs 3 (Figure 1). By immunofluorescence, PAR-3 colocalized with ZO-1 at the AJC (Figure 5B, I and II, and Video 5B, II). In iodixanol gradients, the PAR-3 100-kDa and 180-kDa isoforms had different sedimentation patterns (Figure 5A). The PAR-3 180-kDa isoform had the same sedimentation profile as that of JAM-A with 67% in membrane fractions 16-21 (δ 1.158-1.214 g/ml) and 29% in membrane fractions 22-25 (δ 1.235-1.381 g/ml); 79% of the PAR-3 100-kDa isoform fractionated in membrane fractions 19-23 (δ 1.190-1.269 g/ml) similar to that of crumbs 3 (Table 1B).
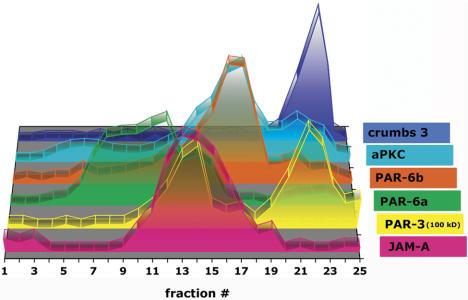
Figure 5.
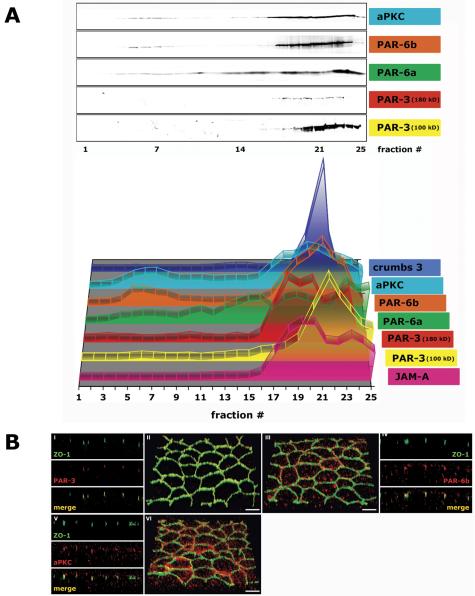
Polarity proteins of the AJC in polarized epithelia (3 d after cell-cell adhesion). MDCK cells were grown as confluent monolayers on Transwell filters for 3 d after cell-cell adhesion. (A) 10-20-30% iodixanol gradient. Signal intensity for each protein band was determined as integrated intensity (counts/mm2) and expressed as percentage of the sum of Integrated Intensities in fractions 1-25 (see Materials and Methods for details). In the 3-D graph, the y-axis (arbitrary units) is omitted to increase clarity of the graphical display. (B) Immunofluorescence. II/III/VI are 3-D reconstructions of confocal z-stacks in a 45°-angled view. I/IV/V are z-sections of corresponding 3-D reconstructions. Bar, 5 μm.
By immunofluorescence, PAR-6 localizes to the AJC, but also in a more punctate pattern that seems close to the apical surface of cells. (Figure 5B, III and IV, and Video 5B, III). PAR-6a and PAR-6b isoforms had sedimentation patterns distinct from each other; 29% of PAR-6a cofractionated with PAR-3 (180 kDa) and JAM-A in membrane fractions 17-21 (δ 1.170-1.214 g/ml), and 72% of PAR-6b cosedimented with crumbs 3 and JAM-A in high-density membrane fractions (Figure 5A and Table 1B). Interestingly, 22% of PAR-6a sedimented in membrane fractions 12-16 (δ 1.114-1.158 g/ml) and 17% of PAR-6b in low-density membrane fractions 3-11 (δ 1.027-1.108 g/ml) together with their high-affinity interaction partner aPKC (Table 1B). In polarized MDCK II cells grown for 10 d on filter, the low-density membrane peak of PAR-6b became even more prominent with 26% fractionating in fractions 3-11 (Figure 11D).
Figure 11.
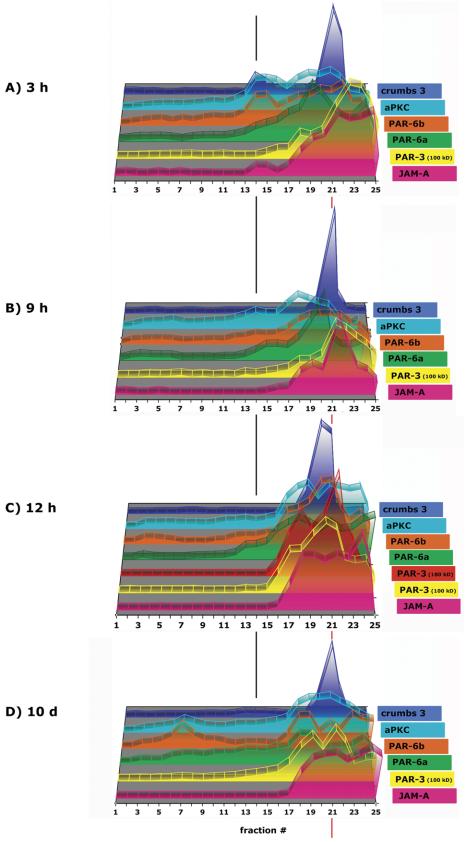
Polarity proteins during formation of AJC in 10-20-30% iodixanol gradients. MDCK cells were grown as confluent monolayers on Transwell filters for time points indicated after cell-cell adhesion. After separation of fraction samples by SDS-PAGE followed by immunoblotting, signal intensity for each protein band was determined as integrated intensity (counts/mm2) and expressed as percentage of the sum of integrated intensities in fractions 1-25 (see Materials and Methods for details). In the 3-D graph, the y-axis (arbitrary units) is omitted to increase clarity of the graphical display.
Because it is difficult to distinguish membranes containing crumbs 3 or JAM-A, both of which interact with PAR proteins (Figure 1), we examined high-density membranes that had been combined and reseparated in a secondary iodixanol gradient in which membranes were loaded on the top (see above for rationale for separating JAM-A and crumbs 3 membrane complexes). As described above, JAM-A- and crumbs 3-containing membranes were clearly separated from each other, and we found that PAR proteins separated into two major peaks (Figure 6). PAR-3 cosedimented with JAM-A-containing membranes in fractions 10-16 (δ 1.094-1.147 g/ml) and with membranes containing crumbs 3 in fractions 19-24 (δ 1.194-1.355 g/ml). Secondary peaks of PAR-6a, PAR-6b, and aPKC were detected in fractions 20-24 (δ 1.204-1.355 g/ml) in which membranes containing crumbs 3 also sedimented. The amount of PAR-6 proteins and aPKC distributed between the membranes containing JAM-A and crumbs 3 seems to reflect the relative staining intensities of PAR-6 (Figure 5B, III and IV, and Video 5B, III) between the AJC (containing JAM-A) and apical membrane (containing crumbs 3).
Tight Junction Proteins during Formation of the AJC
Having defined the organization of AJC membranes in polarized MDCK cells, we asked how proteins are arranged in different complexes during formation of the AJC at different times after initiation of cell-cell contacts. In this study, the tight junction barrier was formed during the first 12 h (Supplemental Figure 2). Note that well-known marker proteins of the apical (gp135) and basal-lateral (Na/K-ATPase) membranes gradually separated into different membrane fractions in the iodixanol gradient at different times during development of cell polarity (Figure 9, A and B). Both proteins cosedimented in membranes in fractions 12-16 (δ 1.114-1.154 g/ml) at 3 h, but thereafter gp135 associated with membranes that became increasingly more buoyant such that at 3 d, gp135 sedimented in fractions 4-10 (δ 1.037-1.097 g/ml); concurrently, 72% of Na/K-ATPase-containing membranes remained in fractions 10-16 (δ 1.097-1.158 g/ml). Thus, during the development of polarity, marker proteins of the apical and basal-lateral membrane gradually sort out from one another into membranes that have different buoyant densities.
Six hours after cell-cell contact, the transmembrane proteins occludin, claudin 1 and claudin 4, JAM-A, and crumbs 3 showed sedimentation profiles in membrane fractions similar to those found in gradients from 3-d-old polarized MDCK cells (Figures 7A and 8A). The majority of claudin 1, 30 and 69%, sedimented in low-density membrane fractions 1-7 (δ 1.013-1.078 g/ml) and 8-16 (δ 1.078-1.158 g/ml), respectively, and 34% of claudin 4 in membrane fractions 1-7 and 66% in membrane fractions 8-16. Occludin had a different sedimentation profile than that of claudins, with 46% localized in membrane fractions 12-18 (δ 1.114-1.182 g/ml). Twenty-nine percent of JAM-A sedimented in high-density membrane fractions 16-20 (δ1.158-1.201 g/ml) and 70% in membrane fractions 21-25 (δ 1.214-1.381 g/ml), and 88% of crumbs 3 in membrane fractions 21-23 (δ 1.214-1.269 g/ml) (Table 2B). By immunofluorescence, claudin 1, claudin 4, and JAM-A had different cellular localizations compared with those in polarized MDCK cells. Claudin 1, claudin 4, and JAM-A were colocalized with ZO-1 at cell-cell contacts, but they were also present in intracellular puncta (Figure 7B, I-VI, and Video 7B, II, III, and VI). Lateral membrane staining could not be detected for these proteins at this stage of AJC assembly.
Figure 7.
Transmembrane proteins (A and B) and adherens junction proteins (C and D) during formation of the AJC (6 h after cell-cell adhesion). MDCK cells were grown as confluent monolayers on Transwell filters for 6 h after cell-cell adhesion. (A and C) 10-20-30% iodixanol gradient. After separation of fraction samples by SDS-PAGE followed by immunoblotting, signal intensity for each protein band was determined as integrated intensity (counts/mm2) and expressed as percentage of the sum of integrated intensities in fractions 1-25 (see Materials and Methods for details). In the 3-D graph, the y-axis (arbitrary units) is omitted to increase clarity of the graphical display. (B and D) Immunofluorescence. II/III/VI/VII are 3-D reconstructions of confocal z-stacks in a 45°-angled view. I/IV/V/VIII are z-sections of corresponding 3-D reconstructions. Bar, 5 μm.
Figure 8.
Tight junctional (A and B) and polarity proteins (C and D) during formation of the AJC (6 h after cell-cell adhesion). MDCK cells were grown as confluent monolayers on Transwell filters for 6 h after cell-cell adhesion. (A and C) 10-20-30% iodixanol gradient. After separation of fraction samples by SDS-PAGE followed by immunoblotting, signal intensity for each protein band was determined as integrated intensity (counts/mm2) and expressed as percentage of the sum of integrated intensities in fractions 1-25 (see Materials and Methods for details). In the 3-D graph, the y-axis (arbitrary units) is omitted to increase clarity of the graphical display. (B and D) Immunofluorescence. II/III/VI are 3-D reconstructions of confocal z-stacks in a 45°-angled view. I/IV/V are z-sections of corresponding 3-D reconstructions. Bar, 5 μm.
The tight junction-associated scaffolding proteins ZO-1, ZO-2, and cingulin had sedimentation profiles in gradients during AJC formation that were different from those from polarized MDCK cells. The majority of ZO-1 (54%) and 45% of ZO-2 cosedimented with the majority of occludin in membrane fractions 11-16 (δ 1.108-1.158 g/ml) from forming AJC. The proportion of each protein is similar in these membranes, suggesting their interaction in a complex. Sixty-six percent of cingulin cofractionated with JAM-A in higher density membrane fractions 17-23 (δ 1.170-1.269 g/ml) (Figure 8A and Table 2A). The separation of tight junction scaffolding proteins into different subcomplexes, as indicated by iodixanol gradients, is not so obvious by immunofluorescence. ZO-1, ZO-2, and cingulin colocalized 6 h after cell-cell contact formation similar to their distribution in polarized epithelia (Figures 3B and 8B and Video 8B, II, III, and VI).
During formation of the tight junction barrier, ZO-1 and ZO-2 mostly localized to occludin-containing membrane fractions (Figures 9C and 10). Between 9 and 12 h after initiation of cell-cell contacts, when the barrier has formed (Supplemental Figure 2), more ZO-1 cosedimented in high-density membrane fractions around fraction 21 with JAM-A. Note that this trend continued in polarized MDCK cells grown for 10 d on filters from which all of ZO-1 and ZO-2 was found in high-density membrane fractions that were distinct from those containing occludin and claudin (Figures 9C and 10).
Adherens Junction Proteins during the Formation of the AJC
During formation of the AJC 6 h after the initiation of cell-cell contacts, 62% of E-cadherin, 64% of β-catenin, and 48% of α-catenin cosedimented in membrane fractions 10-16 (δ 1.097-1.158 g/ml) (Figure 7C and Table 1C). In contrast to polarized epithelia, half of the l-afadin protein cofractionated with the cadherin/catenin complex in membrane fractions 10-16 (Figure 7C and Table 2C). The relative amount of l-afadin in membrane fractions 10-16 increased between 3 and 9 h after initiation of cell-cell adhesion. However, it was found primarily in high-density membrane fractions distinct from those containing the cadherin/catenin complex, which maintained a similar distribution in the iodixanol gradient during AJC assembly and in cells that have polarized (Figure 10 and Supplemental Figure 3, A and B). Concurrent with changes in its sedimentation profiles, a difference in l-afadin localization at the membrane was seen by immunofluorescence. Six hours after cell-cell adhesion, l-afadin localized along the lateral membrane with the cadherin/catenin complex, but also colocalized with ZO-1 at the apical tip of the lateral membrane (Figure 7D and Video 7D, II, III, VI, and VII), whereas in polarized cells l-afadin was confined to the AJC (Figure 4B and Video 4B, VII). Changes in l-afadin sedimentation profiles in density gradients may reflect these changes in membrane localization, and they demonstrate that l-afadin is in at least two separate protein complexes that dynamically change during the formation of the AJC.
Polarity Proteins during the Formation of the AJC
Functional data show that the PAR-3/PAR-6/aPKC complex and the crumbs 3/PATJ/Pals complex play important roles in tight junction formation and cell polarity (Roh and Margolis, 2003). Both complexes have been reported to interact with each other via PAR-6/Pals or PAR-6/crumbs 3 (Hurd et al., 2003; Lemmers et al., 2004). In iodixanol gradients 6 h after the initiation of cell-cell contacts, the PAR proteins were separated in different membrane peaks, indicating that they are part of different membrane protein complexes. In membrane fractions 16-20 (δ 1.158-1.201 g/ml), 41% of PAR-6a, and 51% of PAR-6b cosedimented with 37% of aPKC, 51% of PAR-3 (100 kDa), and 29% of JAM-A, but not with crumbs 3. In a separate peak in membrane fractions 21-23 (δ 1.214-1.269 g/ml), where 88% of crumbs 3 sedimented, PAR-6 and PAR-3 also formed a distinct peak (Figure 8, C and D, Table 2B, and Video 8D, II, III, and VI). These polarity proteins have been shown to be active early during AJC formation. Functional studies demonstrated that genetic mutations of these proteins do not have an effect on cell polarity after the tight junction barrier has been formed (Ohno, 2001). Interestingly, at 3 h after the initiation of cell-cell contacts, some of crumbs 3, PAR-6, PAR-3, aPKC, and JAM-A cosedimented around fraction 14 in iodixanol gradients (Figure 11A).
DISCUSSION
The AJC consists of a large number of proteins that are potentially interconnected into a very complex protein network (Figure 1). Biochemical and genetic studies that have searched for specific protein-protein interactions support the possibility of a complex protein network, but it is unclear whether all of these interactions exist in AJC membranes from the same cell. The purpose of the present study was to use an unbiased approach, in terms of not selecting specific proteins to examine, to determine the distribution of membrane substructures and proteins of the AJC in MDCK epithelial cells at different times during development of cell polarity. It is possible that protein complexes, and hence membrane substructures, would be disrupted during cell and membrane fractionation. This might give rise artificially to the appearance of distinct membrane subcomplexes rather than the even more complex organization of junctional structures indicated by the range of protein-protein interactions summarized in Figure 1. We sought to address this problem by first cross-linking proteins with the bifunctional reagent DSP before cell fractionation. Second, we used a ball-bearing homogenizer to break cells in isotonic buffer without detergents under consistent and controlled conditions, and iodixanol gradients to separate membranes. Third, we correlated the cosedimentation of proteins in membranes with the distribution of those proteins in cells by using three-dimensional reconstruction of high-resolution immunofluorescence images. The results of this approach reveal clear separation of distinct membrane substructures of the AJC, indicating a more simple organization of the AJC (Figure 12) than that predicted from the combination of all possible protein-protein interactions (Figure 1). The cosedimentation of proteins in these separate membrane substructures is in agreement with known interactions between these proteins, and therefore we did not seek to reconfirm these interactions by immunoprecipitation.
Figure 12.
Protein distributions in distinct membrane substructures of the apical junctional complex in polarized epithelia.
Confocal immunofluorescence microscopy coupled with three-dimensional reconstruction resolved the distributions of major transmembrane proteins of the AJC between the lateral membrane, the boundary of the lateral and apical membranes (AJC), and the apical membrane of fully polarized MDCK cells. E-cadherin and claudins were located down the lateral membrane to the base of the cell, with some staining detected at the AJC. Some JAM-A also was detected on the lateral membrane, but the strongest staining was found at the AJC. Afadin/nectin and occludin were restricted to the AJC. Crumbs 3 was localized over the apical membrane with some concentration at the AJC. The similarities and differences in distributions of these major transmembrane proteins were reflected in the separation of different membrane substructures of the AJC in iodixanol gradients.
The results from iodixanol gradient separation of membranes reveals that the majority of JAM-A, crumbs 3, occludin, and claudins 1 and 4 are in membrane substructures that have different sedimentation properties from each other consistent with differences in their membrane distributions. Some overlap in sedimentation properties of ∼20% of claudins in membrane fractions containing occludin is found, which is consistent with colocalization of some claudins and occludin in the AJC. It is interesting to note, however, that claudins can form tight junction strands on their own and are internalized from tight junctions into vesicles free of occludin or JAM during dynamic remodeling in epithelial cells (Furuse et al., 1998; Matsuda et al., 2004). The role of occludin in tight junction strand formation and maintenance at the AJC is not clear. The mouse knockout of occludin shows that occludin is not necessary for tight junction strand formation and barrier function (Saitou et al., 1998, 2000). These observations indicate that occludin and claudin 1/4 may be part of separate protein complexes. It will be interesting to see whether other members of the large claudin family (Tsukita and Furuse, 2002) are part of different subcomplexes and how they distribute in density gradients in relationship to occludin and claudin 1/4.
Our study suggests that the majority of ZO-1 is associated with a JAM-A membrane complex in polarized MDCK cells and is potentially in a complex with afadin, α-catenin, and/or cingulin. Surprisingly, very little of ZO-1 and ZO-2 cosedimented with either occludin- or claudin-containing membranes. The lack of ZO-1/ZO-2 in membranes containing claudins suggests that they may not be required for claudin-mediated strand formation. This is supported by the finding that claudin-GFP chimeras, in which the PDZ domain (ZO-1/ZO-2) binding site is masked, form intramembrane strands similar to those in tight junctions (Sasaki et al., 2003), indicating that binding of claudins and ZO-1/2 is not required for claudin assembly and organization of tight junction strands.
l-Afadin interacts with several proteins (Figure 1), with the cadherin/catenin complex at the adherens junction being one of them. Nectin/afadin seems to be closely associated with the formation of the adherens junction (Honda et al., 2003). Nectin can interact with the cadherin/catenin complex via afadin and α-catenin. The data in this study confirm the idea that the nectin/afadin and cadherin/catenin complex are closely associated during junction assembly, but they also demonstrate that l-afadin may not be part of the cadherin/catenin complex in polarized epithelia. Our data indicate that afadin is part of a membrane complex other than the cadherin/catenin complex in polarized MDCK cells. This could be a JAM-A/ZO-1/α-catenin complex as l-afadin cosediments with membranes containing these proteins (Figure 12). Endogenous nectin has been reported to partially cosediment with E-cadherin in 10-20-30% iodixanol gradients (Yeaman et al., 2004), but MDCK II cells were not cross-linked which changes the distribution pattern of surface biotinylated proteins (Yeaman, 2003).
It is thought that the nectin/afadin complex is important for recruitment of JAM to sites of cell-cell adhesion, perhaps via afadin and ZO-1 (Fukuhara et al., 2002). Recruitment of JAM to the site of cell-cell contacts occurs rapidly during the first hour after the initiation of cell-cell contacts (Fukuhara et al., 2002). Interestingly, 3 h after cell-cell adhesion some JAM-A cofractionated with membranes containing E-cadherin, β- and α-catenin, l-afadin, and ZO-1 (Figure 10A).
By immunofluorescence microscopy, we found that crumbs 3 is localized on the apical membrane, whereas JAM-A, PAR-3, PAR-6, and aPKC are more confined to the AJC. The crumbs 3 and JAM-A membrane complexes are very dense and did not float up but remained in the bottom fractions where the cell homogenate was underlayered in the iodixanol gradient. However, these complexes from the bottom fractions could be separated by sedimentation when overlayered on top of a second 10-20-30% iodixanol gradient. This result shows clearly that crumbs 3 and JAM-A are not part of the same membrane substructure, which is consistent with the results of immunofluorescence microscopy. This second iodixanol gradient separation of membranes revealed that PAR-3 and some of PAR-6 a/b are in membranes containing either crumbs 3 or JAM-A. By immunofluorescence, the localization of PAR-3 is restricted to the AJC, whereas crumbs 3 localizes to the AJC and throughout the apical membrane. The data suggest that some of crumbs 3 is potentially in a complex with PAR-3 at the AJC, whereas the majority of crumbs 3 is localized at the apical membrane independent of PAR-3. The iodixanol gradients were not able to distinguish between the two crumbs 3 subpopulations. It is important to note that the gradients are displayed in relative amounts and do not contain information about protein stoichiometry. The remainder of PAR-6 a/b cosedimented with membranes containing claudin 1 and occludin (Figures 1 and 2A); although the binding partners are not identified in this study, one possibility is that PAR-6 binds Pals 1, which interacts with claudin 1 (Roh et al., 2002b). PAR-6a could indirectly interact with occludin via aPKC, which was found to interact with the coiled-coil domain of occludin (Nusrat et al., 2000), to connect to membranes in fractions 12-16.
The development of cell polarity is a dynamic process (Nelson, 2003), and we showed that sorting of proteins into different substructures during this process can be followed based on membrane sedimentation in iodixanol gradients. Note that well-known marker proteins of the apical (gp135) and basal-lateral (Na/K-ATPase) membranes gradually separated into different membrane fractions in the iodixanol gradient at different times during development of cell polarity. Interestingly, at 3 h most of the AJC proteins analyzed cosedimented in two major peaks around fraction 14 and 21, respectively. Some of the proteins initially found in the peak fraction 14 remained in membranes of that density (e.g., E-cadherin and occludin), whereas others separated into more buoyant membranes (e.g., claudins) or more dense membranes (e.g., afadin and ZO-1). That occludin and E-cadherin are in cosedimenting membrane fractions could indicate that they are the same membrane substructure. However, immunofluorescence reveals that occludin is confined to the AJC, whereas E-cadherin is localized down the lateral membrane. The most likely explanation for the similarity in the sedimentation characteristics of occludin- and E-cadherin-containing membranes is that they are distinct substructures but that they have, fortuitously, similar densities. Membranes initially present in the peak fraction 21 comprised JAM-A and crumbs 3 and their associated PAR complexes. Significantly, we detected subtle changes in the distributions of the JAM-A and crumbs 3 membranes into two closely associated peaks (19 and 21, respectively), which could be separated in a second gradient into two distinct membrane substructures.
During the sorting out process after cell-cell adhesion, scaffolding proteins ZO-1, ZO-2 and afadin cosedimented with different membrane proteins at different stages of the process implying that they are part of distinct membrane complexes during AJC assembly. For example, the majority of ZO-1 was initially present in peak fraction 14 together with E-cadherin, occludin, and claudins, but by 9 h after cell-cell adhesion the majority of ZO-1 was found in denser membranes that cosedimented with JAM-A. Similarly, there was a gradual shift in the distribution of afadin from peak fraction 14 to 21 during this time. These complexes may be important, therefore, for formation of different substructures of the AJC, and perhaps localized recruitment and sorting of proteins or signaling events (Matter and Balda, 2003). Stepwise interactions of proteins during AJC assembly seem to be hijacked by microbial pathogens to enter cells (Vogelmann et al., 2004). For example, the CagA protein of H. pylori interacts with, and disrupts the tight junction of MDCK cells and may be targeted there by stepwise interactions between JAM-A and occludin through ZO-1 (Amieva et al., 2003).
The data presented here on membrane substructures of the AJC provide an unbiased approach to examining how different protein complexes are assembled and regulated. This approach also may provide a foundation for a large-scale proteomics approach to identify additional components of protein complexes localized to these different AJC substructures
Supplementary Material
Acknowledgments
We thank Naima Bridges for technical support. This work was supported by a Walter V. and Idun Y. Berry Fellowship (to R. V.), Deutsche Forschungsgemeinschaft Fellowship VO 864/1-1 (to R. V.), a Junior investigator award from the Stanford Digestive Disease Center (DDC DK56339; to R. V. and W.J.N.), and National Institutes of Health R01 GM35227 (to W.J.N.).
Article published online ahead of print in MBC in Press on November 17, 2004 (http://www.molbiolcell.org/cgi/doi/10.1091/mbc.E04-09-0827).
The online version of this article contains supplemental material at MBC Online (http://www.molbiolcell.org).
References
- Aberle, H., Butz, S., Stappert, J., Weissig, H., Kemler, R., and Hoschuetzky, H. (1994). Assembly of the cadherin-catenin complex in vitro with recombinant proteins. J. Cell Sci. 107, 3655-3663. [DOI] [PubMed] [Google Scholar]
- Amieva, M. R., Vogelmann, R., Covacci, A., Tompkins, L. S., Nelson, W. J., and Falkow, S. (2003). Disruption of the epithelial apical-junctional complex by Helicobacter pylori CagA. Science 300, 1430-1434. [DOI] [PMC free article] [PubMed] [Google Scholar]
- Anderson, J. M., Van Itallie, C. M., and Fanning, A. S. (2004). Setting up a barrier at the apical junction complex. Curr. Opin. Cell Biol. 16, 140-145. [DOI] [PubMed] [Google Scholar]
- Bazzoni, G., Martinez-Estrada, O. M., Orsenigo, F., Cordenonsi, M., Citi, S., and Dejana, E. (2000). Interaction of junctional adhesion molecule with the tight junction components ZO-1, cingulin, and occludin. J. Biol. Chem. 275, 20520-20526. [DOI] [PubMed] [Google Scholar]
- Brajenovic, M., Joberty, G., Kuster, B., Bouwmeester, T., and Drewes, G. (2004). Comprehensive proteomic analysis of human Par protein complexes reveals an interconnected protein network. J. Biol. Chem. 279, 12804-12811. [DOI] [PubMed] [Google Scholar]
- Cordenonsi, M., D'Atri, F., Hammar, E., Parry, D. A., Kendrick-Jones, J., Shore, D., and Citi, S. (1999). Cingulin contains globular and coiled-coil domains and interacts with ZO-1, ZO-2, ZO-3, and myosin. J. Cell Biol. 147, 1569-1582. [DOI] [PMC free article] [PubMed] [Google Scholar]
- D'Atri, F., Nadalutti, F., and Citi, S. (2002). Evidence for a functional interaction between cingulin and ZO-1 in cultured cells. J. Biol. Chem. 277, 27757-27764. [DOI] [PubMed] [Google Scholar]
- Ebnet, K., Aurrand-Lions, M., Kuhn, A., Kiefer, F., Butz, S., Zander, K., Meyer zu Brickwedde, M. K., Suzuki, A., Imhof, B. A., and Vestweber, D. (2003). The junctional adhesion molecule (JAM) family members JAM-2 and JAM-3 associate with the cell polarity protein PAR-3, a possible role for JAMs in endothelial cell polarity. J. Cell Sci. 116, 3879-3891. [DOI] [PubMed] [Google Scholar]
- Ebnet, K., Schulz, C. U., Meyer Zu Brickwedde, M. K., Pendl, G. G., and Vestweber, D. (2000). Junctional adhesion molecule interacts with the PDZ domain-containing proteins AF-6 and ZO-1. J. Biol. Chem. 275, 27979-27988. [DOI] [PubMed] [Google Scholar]
- Ebnet, K., Suzuki, A., Horikoshi, Y., Hirose, T., Meyer Zu Brickwedde, M. K., Ohno, S., and Vestweber, D. (2001). The cell polarity protein ASIP/PAR-3 directly associates with junctional adhesion molecule (JAM). EMBO J. 20, 3738-3748. [DOI] [PMC free article] [PubMed] [Google Scholar]
- Ebnet, K., Suzuki, A., Ohno, S., and Vestweber, D. (2004). Junctional adhesion molecules (JAMs): more molecules with dual functions? J. Cell Sci. 117, 19-29. [DOI] [PubMed] [Google Scholar]
- Fanning, A. S., Jameson, B. J., Jesaitis, L. A., and Anderson, J. M. (1998). The tight junction protein ZO-1 establishes a link between the transmembrane protein occludin and the actin cytoskeleton. J. Biol. Chem. 273, 29745-29753. [DOI] [PubMed] [Google Scholar]
- Farquhar, M. G., and Palade, G. E. (1963). Junctional complexes in various epithelia. J. Cell Biol. 17, 375-412. [DOI] [PMC free article] [PubMed] [Google Scholar]
- Fukuhara, A., et al. (2002). Involvement of nectin in the localization of junctional adhesion molecule at tight junctions. Oncogene 21, 7642-7655. [DOI] [PubMed] [Google Scholar]
- Furuse, M., Fujita, K., Hiiragi, T., Fujimoto, K., and Tsukita, S. (1998). Claudin-1 and-2, novel integral membrane proteins localizing at tight junctions with no sequence similarity to occludin. J. Cell Biol. 141, 1539-1550. [DOI] [PMC free article] [PubMed] [Google Scholar]
- Furuse, M., Itoh, M., Hirase, T., Nagafuchi, A., Yonemura, S., and Tsukita, S. (1994). Direct association of occludin with ZO-1 and its possible involvement in the localization of occludin at tight junctions. J. Cell Biol. 127, 1617-1626. [DOI] [PMC free article] [PubMed] [Google Scholar]
- Gumbiner, B., and Simons, K. (1986). A functional assay for proteins involved in establishing an epithelial occludin barrier: identification of a uvomorulin-like polypeptide. J. Cell Biol. 102, 457-468. [DOI] [PMC free article] [PubMed] [Google Scholar]
- Haskins, J., Gu, L., Wittchen, E. S., Hibbard, J., and Stevenson, B. R. (1998). ZO-3, a novel member of the MAGUK protein family found at the tight junction, interacts with ZO-1 and occludin. J. Cell Biol. 141, 199-208. [DOI] [PMC free article] [PubMed] [Google Scholar]
- Hinck, L., Nelson, W. J., and Papkoff, J. (1994). Wnt-1 modulates cell-cell adhesion in mammalian cells by stabilizing beta-catenin binding to the cell adhesion protein cadherin. J. Cell Biol. 124, 729-741. [DOI] [PMC free article] [PubMed] [Google Scholar]
- Honda, T., Shimizu, K., Kawakatsu, T., Yasumi, M., Shingai, T., Fukuhara, A., Ozaki-Kuroda, K., Irie, K., Nakanishi, H., and Takai, Y. (2003). Antagonistic and agonistic effects of an extracellular fragment of nectin on formation of E-cadherin-based cell-cell adhesion. Genes Cells 8, 51-63. [DOI] [PubMed] [Google Scholar]
- Hurd, T. W., Gao, L., Roh, M. H., Macara, I. G., and Margolis, B. (2003). Direct interaction of two polarity complexes implicated in epithelial tight junction assembly. Nat. Cell Biol. 5, 137-142. [DOI] [PubMed] [Google Scholar]
- Imamura, Y., Itoh, M., Maeno, Y., Tsukita, S., and Nagafuchi, A. (1999). Functional domains of alpha-catenin required for the strong state of cadherin-based cell adhesion. J. Cell Biol. 144, 1311-1322. [DOI] [PMC free article] [PubMed] [Google Scholar]
- Itoh, M., Furuse, M., Morita, K., Kubota, K., Saitou, M., and Tsukita, S. (1999a). Direct binding of three tight junction-associated MAGUKs, ZO-1, ZO-2, and ZO-3, with the COOH termini of claudins. J. Cell Biol. 147, 1351-1363. [DOI] [PMC free article] [PubMed] [Google Scholar]
- Itoh, M., Morita, K., and Tsukita, S. (1999b). Characterization of ZO-2 as a MAGUK family member associated with tight as well as adherens junctions with a binding affinity to occludin and alpha catenin. J. Biol. Chem. 274, 5981-5986. [DOI] [PubMed] [Google Scholar]
- Itoh, M., Nagafuchi, A., Moroi, S., and Tsukita, S. (1997). Involvement of ZO-1 in cadherin-based cell adhesion through its direct binding to alpha catenin and actin filaments. J. Cell Biol. 138, 181-192. [DOI] [PMC free article] [PubMed] [Google Scholar]
- Itoh, M., Sasaki, H., Furuse, M., Ozaki, H., Kita, T., and Tsukita, S. (2001). Junctional adhesion molecule (JAM) binds to PAR-3, a possible mechanism for the recruitment of PAR-3 to tight junctions. J. Cell Biol. 154, 491-497. [DOI] [PMC free article] [PubMed] [Google Scholar]
- Itoh, M., Yonemura, S., Nagafuchi, A., and Tsukita, S. (1991). A 220-kD undercoat-constitutive protein: its specific localization at cadherin-based cell-cell adhesion sites. J. Cell Biol. 115, 1449-1462. [DOI] [PMC free article] [PubMed] [Google Scholar]
- Izumi, Y., Hirose, T., Tamai, Y., Hirai, S., Nagashima, Y., Fujimoto, T., Tabuse, Y., Kemphues, K. J., and Ohno, S. (1998). An atypical protein kinase C (PKC) directly associates and colocalizes at the epithelial tight junction with ASIP, a mammalian homologue of Caenorhabditis elegans polarity protein PAR-3. J. Cell Biol. 143, 95-106. [DOI] [PMC free article] [PubMed] [Google Scholar]
- Joberty, G., Petersen, C., Gao, L., and Macara, I. G. (2000). The cell-polarity protein Par6 links Par3 and atypical PKC to Cdc42. Nat. Cell Biol. 2, 531-539. [DOI] [PubMed] [Google Scholar]
- Johansson, A., Driessens, M., and Aspenstrom, P. (2000). The mammalian homologue of the Caenorhabditis elegans polarity protein PAR-6 is a binding partner for the P GTPases Cdc42 and Rac1. J. Cell Sci. 113, 3267-3275. [DOI] [PubMed] [Google Scholar]
- Jou, T. S., Schneeberger, E. E., and Nelson, W. J. (1998). Structural and functional regulation of tight junctions by RhoA and Rac1 small GTPases. J. Cell Biol. 142, 101-115. [DOI] [PMC free article] [PubMed] [Google Scholar]
- Jou, T. S., Stewart, D. B., Stappert, J., Nelson, W. J., and Marrs, J. A. (1995). Genetic and biochemical dissection of protein linkages in the cadherin-catenin complex. Proc. Natl. Acad. Sci. USA 92, 5067-5071. [DOI] [PMC free article] [PubMed] [Google Scholar]
- Knust, E., and Bossinger, O. (2002). Composition and formation of intercellular junctions in epithelial cells. Science 298, 1955-1959. [DOI] [PubMed] [Google Scholar]
- Laemmli, U. K. (1970). Cleavage of structural proteins during the assembly of the head of bacteriophage T4. Nature 227, 680-685. [DOI] [PubMed] [Google Scholar]
- Lemmers, C., Medina, E., Delgrossi, M. H., Michel, D., Arsanto, J. P., and Le Bivic, A. (2002). hINADl/PATJ, a homolog of discs lost, interacts with crumbs and localizes to tight junctions in human epithelial cells. J. Biol. Chem. 277, 25408-25415. [DOI] [PubMed] [Google Scholar]
- Lemmers, C., Michel, D., Lane-Guermonprez, L., Delgrossi, M. H., Medina, E., Arsanto, J. P., and Le Bivic, A. (2004). CRB3 binds directly to Par6 and regulates the morphogenesis of the tight junctions in mammalian epithelial cells. Mol. Biol. Cell 15, 1324-1333. [DOI] [PMC free article] [PubMed] [Google Scholar]
- Lin, D., Edwards, A. S., Fawcett, J. P., Mbamalu, G., Scott, J. D., and Pawson, T. (2000). A mammalian PAR-3-PAR-6 complex implicated in Cdc42/Rac1 and aPKC signalling and cell polarity. Nat. Cell Biol. 2, 540-547. [DOI] [PubMed] [Google Scholar]
- Makarova, O., Roh, M. H., Liu, C. J., Laurinec, S., and Margolis, B. (2003). Mammalian Crumbs3 is a small transmembrane protein linked to protein associated with Lin-7 (Pals1). Gene 302, 21-29. [DOI] [PubMed] [Google Scholar]
- Mandell, K. J., McCall, I. C., and Parkos, C. A. (2004). Involvement of the junctional adhesion molecule-1 (JAM1) homodimer interface in regulation of epithelial barrier function. J. Biol. Chem. 279, 16254-16262. [DOI] [PubMed] [Google Scholar]
- Matsuda, M., Kubo, A., Furuse, M., and Tsukita, S. (2004). A peculiar internalization of claudins, tight junction-specific adhesion molecules, during the intercellular movement of epithelial cells. J. Cell Sci. 117, 1247-1257. [DOI] [PubMed] [Google Scholar]
- Matter, K., and Balda, M. S. (2003). Signalling to and from tight junctions. Nat. Rev. Mol. Cell. Biol. 4, 225-236. [DOI] [PubMed] [Google Scholar]
- Nelson, W. J. (2003). Adaptation of core mechanisms to generate cell polarity. Nature 422, 766-774. [DOI] [PMC free article] [PubMed] [Google Scholar]
- Nelson, W. J., and Veshnock, P. J. (1987). Ankyrin binding to (Na+ + K+)ATPase and implications for the organization of membrane domains in polarized cells. Nature 328, 533-536. [DOI] [PubMed] [Google Scholar]
- Nusrat, A., Chen, J. A., Foley, C. S., Liang, T. W., Tom, J., Cromwell, M., Quan, C., and Mrsny, R. J. (2000). The coiled-coil domain of occludin can act to organize structural and functional elements of the epithelial tight junction. J. Biol. Chem. 275, 29816-29822. [DOI] [PubMed] [Google Scholar]
- Ohno, S. (2001). Intercellular junctions and cellular polarity: the PAR-aPKC complex, a conserved core cassette playing fundamental roles in cell polarity. Curr. Opin. Cell Biol. 13, 641-648. [DOI] [PubMed] [Google Scholar]
- Ojakian, G. K., and Schwimmer, R. (1988). The polarized distribution of an apical cell surface glycoprotein is maintained by interactions with the cytoskeleton of Madin-Darby canine kidney cells. J. Cell Biol. 107, 2377-2387. [DOI] [PMC free article] [PubMed] [Google Scholar]
- Piepenhagen, P. A., Peters, L. L., Lux, S. E., and Nelson, W. J. (1995). Differential expression of Na(+)-K(+)-ATPase, ankyrin, fodrin, and E-cadherin along the kidney nephron. Am. J. Physiol. 269, C1417-C1432. [DOI] [PubMed] [Google Scholar]
- Pokutta, S., Drees, F., Takai, Y., Nelson, W. J., and Weis, W. I. (2002). Biochemical and structural definition of the l-afadin- and actin-binding sites of alpha-catenin. J. Biol. Chem. 277, 18868-18874. [DOI] [PMC free article] [PubMed] [Google Scholar]
- Qiu, R. G., Abo, A., and Steven, M. G. (2000). A human homolog of the C. elegans polarity determinant Par-6 links Rac and Cdc42 to PKCzeta signaling and cell transformation. Curr. Biol. 10, 697-707. [DOI] [PubMed] [Google Scholar]
- Reymond, N., Fabre, S., Lecocq, E., Adelaide, J., Dubreuil, P., and Lopez, M. (2001). Nectin4/PRR4, a new afadin-associated member of the nectin family that trans-interacts with nectin1/PRR1 through V domain interaction. J. Biol. Chem. 276, 43205-43215. [DOI] [PubMed] [Google Scholar]
- Roh, M. H., Liu, C. J., Laurinec, S., and Margolis, B. (2002a). The carboxyl terminus of zona occludens-3 binds and recruits a mammalian homologue of discs lost to tight junctions. J. Biol. Chem. 277, 27501-27509. [DOI] [PubMed] [Google Scholar]
- Roh, M. H., Makarova, O., Liu, C. J., Shin, K., Lee, S., Laurinec, S., Goyal, M., Wiggins, R., and Margolis, B. (2002b). The Maguk protein, Pals1, functions as an adapter, linking mammalian homologues of Crumbs and Discs Lost. J. Cell Biol. 157, 161-172. [DOI] [PMC free article] [PubMed] [Google Scholar]
- Roh, M. H., and Margolis, B. (2003). Composition and function of PDZ protein complexes during cell polarization. Am. J. Physiol. 285, F377-F387. [DOI] [PubMed] [Google Scholar]
- Saitou, M., Fujimoto, K., Doi, Y., Itoh, M., Fujimoto, T., Furuse, M., Takano, H., Noda, T., and Tsukita, S. (1998). Occludin-deficient embryonic stem cells can differentiate into polarized epithelial cells bearing tight junctions. J. Cell Biol. 141, 397-408. [DOI] [PMC free article] [PubMed] [Google Scholar]
- Saitou, M., Furuse, M., Sasaki, H., Schulzke, J. D., Fromm, M., Takano, H., Noda, T., and Tsukita, S. (2000). Complex phenotype of mice lacking occludin, a component of tight junction strands. Mol. Biol. Cell 11, 4131-4142. [DOI] [PMC free article] [PubMed] [Google Scholar]
- Sasaki, H., Matsui, C., Furuse, K., Mimori-Kiyosue, Y., Furuse, M., and Tsukita, S. (2003). Dynamic behavior of paired claudin strands within apposing plasma membranes. Proc. Natl. Acad. Sci. USA 100, 3971-3976. [DOI] [PMC free article] [PubMed] [Google Scholar]
- Sonoda, N., Furuse, M., Sasaki, H., Yonemura, S., Katahira, J., Horiguchi, Y., and Tsukita, S. (1999). Clostridium perfringens enterotoxin fragment removes specific claudins from tight junction strands: evidence for direct involvement of claudins in tight junction barrier. J. Cell Biol. 147, 195-204. [DOI] [PMC free article] [PubMed] [Google Scholar]
- Suzuki, A., Yamanaka, T., Hirose, T., Manabe, N., Mizuno, K., Shimizu, M., Akimoto, K., Izumi, Y., Ohnishi, T., and Ohno, S. (2001). Atypical protein kinase c is involved in the evolutionarily conserved par protein complex and plays a critical role in establishing epithelia-specific junctional structures. J. Cell Biol. 152, 1183-1196. [DOI] [PMC free article] [PubMed] [Google Scholar]
- Tachibana, K., Nakanishi, H., Mandai, K., Ozaki, K., Ikeda, W., Yamamoto, Y., Nagafuchi, A., Tsukita, S., and Takai, Y. (2000). Two cell adhesion molecules, nectin and cadherin, interact through their cytoplasmic domain-associated proteins. J. Cell Biol. 150, 1161-1176. [DOI] [PMC free article] [PubMed] [Google Scholar]
- Takahashi, K., et al. (1999). Nectin/PRR: an Ig-like cell adhesion molecule recruited to cadherin-based adherens junctions through interaction with Afadin, a PDZ domain-containing protein. J. Cell Biol. 145, 539-549. [DOI] [PMC free article] [PubMed] [Google Scholar]
- Takai, Y., and Nakanishi, H. (2003). Nectin and afadin: novel organizers of intercellular junctions. J. Cell Sci. 116, 17-27. [DOI] [PubMed] [Google Scholar]
- Takekuni, K., Ikeda, W., Fujito, T., Morimoto, K., Takeuchi, M., Monden, M., and Takai, Y. (2003). Direct binding of cell polarity protein PAR-3 to cell-cell adhesion molecule nectin at neuroepithelial cells of developing mouse. J. Biol. Chem. 278, 5497-5500. [DOI] [PubMed] [Google Scholar]
- Tsukita, S., and Furuse, M. (2002). Claudin-based barrier in simple and stratified cellular sheets. Curr. Opin. Cell Biol. 14, 531-536. [DOI] [PubMed] [Google Scholar]
- Tsukita, S., Furuse, M., and Itoh, M. (2001). Multifunctional strands in tight junctions. Nat. Rev. Mol. Cell. Biol. 2, 285-293. [DOI] [PubMed] [Google Scholar]
- Van Aelst, L., and Symons, M. (2002). Role of Rho family GTPases in epithelial morphogenesis. Genes Dev. 16, 1032-1054. [DOI] [PubMed] [Google Scholar]
- Van Itallie, C. M., Fanning, A. S., and Anderson, J. M. (2003). Reversal of charge selectivity in cation or anion-selective epithelial lines by expression of different claudins. Am. J. Physiol. 285, F1078-F1084. [DOI] [PubMed] [Google Scholar]
- Vogelmann, R., Amieva, M. R., Falkow, S., and Nelson, W. J. (2004). Breaking into the epithelial apical-junctional complex-news from pathogen hackers. Curr. Opin. Cell Biol. 16, 86-93. [DOI] [PMC free article] [PubMed] [Google Scholar]
- Yamamoto, T., Harada, N., Kano, K., Taya, S., Canaani, E., Matsuura, Y., Mizoguchi, A., Ide, C., and Kaibuchi, K. (1997). The Ras target AF-6 interacts with ZO-1 and serves as a peripheral component of tight junctions in epithelial cells. J. Cell Biol. 139, 785-795. [DOI] [PMC free article] [PubMed] [Google Scholar]
- Yamanaka, T., Horikoshi, Y., Sugiyama, Y., Ishiyama, C., Suzuki, A., Hirose, T., Iwamatsu, A., Shinohara, A., and Ohno, S. (2003). Mammalian Lgl forms a protein complex with PAR-6 and aPKC independently of PAR-3 to regulate epithelial cell polarity. Curr. Biol. 13, 734-743. [DOI] [PubMed] [Google Scholar]
- Yeaman, C. (2003). Ultracentrifugation-based approaches to study regulation of Sec6/8 (exocyst) complex function during development of epithelial cell polarity. Methods 30, 198-206. [DOI] [PubMed] [Google Scholar]
- Yeaman, C., Grindstaff, K. K., and Nelson, W. J. (2004). Mechanism of recruiting Sec6/8 (exocyst) complex to the apical junctional complex during polarization of epithelial cells. J. Cell Sci. 117, 559-570. [DOI] [PMC free article] [PubMed] [Google Scholar]
Associated Data
This section collects any data citations, data availability statements, or supplementary materials included in this article.