

Abstract
Fringe O-fucose-β1,3-N-acetylglucosaminyltransferases modulate Notch signaling by potentiating signaling induced by Delta-like ligands, while inhibiting signaling induced by Serrate/Jagged1 ligands. Based on binding studies, the differential effects of Drosophila fringe (DFng) on Notch signaling are thought to result from alterations in Notch glycosylation that enhance binding of Delta to Notch but reduce Serrate binding. Here, we report that expression of mammalian fringe proteins (Lunatic [LFng], Manic [MFng], or Radical [RFng] Fringe) increased Delta1 binding and activation of Notch1 signaling in 293T and NIH 3T3 cells. Although Jagged1-induced signaling was suppressed by LFng and MFng, RFng enhanced signaling induced by either Delta1 or Jagged1, underscoring the diversity of mammalian fringe glycosyltransferases in regulating signaling downstream of different ligand-receptor combinations. Interestingly, suppression of Jagged1-induced Notch1 signaling did not correlate with changes in Jagged1 binding as found for Delta1. Our data support the idea that fringe glycosylation increases Delta1 binding to potentiate signaling, but we propose that although fringe glycosylation does not reduce Jagged1 binding to Notch1, the resultant ligand–receptor interactions do not effectively promote Notch1 proteolysis required for activation of downstream signaling events.
INTRODUCTION
The Notch pathway is a highly conserved, ubiquitous signaling system that affects a variety of cell types and cellular processes (Weinmaster, 1997; Artavanis-Tsakonas et al., 1999; Robey and Bluestone, 2004). In fact, most structures within the metazoan body plan seem to require Notch activity at some point in their development. The diverse and often opposite effects attributed to Notch likely reflect cell context differences but a number of modulators and regulators of ligand-induced Notch signaling have been identified that also effect the final outcome. For example, the fringe proteins are a class of potential Notch modulators and studies in vertebrates and flies have identified roles for fringe proteins in compartment or boundary formation that involve fringe-dependent modulation of ligand-induced Notch signaling (Haltiwanger, 2002; Haltiwanger and Stanley, 2002; Haines and Irvine, 2003).
Members of the DSL family are the best characterized Notch ligands, which in vertebrates are composed of two subclasses: Delta-like (Delta1, Delta2, Delta3, and Delta4) and Serrate-like (Serrate1/Jagged1 or Serrate2/Jagged2) (Weinmaster, 1997; Artavanis-Tsakonas et al., 1999). Genetic studies first suggested that DFng differentially affected the ability of Notch ligands to activate Notch signaling (Haines and Irvine, 2003). Functional studies have now provided evidence that fringe proteins potentiate Notch signaling induced by Delta while inhibiting signaling induced by Serrate/Jagged1. Fringe proteins function as b1,3-N-acetyl-glucosaminyltransferases to extend O-fucosylated residues within epidermal growth factor (EGF)-like motifs present in Notch receptors (Moloney et al., 2000) and DSL ligands (Panin et al., 2002), suggesting that fringe modulation of ligand-induced Notch signaling involves glycosylation of either Notch or its ligands. Because fringe proteins are Golgi-resident glycosyltransferases that exert their effects when expressed in the Notch-responding cell, it seems likely that they modulate signaling through glycosylation of Notch. Moreover, studies to date have failed to uncover an effect of fringe glycosylation for any of the DSL ligands.
In contrast to the modulatory role of fringe, there is an absolute requirement for O-fucosyltransferase (O-fucT) in Notch signaling. O-Fucosylation is a prerequisite for fringe glycosylation and losses in O-fucT activity lead to defects in processes regulated by fringe-dependent and -independent Notch signaling in both flies and mice (Okajima and Irvine, 2002; Sasamura et al., 2003; Shi and Stanley, 2003). Although these findings underscore the importance of glycosylation in Notch signaling, the molecular mechanism by which changes in Notch glycosylation alter ligand-induced signaling are not well understood.
Ligand binding to Notch promotes proteolysis of Notch to generate a soluble Notch intracellular domain (NICD) that directly interacts with CSL [CBF1, Su(H), LAG1] transcription factors to regulate expression of Notch target genes (Mumm and Kopan, 2000; Weinmaster, 2000). We have previously speculated that ligand-Notch interactions that promote Notch proteolysis may be altered by fringe glycosylation of Notch such that signaling is either enhanced or inhibited depending on the bound ligand (Hicks et al., 2000). This idea was based on our findings that LFng suppressed signaling induced by Jagged1, even though Jagged1 could still bind Notch1, suggesting that the inhibitory effects of LFng on Jagged1-induced Notch signaling occur after ligand binding. However, binding studies with Drosophila cells have reported that DFng alters binding of Delta or Serrate to Notch such that gains or losses in ligand binding account for gains or losses in Notch signaling (Bruckner et al., 2000; Lei et al., 2003; Okajima et al., 2003). Moreover, one study in mammalian cells reports that losses in Jagged1 binding to Notch2 (N2) in the presence of MFng and to a lesser degree for LFng, correlate with losses in downstream signaling (Shimizu et al., 2001). In contrast to the potentiation in Delta binding and signaling reported for fringe proteins in previous studies (Hicks et al., 2000; Lei et al., 2003; Okajima et al., 2003), MFng neither potentiated Delta1 binding to N2 nor enhanced N2 activation (Shimizu et al., 2001). Therefore, to address the apparent mechanistic differences and potential diversity in modulation of ligand-induced Notch signaling we have further characterized the effects of all three mammalian fringe glycosyltransferases on ligand binding and signaling by the prototypic Notch1 (N1) receptor in response to Delta1 (D1) and Jagged1 (J1).
MATERIALS AND METHODS
DNA Constructs
The plamids encoding Notch1, ZEDN1, FCDN1, SEAP, LFng, MFng, or RFng have been described previously (Shawber et al., 1996; Johnston et al., 1997; Nofziger et al., 1999; Hicks et al., 2000; Bush et al., 2001). To generate N1Δmyc, a XbaI-EcoR V fragment encoding rat N1 residues 1–2098 (Shawber et al., 1996) was subcloned into the ClaI site of pCS2+MT vector to tag N1 at the C-terminal end with six myc epitopes. ZEDN1Δmyc was generated by swapping a BamH I-BsmB I fragment of N1Δmyc with a XbaI-BsmB I fragment from ZEDN1 construct. ZEDN1V/LΔmyc was generated by swapping a BsmB I-Eco47 III fragment of ZEDN1Δmyc with a BsmB I-Eco47 III fragment from N1V/L construct. FCDN1Δmyc was generated by subcloning a XbaI-EcoR V fragment from FCDN1 construct into the ClaI site of pCS2+MT vector. N1GVΔmyc (N1 residues 1–1752/SGPP/GAL4 residues 2–147/VP16 residues 3–80/ISGV/N1 residues 1750–2098/6 myc-epitopes) was generated by swapping a BsmB I-Afe I fragment of N1Δmyc with a BsmB I-Afe I fragment containing the GAL4VP16 domain from construct N1GV (Alison Miyamoto, UCLA). LFADD was generated by mutating residue 198 from D (GAT) to A (GCT) and RFADD was generated by mutating residue 147 from D (GAT) to A (GCT) by using QuikChange site-directed mutagenesis (Stratagene, La-Jolla, CA). TACEea was provided by Carl Blobel, Sloan-Kettering Institute and encodes mouse TNF-α converting enzyme (TACE) in which Glu-406 is mutated to Ala rendering it enzymatically inactive.
Reporter Assays
To measure ligand-induced activation of CSL, 3T3 cells were cotransfected with 100 ng of rat Notch1 (N1) plasmid and 100 ng of either SEAP, LFng-AP (LFng), MFng-AP (MFng), RFng-AP (RFng), LFADD-AP (LFADD), or RFADD-AP (RFADD) plasmid along with 200 ng of CBF-luciferase reporter pJH26 or pGL3JH26 and 50 ng of Renilla luciferase reporter pRLTK (Promega, Madison, WI) constructs in a 35-mm dish by using Lipofectamine (Invitrogen, Carlsbad, CA). After 16 h, the transfected cells were cocultured with either L, D1, or J1 cells for another 24 h and assayed using dual-luciferase reporter assay system (Promega) as described previously (Hicks et al., 2000, 2002). To measure ligand-induced nuclear localization of NICD, 3T3 cells were cotransfected with 25 ng of N1GVΔmyc plasmid and 25 ng of either SEAP, LFng, MFng, or RFng plasmid, along with 100 ng of GAL4-luciferase reporter pG5M2 and 50 ng of pRLTK reporter constructs in a 35-mm dish by using Lipofectamine, cocultured with ligand cells for another 24 h and assayed for luciferase activity. To measure soluble ligand-induced CSL activation, D1Fc, J1Fc, or Fc (1 μg/ml) was preclustered with goat anti-human Fc antibody (1.8 μg/ml) in DMEM for 30 min at room temperature (RT). The medium containing the preclustered soluble ligand was further diluted threefold (0.3 μg/ml final concentration) and adjusted to 10% fetal bovine serum (FBS). The transfected cells in the 35-mm dish were then incubated with preclustered soluble ligand (1 ml) for another 24 h and assayed for luciferase activity.
Cell Surface Biotinylation
293T cells were cotransfected with 1 μg of pBOS-N1 (Shawber et al., 1996; Nofziger et al., 1999; Bush et al., 2001) and 1 μg of either SEAP, LFng, MFng, or RFng plasmids (Johnston et al., 1997) per 60-mm dish by using a standard HEPES-based calcium phosphate precipitation method. After 42 h, the cells were washed three times in cold phosphate-buffered saline (PBS) and then incubated in PBS containing Sulfo-NHS-Biotin (0.5 mg/ml; Pierce Chemical, Rockford, IL) for 30 min at 4°C. Cells were washed once with glycine buffer (20 mM Tris, pH 7.4, 300 mM NaCl, 0.1% bovine serum albumin (BSA), and 100 mM glycine) and incubated in glycine buffer for another 15 min. Cells were then washed once with glycine buffer, twice with PBS, and then lysed with radioimmunoprecipitation assay buffer (50 mM Tris, pH 7.5, 150 mM NaCl, 1% NP-40, 0.5% deoxycholate, and 0.1% SDS) containing protease inhibitors (1 mM phenylmethylsulfonyl fluoride, 10 μg/ml leupeptin, and 10 μg/ml aprotinin). Whole cell lysates (WCL) were cleared by centrifugation at 15,000 × g for 15 min at 4°C and equal amounts of total cell protein, as determined by BCA (Pierce Chemical), were then incubated with streptavdin (SAV)-immobilized beads (Pierce Chemical) at 4°C for 5 h. The SAV precipitates and WCL were analyzed by immunoblotting (IB) with 93-4 (1:3000, rabbit serum raised against rat Notch1 amino acids 2286–2531) or anti-pan cadherin antibody (1:750) followed by horseradish peroxidase (HRP)-conjugated protein A (1:5000; Amersham Biosciences, Piscataway, NJ). To control for cell lysis leading to biotinylation of intracellular proteins the blots were reprobed with anti-dynamin antibodies (Covance, Richmond, CA) at 1:750.
Analysis of Notch1 Proteolytic Fragments
Coculture of ligand- and receptor-presenting cells was set up as follows: 42 h before coculture experiments, 293T cells were cotransfected with 1 μg of N1Δmyc plasmid and 1 μg of either SEAP, LFng, MFng, or RFng in a 60-mm dish using a standard HEPES-based calcium phosphate precipitation method. Parental L cells, D1 cells, and J1 cells, seeded to be subconfluent (∼90%) 14 h before coculture, were trypsinized and reseeded on bacterial plates. At the time of coculture, parental L cells, D1 cells, and J1 cells were removed by triteration in DMEM + 10% FBS and overlaid on transfected 293T cells at a density of 4.5 × 10⁶ cells per 60-mm dish. The proteasome inhibitor MG132 (N-CBZ-Leu-Leu-Leu-AL 10 μM; Sigma-Aldrich) and/or γ-secretase inhibitor DAPT (N-S-phenyl-glycine-t-butyl ester, 50 μM; Calbiochem, San Diego, CA) was added to culture medium at the start of coculture. Cocultures were incubated for 5 h at 37°C and lysed in Triton X buffer (50 mM HEPES, pH 7.5, 150 mM NaCl, 1.5 mM MgCl2, 1 mM EGTA, 10% glycerol, and 1% Triton X-100) containing protease inhibitors and phosphatase inhibitors (1 mM sodium vanadate and 20 mM β-glycerophosphate). WCLs were cleared and equal amounts of total cell protein, as determined by Bradford assay (Bio-Rad, Hercules, CA), were immunoprecipited (IPd) with 9E10 (1.5 μg/lysate) and analyzed either by immunoblotting (IB) with 9E10 (0.5 μg/ml; Santa Cruz Biotechnology, Santa Cruz, CA) followed by HRP-conjugated goat anti-mouse secondary antibody (1:5000; Amersham Biosciences) or N1Val1744 (1:750; Cell signaling Technology, Beverly, MA) followed by HRP-conjugated protein A (1:2500; Amersham Biosciences). Bound immune-complexes were detected using the ECL Plus Western blotting detection system (Amersham Biosciences) and quantitated with a Typhoon 9410 scanner (Amersham Biosciences) by using the excitation filter at 430 nm and emission filter at 503 nm and Imagequant software.
EDTA Treatment of Cells
Cells were treated with EDTA as described previously (Rand et al., 2000). Briefly, the cells were washed once with PBS and either kept in Hanks' balanced salt solution (minus EDTA) or treated with PBS containing the indicated EDTA concentration for 15 min at room temperature. The PBS/EDTA solution was replaced with DMEM + 10% FBS, and the cells were further incubated at 37°C for 15 min, lysed in Triton-X buffer, IPd with 9E10, and analyzed by IB with 9E10. To measure EDTA-induced CSL activation, 3T3 cells were cotransfected with rat N1N1 and either SEAP or LFng along with pJH26 and pRLTK reporter constructs and incubated in DMEM + 10% FBS for 8 h before assaying for luciferase activity.
Measurement of Alkaline Phosphatase (AP) Activity
293T cells were either mock transfected (no plasmid, Mock) or transfected with SEAP, LFng, LFADD, RFng, or RFADD. Conditioned media (CM) was collected 48 h posttransfection, and cells were lysed in 1× passive lysis buffer (Promega). WCLs were heated at 65°C for 10 min to inactivate endogenous AP activity, and equal volumes of WCL (1/5V) or CM (1/40V) were incubated with 1 ml of reaction buffer (100 mM sodium bicarbonate, pH 10, 0.5 mM MgCl2, and 2.69 mM p-nitrophenyl phosphate) at room temperature for the time period indicated in Figure 1B. The AP activity is expressed as absorbance at 405 nm normalized to relative protein amount in each sample.
Figure 1.

Mammalian Fng proteins have differential effects on ligand-induced Notch1 signaling. (A) 3T3 cells were cotransfected with Notch1 (N1) and either SEAP, LFng-AP (LFng), MFng-AP (MFng), or RFng-AP (RFng), along with CBF-luciferase reporter pGL3JH26 and Renilla luciferase reporter pRLTK constructs; cocultured with either L, D1, or J1 cells; and assayed for luciferase activity. Luciferase activity is expressed as percent fold activation reflecting normalized relative luciferase units (RLUs) induced by ligand-expressing cells over RLUs obtained with L cells (ligand-activated N1+SEAP RLUs are set to 100% [D1/L = 8.65 ± 0.7, J1/L = 9.54 ± 1.5), bar graph shows mean ± SD; *p < 0.05, **p < 0.01, ***p < 0.001, n = 6; result from three independent experiments, each experiment done in duplicate). (B) 293T cells were either mock transfected (Mock) or transfected with SEAP, LFng-AP (LFng), LFngADD-AP (LFADD), RFng-AP (RFng), or RFngADD-AP (RFADD) plasmids. Conditioned medium and whole cell lysates from transfected cells were collected 48 h later and assayed for alkaline phosphatase (AP) activity and expressed as absorbance at OD405 normalized for protein concentration. (C) 3T3 cells were cotransfected with Notch1 (N1) and either SEAP, LFng-AP (LFng), or LFngADD-AP (LFADD) (left) or with SEAP, RFng-AP (RFng), or RFngADD-AP (RFADD) (right) along with CBF-luciferase reporter pGL3JH26 and Renilla luciferase reporter pRLTK constructs, cocultured with either L, D1, or J1 cells and assayed for luciferase activity. Luciferase activity is expressed as fold activation over L cells reflecting normalized RLUs induced by ligand-expressing cells over RLUs obtained with L cells. Bar graph shows mean ± SD, n = 4, RLU obtained with L cells arbitrarily = 1; representative result of two independent experiments.
Metabolic Labeling
Parental L cells or stable-expressing D1 cells grown to confluence in 100-mm dish were incubated in DMEM lacking methionine and cysteine for 1 h, after which Tran [35S] label (100 mCi/ml; MP Biomedicals, Irvine, CA) was added, and the cultures were further incubated at 37°C for 5 h to metabolically label proteins. 12-O-Tetradecanoylphorbol-13-acetate (TPA) (100 nM) was added (+) 3 h postlabeling as indicated, and cells were incubated at 37°C for an additional 2 h. One plate of D1 cells contained BB3103 (5 mM) throughout the starvation and labeling period. CM from labeled cells was collected and IPd with an antibody that recognizes the extracellular domain of rat Delta1 (148G; DiSibio and Weinmaster, unpublished data) to isolate the released D1 extracellular domain.
Soluble Ligand Binding Assay
For these studies, D1Fc was generated and prepared as described previously (Hicks et al., 2000, 2002), and J1Fc was purchased from R&D Systems (Minneapolis, MN) (599-JG). Human embryonic kidney (HEK) 293T cells were plated in 24-well plates and transfected with 60 ng of N1Δmyc and 60 ng of either SEAP, LFng, MFng, RFng, or LFADD per well by using Transfast (Promega) for the data presented in Figure 2, A and B. Forty-eight hours posttransfection, cells were incubated for 45 min at 37°C in blocking media (DMEM containing 10% goat serum and 1% BSA). Soluble ligands were clustered at 4°C with fluorescein isothiocyanate (FITC)-conjugated goat anti-human Fc antibody (Jackson ImmunoResearch Laboratories, West Grove, PA) in blocking media for 30 min as described previously (Hicks et al., 2002). Serial dilutions of the clustered ligand were added to cells for 30 min at 37°C. After binding, the cells were removed by triteration, washed three times in wash buffer (PBS, 0.2% BSA, and 0.1% NaN3), and analyzed by FACScan (BD Biosciences, San Jose, CA) to determine mean fluorescence intensity (MFI) at 530 ± 15 nm. For the data presented in Figure 2, C and D, HEK 293T cells were plated in 24-well plates and calcium phosphate transfected with 125 ng of N1Δmyc and either 125 ng of SEAP, LFng, MFng, RFng, or LFADD per well. Forty-eight hours posttransfection, J1Fc was clustered at RT with FITC-conjugated goat anti-human Fc antibody in the binding buffer as described by Hirai's group (PBS containing 2% FBS, 100 μg/ml CaCl2, and 0.05% NaN3) (Shimizu et al., 1999, 2000a,b, 2001, 2002). Cells were first blocked in this binding buffer containing 2.5% goat serum and then incubated with clustered J1Fc for 10 min at 37°C. After removal by triteration, cells were washed three times in this binding buffer and the MFI was determined. An identical protocol was used for detection of unclustered J1Fc except that the surface bound J1Fc was detected after incubation with FITC-conjugated goat anti-human Fc antibody on ice for 30 min. For the data presented in Figure 2, E and F, 293T cells were calcium phosphate transfected as described for Figure 2, C and D, with the addition of 62.5 ng of pHcRed (BD Biosciences Clontech, Palo Alto, CA). The MFI of pHcRed-expressing cells emitting fluorescence at 660 ± 6 nm was determined with a FACScalibur (BD Biosciences). To detect J1Fc binding to 3T3 cells, 50 ng of pHcRed, 100 ng of N1Δmyc or vector, and 100 ng of either SEAP, LFng, MFng, RFng, or LFADD were transfected in six-well dishes by using Lipofectamine. Twenty-four hours posttransfection, the cells were replated in bacterial plates and 18 h later they were triterated and the single cell suspension was incubated with preclustered J1Fc in binding buffer as described above, and the MFI of pHcRed-expressing cells was determined with FACScalibur.
Figure 2.


Effects of mammalian fringe proteins on binding of soluble DSL ligands to Notch1-expressing cells. 293T cells transfected with N1 and either SEAP, LFng, MFng, RFng, or LFADD were incubated with preclustered D1Fc (A) or preclustered J1Fc (B) in culture media not containing 0.05% NaN3 as outlined in Materials and Methods (B). Binding of increasing concentrations of D1Fc or J1Fc to transfected cells was measured by flow cytometry and expressed as MFI ± SD, n = 4 (vertical axis) plotted against the concentration of D1Fc (0.1, 0.3, and 1 μg/ml, horizontal axis) or the concentration of J1Fc (0.1, 0.3, and 1 μg/ml, horizontal axis). (C) 293T cells transfected with vector or N1 and either LFng, MFng, RFng, or LFADD were incubated with 10 μg/ml unclustered J1Fc in binding buffer containing 0.05% NaN3, and bound J1Fc was detected with anti-human Fc FITC-conjugated antibody and the binding detected is plotted as MFI. (D) 293T cells described in C were incubated with 10 μg/ml preclustered J1Fc, and binding detected is plotted as MFI. (E) 293T cells cotransfected with pHcRed, vector, or N1 and either SEAP, LFng, MFng, RFng, or LFADD were incubated with 1 μg/ml preclustered J1Fc or preclustered Fc control, and the MFI of pHcRed-transfected cells was detected and plotted. (F) 3T3 cells cotransfected with pHcRed, vector or N1 and either SEAP, LFng, MFng, RFng, or LFADD were incubated with 1 μg/ml preclustered J1Fc and the MFI of pHcRed-transfected cells was detected and plotted. (G) 3T3 cells transfected with N1 and either SEAP, LFng, MFng, RFng, or LFngADD along with the CSL-reporter construct were incubated with either preclustered Fc (0.3 μg/ml), preclustered D1Fc (0.3 μg/ml), or (H) preclustered J1Fc (0.3 μg/ml) for 24 h. Luciferase activities were assayed and normalized as fold activation over Fc (relative luciferase units [RLUs] induced by either D1Fc or J1Fc over RLUs obtained with Fc). Bar graph indicates mean ± SD, n = 4; ***p <0.001, RLU obtained with Fc arbitrarily = 1; data from three independent experiments are shown.
RESULTS
Mammalian Fringe Proteins Display Differences in Modulation of Ligand-Induced Notch1 Signaling
Of the three mammalian fringe proteins, only LFng has been shown to both enhance N1 signaling induced by D1 and suppress signaling induced by J1 in coculture reporter assays (Hicks et al., 2000). We and others also have shown that MFng can suppress J1-induced signaling through N1 (Hicks et al., 2000; Moloney et al., 2000; Chen et al., 2001), but the effects of MFng on N1 signaling in response to D1 have not been reported. Moreover, direct demonstration that RFng modulates ligand-induced Notch signaling has yet to be reported for any ligand-Notch combinations. In this regard, differences in glycosyltransferase activities have been reported for LFng and MFng, but enzymatic activity for RFng has not been demonstrated. To compare the effects of the three mammalian fringe proteins on ligand-induced N1 signaling, we measured their ability to modulate signaling induced by either D1 or J1 in 3T3 cells ectopically expressing N1 by using a CSL-reporter coculture assay (Hicks et al., 2000). Consistent with our previous findings, LFng potentiated CSL-reporter activity induced by D1 and suppressed CSL-reporter activity by J1 (Figure 1A). Although both MFng and LFng inhibited N1 activation of CSL in response to J1, MFng only weakly potentiated D1-induced N1 signaling compared with LFng (Figure 1A). These findings suggest that LFng modulates N1 signaling by both D1 and J1, whereas MFng seems to more effectively inhibit J1 signaling. Interestingly, although RFng enhanced D1-induced N1 signaling (Figure 1A), it did not inhibit J1-induced N1 signaling. In fact, RFng significantly enhanced J1-induced activation of the CSL-reporter gene (Figure 1A). The differences in CSL-reporter activity detected for the different fringe glycosyltransferases might reflect differences in substrate recognition and/or catalytic activity (Haltiwanger, 2002; Haltiwanger and Stanley, 2002).
Sequences Essential for Glycosyltransferase Activity Are Required for Modulation of Ligand-induced CSL Activation by Mammalian Fringe Proteins
To demonstrate that fringe modulation of ligand-induced N1 signaling measured in CSL coculture assays (Figure 1A) depends on fringe glycosyltransferase activity, we mutated the catalytic site within LFng and RFng as reported previously for DFng and MFng (Bruckner et al., 2000; Moloney et al., 2000; Munro and Freeman, 2000; Chen et al., 2001). All fringe proteins have a conserved DDD motif that is required for enzymatic and biological activity, so we generated LFng (LFADD) and RFng (RFADD) mutant proteins by changing the first D to an A (see Materials and Methods). Mutant protein expression was detected using the enzymatic activity intrinsic to their C-terminal AP tags as described previously (Johnston et al., 1997). Although fringe proteins both localize and function in the Golgi, ectopic expression in some cases results in secretion from cells (Johnston et al., 1997; Munro and Freeman, 2000). Both the wild-type LFng and LFADD proteins were detected in the culture media (Figure 1B), indicating that the ADD mutation did not compromise protein expression or stability. Similar results were obtained with the wild-type and mutant RFng, which was assayed in cell lysates because RFng is not secreted from cells (Johnston et al., 1997) (Figure 1B). When tested in CSL-reporter coculture assays, neither LFADD nor RFADD altered N1 signaling induced by either D1 or J1 (Figure 1C), indicating that the mutant proteins are functionally defective. These results establish that sequences essential for the glycosyltransferase activity intrinsic to the fringe proteins are required for the modulatory effects measured in our cell culture systems.
Delta1 and Jagged1 Binding to Notch1 in the Presence of Mammalian Fringe Proteins Does Not Directly Correlate with Changes in Notch1 Signaling
Previous results have correlated the modulation of Notch signaling by DFng with ligand binding to Notch (Bruckner et al., 2000; Lei et al., 2003; Okajima et al., 2003). To explore the impact of mammalian fringe glycosyltransferases on ligand binding, we used soluble Fc fusion proteins containing the ectodomains of D1 (D1Fc) or J1 (J1Fc). We have previously reported that these soluble ligands bind N1 cells and notably, expression of LFng did not perturb J1Fc binding (Hicks et al., 2000, 2002). However, our findings are in conflict with those reported for DFng in Drosophila cells, where gains and losses in signaling directly correlate with changes in ligand binding (Bruckner et al., 2000; Lei et al., 2003; Okajima et al., 2003). Therefore, to reevaluate the effects of mammalian fringe proteins on DSL ligand binding to N1, we determined binding by using a range of soluble ligand concentrations. 293T cells transiently cotransfected with N1 plus either LFng, MFng, or RFng were incubated with D1Fc or J1Fc proteins preclustered with FITC-conjugated anti-Fc antibodies. As controls, we also measured ligand binding to cells coexpressing N1 and either SEAP or LFng defective in glycosyltransferase activity (LFADD). After incubation over a range of D1Fc or J1Fc concentrations, the cells were washed, and single cell suspensions were analyzed by flow cytometry to determine the extent of ligand binding by measuring the MFI. The MFI detected with cells expressing N1+SEAP was directly proportional to the ligand concentration over a 10-fold range for both D1Fc and J1Fc (Figure 2, A and B). As reported previously (Hicks et al., 2000, 2002), Fc binding to transfected cells was not detected (see below). Cells expressing N1+ SEAP displayed the lowest MFI (ligand binding), whereas expression of any one of the three fringe proteins enhanced D1Fc binding, with LFng showing a twofold enhancement in MFI at the highest concentration tested (Figure 2A). As found with SEAP, LFADD expression did not enhance D1Fc binding, suggesting that glycosylation of N1 is the basis for the increased ligand binding detected with LFng. In contrast, none of the fringe proteins enhanced J1Fc binding (Figure 2B) as found with D1Fc. Importantly, J1Fc binding in the presence of either MFng or RFng was within the range detected for cells transfected with either N1+SEAP or N1+LFADD (Figure 2B). Therefore, although LFng and MFng suppressed J1-induced activation of N1, J1Fc binding was not prevented, which is in contrast to the loss in Serrate binding to Notch-expressing cells reported for DFng (Lei et al., 2003; Okajima et al., 2003) and the decrease in J1Fc binding to N2-expressing cells reported for MFng (Shimizu et al., 2001).
One difference in the ligand binding assays used in our studies and those reported by others is our use of clustered soluble ligands, and thus we reasoned that anti-Fc clustering might mask any potential losses in J1Fc binding mediated by either LFng or MFng. Therefore, we compared the binding of unclustered (Figure 2C) and clustered (Figure 2D) purified J1Fc protein to N1-expressing 293T cells by using the binding conditions previously described by Hirai's group (Shimizu et al., 1999, 2000a,b, 2001, 2002). This analysis indicated that although the MFI was decreased approximately twofold in the absence of clustering antibody (Figure 2C), the general pattern of J1Fc binding associated with the different fringe proteins was similar to that detected for clustered J1Fc (Figure 2D). The specificity of J1Fc binding to N1 is indicated by the low level of binding detected for the vector control and for Fc protein. Although these findings support the idea that fringe glycosylation of N1 does not prevent J1 binding, the disparity between J1Fc binding and suppression of J1-induced N1 signaling could be due to differences in cell types used in the different assays. Therefore, we measured the binding of J1Fc to 3T3 cells that are routinely used to detect Notch signaling induced by ligand-expressing cells in coculture assays. For this analysis, we transfected pHcRed along with N1 and the individual fringe proteins or SEAP encoding constructs into either 293T (Figure 2E) or 3T3 cells (Figure 2F) to facilitate detection of J1Fc binding specifically to the transfected cells within the population by using flow cytometry. The increase in MFI detected for cells transfected with N1 compared with vector indicated the specificity of J1Fc binding for N1, whereas the binding of Fc was negligible (Figure 2E). Importantly, J1Fc binding in the presence of any of the fringe proteins as well as the controls SEAP and LFADD was not inhibited for either 293T or 3T3 cells (Figure 2, E and F) and thus any losses in J1-induced N1 signaling attributed to LFng or MFng (Figure 1A) cannot be accounted for by losses in J1Fc binding.
Fringe Proteins Differentially Modulate Notch1 Signaling Induced by Soluble and Cell-associated Forms of Delta1 and Jagged1
We and others have reported that monomeric and dimeric soluble ligands are inactive in signaling, whereas preclustered soluble ligands are active, suggesting that preclustered soluble ligands more closely resemble the physical state of the cell-associated ligands (Varnum-Finney et al., 2000; Hicks et al., 2002; Shimizu et al., 2002). Accordingly, to correlate the effects of fringe proteins on ligand binding with ligand activation of N1 signaling, we measured the ability of clustered soluble ligands to activate the CSL reporter in 3T3 cells coexpressing N1 and either SEAP, LFng, MFng, RFng, or LFADD as described for Figure 1, A and C. In this assay, both D1Fc and J1Fc activated CSL (Figure 2, G and H), and although the absolute levels of activation are less than those detected for cell-associated ligands in coculture assays, the trend is the same (Figure 1, A and C). The low levels of CSL activation measured for D1Fc and J1Fc may be due to the generation of both active and inactive clustered ligands as reported previously (Hicks et al., 2002), but they more likely reflect a requirement for the ligand intracellular domain in ligand-induced Notch signaling (Parks et al., 2000; Shimizu et al., 2002). Nonetheless, D1Fc activity was enhanced by the inclusion of any one of the three fringe proteins, with LFng showing the strongest effect (Figure 2G), exactly as demonstrated with D1 cells (Figure 1, A and C). Importantly, CSL activation induced by J1Fc was suppressed by LFng and to a greater degree by MFng, but not RFng (Figure 2H), mirroring the levels of activation in CSL reporter cocultures (Figure 1A). In addition, the LFADD mutant was unable to enhance or suppress CSL activation induced by D1Fc or J1Fc, respectively (Figure 2, G and H), indicating that glycosylation is the basis for the differential modulation in signaling observed for the fringe proteins. In summary, our findings that fringe proteins display similar trends in modulation of Notch signaling in different cell types, induced by either soluble or cell-associated D1 and J1 ligands, suggest that the effects of fringe glycosylation by using soluble ligands can be compared with signaling measured in coculture assays.
Losses in Notch1 Cell Surface Expression Correlate with Increases in Ligand-induced Signaling Mediated by Fringe Proteins
Although fringe proteins can extend O-fucose glycans on Notch, it is not known how changes in glycosylation might affect ligand-induced Notch signaling. Underscoring the importance of glycosylation for fringe biological activity, Fringe Connection (FRC) mutants, which are unable to transport the donor sugar added to O-fucose by DFng, have phenotypes similar to DFng mutants (Goto et al., 2001). Defects in proteolytic maturation of Notch have been reported for FRC mutants, suggesting that losses in glycosylation alter the structural properties of Notch (Goto et al., 2001). Mammalian N1 maturation involves furin proteolytic processing of full-length N1 (N1FL) within the extracellular domain to form a heterodimeric, cell surface receptor composed of the N-terminal (Notch extracellular domian, NECD) noncovalently associated with the C-terminal membrane-spanning fragment (N1™) (Logeat et al., 1998; Rand et al., 2000). To investigate whether increases in fringe glycosylation of N1 might also alter its structural properties and thereby contribute to modulation of signaling, we first examined N1 maturation and cell surface expression in cells ectopically expressing N1 and either SEAP, LFng, MFng, or RFng (Figure 3A). Biotinylation of cell surface proteins indicated that fringe protein expression did not strongly alter the amount of full-length N1 (N1FL) or furin cleavage fragment (N1™) detected at the cell surface suggesting that fringe glycosylation of N1 does not influence N1 maturation, transport to, or stability at, the cell surface (Figure 3A, compare lane 1 with lanes 2–4). Although cells expressing MFng displayed a slight increase in (N1FL), the N1™ detected at the cell surface was comparable for all three fringe proteins and SEAP. Because ligand-induced proteolysis of N1™ activates CSL, the differences in CSL activation detected for the fringe proteins in response to either D1 or J1 (Figure 1A) are not due to differences in heterodimeric N1 available for proteolysis.
Figure 3.

Fringe proteins do not alter cell surface expression of N1, and activation of N1 signaling leads to losses in N1 cell surface expression. (A) 293T cells were cotransfected with N1 (pBOS-N1) and either SEAP, LFng, MFng, or RFng and biotinylated with Sulfo-NHS-Biotin (0.5 mg/ml) for 30 min at 4°C, and biotinylated proteins were isolated with SAV-immobilized beads. The SAV precipitates (lanes 1–4) and WCL (lanes 5–8) were analyzed by IB with 93-4 serum (Shawber et al., 1996). N1FL, furin-cleaved membrane-associated form of N1 (N1™), and (*) that may represent either intracellular N1 that is not posttranslationally modified or a protease fragment of N1FL are indicated. (B) 293T cells were cotransfected with N1 and either SEAP, LFng, MFng, or RFng and cocultured overnight with parental L cells (lanes 1, 4, 7, and 10), D1 cells (lanes 2, 5, 8, and 11), or J1 cells (lanes 3, 6, 9, and 12). After biotinylation WCL were incubated with SAV-immobilized beads and analyzed by IB with 93-4 serum, anti-pan cadherin antibody (Pan-Cad, to control for biotinylated cell surface proteins pulled down by SAV) and anti-dynamin antibodies (α-Dyn, to detect any inadvertent biotinylation of intracellular proteins due to dead or leaky cells). (C) The immunoblot from B was scanned by Typhoon 9410 scanner (Amersham Biosciences) and analyzed by Imagequant software. The intensities of N1™ were quantified as integration volume obtained in each lane normalized to the relative integration volume of cell surface cadherin (Cad).
Given that ligand binding activates N1 proteolysis to release the biologically active NICD from the plasma membrane, one might expect signaling induced by ligand to remove N1 from the cell surface as reported previously for N2 (Shimizu et al., 2002). Therefore, to determine whether fringe proteins differentially affect the level of cell surface N1 after ligand binding, 293T cells coexpressing N1 and either SEAP, LFng, MFng, or RFng were cocultured overnight with either parental L, D1, or J1 cells. Cells were then labeled with biotin, followed by SAV precipitation and immunoblotting (IB) with N1 (93-4) to detect cell surface N1 (Figure 3B). N1 cell surface expression (N1™) in response to D1 cells, relative to L cells, was decreased when any one of the fringe proteins was coexpressed (Figure 3, B and C; compare lanes 4, 7, and 10 with 5, 8, and 11). Importantly, this decrease correlates with potentiation in D1-induced N1 signaling (Figure 1A). Furthermore, decreases in cell surface N1 also were detected for RFng in response to J1 cells (Figure 3, B and C; compare lanes 10 with 12), conditions that also potentiated N1 signaling (Figure 1A). In contrast, losses in N1 cell surface expression were not detected when N1 cells coexpressing LFng or MFng were cocultured with J1 cells (Figure 3B, C; compare lanes 4 and 7 with 6 and 9); conditions that suppressed N1 signaling induced by J1 (Figure 1A). This inverse relationship between N1 at the cell surface and CSL activation suggests that ligand-induced Notch signaling results in removal of N1 from the cell surface, consistent with the Notch proteolytic cleavage model. Importantly, although LFng enhanced J1 binding to N1 cells (Figure 2B), this increase in ligand binding did not seem to decrease cell surface N1 (Figure 3, B and C; compare lanes 4, 7, and 10 with 6, 9, and 12). These data indicate that fringe glycosylation also differentially affects removal of N1 from the cell surface in a ligand-dependent manner and identify this event as a potential site for fringe modulation of Notch signaling.
Fringe Glycosyltransferases Differentially Modulate Nuclear Notch Induced by Delta1 and Jagged1
To further explore the idea that fringe glycosylation of N1 affects ligand–receptor interactions required for N1 proteolysis, we modified an assay originally developed to measure a signal for NICD in the nucleus in response to Delta-Notch signaling in Drosophila (Struhl and Adachi, 1998). For this assay, domains from the Gal4 (G) and VP16 (V) transcription factors were inserted within the juxtamembrane region of N1 (GV), and the effects of fringe protein expression on ligand-induced N1 proteolysis and NICD nuclear translocation were quantitated using a Gal4-reporter as described for the CSL-reporter coculture assays (Figure 4A). The effects of the different fringe proteins on nuclear NICD levels measured in this assay (Figure 4B) are similar to those detected in the CSL-reporter assay (Figure 1A), suggesting that fringe glycosylation of N1 differentially affects N1 proteolysis induced by ligand binding.
Figure 4.

Fringe proteins differentially modulate ligand-induced nuclear translocation of NICD. (A) Depicts Gal4-VP16 (GV) system to measure S3 nuclear localization in response to ligand-induced proteolysis of N1GVΔmyc (see text for details). (B) 3T3 cells were cotransfected with N1GVΔmyc and either SEAP, LFng, MFng, or RFng, along with Gal4-luciferase reporter pG5M2 and pRLTK reporter constructs and cocultured with either L, D1, or J1 cells followed by detection of luciferase activity. Luciferase activity is expressed as fold activation over L cells reflecting normalized relative luciferase units (RLUs) induced by ligand-expressing cells over RLUs obtained with L cells (ligand-activated N1+SEAP RLUs are set to 100% (D1/L = 2.08 ± 0.14, J1/L = 1.91 ± 0.06), bar graph shows mean ± SD; *p < 0.05, **p < 0.01, ***p < 0.001, n = 4; results from two independent experiments, each experiment done in duplicate).
Mammalian Fringe Proteins Differentially Modulate Ligand-induced Proteolysis of Notch1
We directly investigated the affects of fringe proteins on NICD generation after ligand binding to N1. Notch signaling in response to ligand binding involves proteolysis of heterodimeric N1 within its membrane-associated N1™ (S1) fragment, first by a disintegrin and metalloprotease (ADAM) cleavage to produce a membrane-associated N1 fragment (S2) that is further proteolytically processed by γ-secretase to generate the active NICD (S3) (Brou et al., 2000; Mumm et al., 2000). To facilitate identification of S1, S2, and S3 proteolytic cleavage fragments produced from N1 in response to ligand, we generated full-length (N1Δmyc) and recombinant forms of S2 (ZEDN1Δmyc) and S3 (FCDN1Δmyc) in which the C-terminal 350 amino acids are replaced by six myc tag epitopes (Figure 5A). At least three different bands were identified from 293T cells expressing the S2-like ZEDN1Δmyc construct, presumably due to the presence of more than one translational start site (initiating methionine) and phosphorylation as reported previously (Kopan et al., 1996; Foltz and Nye, 2001). Therefore, the valine (V) identified as the γ-secretase cleavage site in N1 (Schroeter et al., 1998) was mutated to a leucine (L) (ZEDN1V/LΔmyc) to positively identify S3 (Figure 5B). IB of cell lysates expressing the S3-like FCDN1Δmyc construct, in conjunction with phosphatase treatment (Figure 5, B and C), allowed identification of phosphorylated (S3*) and unphosphorylated S3 species.
Figure 5.

Fringe proteins differentially modulate ligand-induced proteolysis of N1. (A) Depicts the structure of N1 and the N1Δmyc constructs used to identify the furin-cleaved form of N1Δmyc (S1), ADAM-cleaved form of N1Δmyc (S2), and NICD form of N1Δmyc (S3). The ZEDN1Δmyc construct encodes a mutant protein starting at the S2 cleavage site of N1. The ZEDN1V/LΔmyc construct is ZEDN1Δmyc containing a point mutation (circle) in the S3 cleavage site (V1742 to L). The FCDN1Δmyc construct encodes a mutant protein that contains only the sequences C-terminal to N1 transmembrane domain. (B) 293T cells were transfected with either N1Δmyc, ZEDN1Δmyc, ZEDN1/LΔmyc, or FCDN1Δmyc, and whole cell lysates were analyzed by IB with 9E10. (C) FCDN1Δmyc 293T cells were either untreated (-) or treated (+) with λ phosphatase (λPPase; New England Biolabs, Beverly, MA) to confirm the phosphorylated form of S3 (S3*). (D) 293T cells cotransfected with N1Δmyc and either SEAP or LFng were cocultured with parental L cells (lanes 1, 3, 5, and 7) or D1 cells (lanes 2, 4, 6, and 8) in the absence or presence of proteasome inhibitor MG132 (10 μM). Cells transfected with N1Δmyc+LFng were cultured in the absence of ligand cells as a control (lane 9). Whole cell lysates were IPd with 9E10 and analyzed by IB with 9E10 to identify S1, S2, S3, and S3*. (E) 293T cells cotransfected with N1Δmyc and either SEAP or LFng cocultured with parental L cells (lanes 2 and 6), D1 cells (lanes 3 and 7), J1 cells (lanes 4 and 8), or no cells control (lanes 1 and 5) in the presence of MG132 (10 μM) were processed as described in D. The membrane was stripped and reprobed with N1 Val1744 antibody to further identify the NICD form generated by γ-secretase activity. (F) 293T cells cotransfected with N1Δmyc and either SEAP, MFng, or RFng were cocultured with parental L cells (lanes 1, 4, and 7), D1 cells (lanes 2, 5, and 8), or J1 cells (lanes 3, 6, and 9) and processed as described in E.
293T cells cotransfected with N1Δmyc and either the control SEAP or LFng were cocultured with L, D1, or no cells (control; C), and lysates were immunoprecipitated with anti-myc antibodies (9E10) and immunoblotted with 9E10 (Figure 5D). Although D1 cells activated the CSL-reporter in coculture assays (Figure 1, A and C), NICD (S3) was not readily detected in D1 cocultures (Figure 6D, lane 2). However, S3 was detected when N1 cells coexpressing LFng were cocultured with D1 cells (Figure 5D, lane 4), consistent with enhanced nuclear NICD and CSL activation induced by D1 in the presence of LFng (Figures 1, A and C, and 4B). Our inability to detect S3 in D1 cocultures in the absence of LFng is likely due to the reported rapid turnover of NICD in the nucleus. Because NICD turnover is regulated in part by the proteasome (Schweisguth, 1999; Wu et al., 2001), drugs were added to the cocultures to inhibit proteasome degradation and thereby enhance detection of S3. Coculturing of transfected cells in the presence of proteasome inhibitors lactacystin (our unpublished data) or MG132 (10 μM) enhanced the amount of S3 detected in response to D1 cells (Figure 5D, compare lanes 2 and 6) and the amount of S3 detected in the presence of LFng was further enhanced (Figure 5D, compare lanes 4 and 8). Therefore, all subsequent proteolytic processing analyses included MG132 to aid detection of S3 produced in N1Δmyc cells after coculturing with ligand cells.
Figure 6.
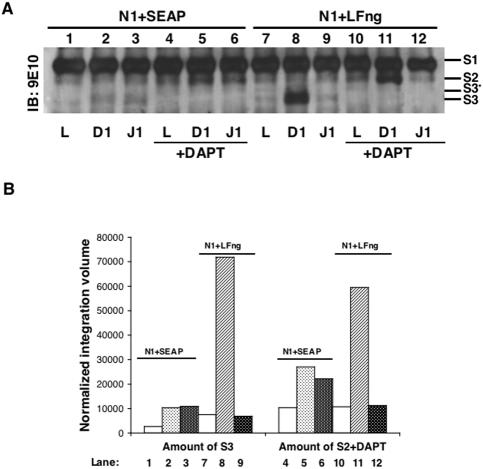
Inhibition of γ-secretase activity indicates that LFng alters S2 cleavage. (A) 293T cells cotransfected with N1Δmyc and either SEAP or LFng were cocultured with parental L cells (lanes 1, 4, 7, and 10), D1 cells (lanes 2, 5, 8, and 11), or J1 cells (lanes 3, 6, 9, and 12), either in the absence (lanes 1–3 and 7–9) or presence (lanes 3–6 and 9–12) of the γ-secretase inhibitor DAPT (50 μM) and analyzed by IP with 9E10 followed by IB with 9E10. (B) The immunoblot from A was scanned by Typhoon 9410 scanner (Amersham Biosciences) and analyzed by Imagequant software. The intensities of the proteolytic fragments generated in the assay were quantified as integration volume of S3 or S2 obtained in each lane normalized to the relative integration volume of S1.
In experiments similar to those described above, 293T cells cotransfected with N1Δmyc and either SEAP or LFng were cocultured with L (Figure 5E, lanes 2 and 6), D1 (lanes 3 and 7), J1 (lanes 4 and 8), or no cells (C) as a control (lanes 1 and 5). Immunoblotting of 9E10 immunoprecipitates (Figure 5E, top) indicated that N1Δmyc+SEAP cocultures containing either D1 or J1 cells induced N1Δmyc proteolysis to generate comparable levels of S3 (lanes 3 and 4), whereas low levels of S3 were detected from L cocultures (lane 2), consistent with low levels of endogenous signaling detected in CSL-reporter assays (our unpublished data). However, in N1Δmyc cells coexpressing LFng, higher levels of S3 were generated in response to D1 cells (Figure 5E, lane 7), whereas the amount of S3 detected from J1 cocultures was decreased (lane 8). Immunoblotting with a NICD-specific antibody (N1Val1744; Cell Signaling, Beverly, MD) further confirmed the identity of the S3 fragment and provided additional support that more NICD is generated by D1 cells in the presence of LFng (Figure 5E, lane 7, bottom). Importantly, this analysis also indicated that coexpression of LFng with N1Δmyc suppressed the generation of S3 induced by J1 cells. Consistent with the idea that ligand binding promotes N1Δmyc proteolysis to generate the S3 fragment detected here, the N1Δmyc furin-cleavage fragment (S1) was the major band detected when either N1Δmyc+SEAP or N1Δmyc+LFng-transfected cells were analyzed in the absence of ligand cells (Figure 5E, lanes 1 and 5). Furthermore, equivalent amounts of S3 were detected when N1Δmyc+LFADD cells were incubated with either D1 or J1 cells (our unpublished data), indicating that LFng glycosyltransferase activity is required to potentiate N1Δmyc proteolysis induced by D1 and suppress proteolysis by J1. Together, our findings indicate that the enhanced D1Fc binding ascribed to LFng correlates with increased N1Δmyc proteolysis, NICD nuclear localization and CSL activation (Figures 1, A and C, 4B, and 5, D and E). In contrast, LFng expression suppressed N1Δmyc proteolysis, NICD nuclear localization and CSL activation induced by J1, although LFng did not prevent J1Fc binding to N1 (Figure 2B).
The effects of MFng and RFng on ligand-induced N1Δmyc proteolysis were analyzed and as found with LFng, S3 production was differentially modulated by MFng, being increased by D1 and decreased by J1 (Figure 5F, compare lanes 1–3 with 4–6). Although RFng, like LFng and MFng, increased the amount of S3 induced by D1 cells (Figure 5F, lane 8), it did not suppress S3 production in response to J1 (lane 9), as found for the other fringe proteins (Figure 5E, lane 8, and F, lane 6). In fact, RFng increased the amount of S3 induced by J1 as found for D1, albeit to a lesser degree (Figure 5F, lanes 8 and 9). Therefore, RFng does not seem to suppress J1-induced N1Δmyc proteolysis as found for LFng and MFng, indicating diversity among the fringe proteins for modulating proteolysis and downstream signaling. Importantly, the amounts of S3 attributed to the presence of the different fringe proteins correlate with the levels of CSL activation measured for these glycosyltransferases (Figure 1A).
LFng Modulates Ligand-induced Notch1 Proteolysis at the ADAM Cleavage Site
Ligand binding induces sequential proteolytic cleavage of N1 such that the ADAM cleavage product (S2) is a transient form that is quickly converted by γ-secretase into the biologically active S3/NICD (Mumm and Kopan, 2000). Accordingly, inhibition of γ-secretase activity decreases S3 production and consequently results in S2 accumulation. To determine which ligand-induced cleavage event (S2 or S3) is modulated by LFng, we compared levels of S2 generated in response to either D1 or J1 in the absence or presence of the γ-secretase inhibitor DAPT (Dovey et al., 2001). In these experiments, DAPT completely blocked the generation of S3, indicating efficient inhibition of γ-secretase activity (Figure 6A, compare lanes 2 and 3 with 5 and 6 and lanes 8 and 9 with 11 and 12). Moreover, in the absence of ectopic LFng (N1+SEAP), similar levels of S2 were produced by D1 and J1 when DAPT was included in the cocultures (Figure 6A, lanes 5 and 6). However, in the presence of LFng (N1+LFng), blockade of γ-secretase cleavage led to an increase in S2 detected in response to Dl (Figure 6A, compare lanes 5 and 11). This increase in S2 correlates with the enhanced D1Fc binding to N1 detected for LFng (Figure 2A), suggesting that enhanced D1 binding leads to more ADAM cleavage of N1Δmyc. In contrast, the amount of S2 detected from J1 cocultures in the presence of LFng and DAPT was reduced (Figure 6A, compare lane 6 with 12), suggesting that LFng glycosylation of N1Δmyc inhibits J1-induced proteolysis at the S2 ADAM cleavage site. Quantitation of S2 detected in the presence of DAPT (Figure 6B), confirmed that LFng decreased the amount of S2 generated in J1 cocultures (compare lane 6 with 12). Together with the J1Fc binding detected with N1+LFng cells (Figure 2B), these data argue that LFng glycosylation of N1 accommodates J1Fc binding, yet the resulting ligand–receptor interactions do not promote ADAM-mediated proteolysis of N1.
LFng Does Not Alter Notch1 Proteolysis or CSL Activation Induced by EDTA
Treatment of Notch cells with EDTA is thought to mimic ligand-induced proteolysis and activation of signaling through dissociation of the N1 heterodimer (Rand et al., 2000). To determine whether signaling modulation by fringe requires ligand, we asked whether fringe glycosylation affects the stability of the N1 heterodimer in response to EDTA without ligand. Treatment of 293T cells cotransfected with N1Δmyc and either SEAP or LFng with a range of EDTA concentrations (2–10 mM) induced comparable amounts of S2 and S3 cleavage fragments (Figure 7A), suggesting that LFng glycosylation of N1 neither positively nor negatively alters EDTA-induced N1 proteolysis. Consistent with the proteolysis data, LFng expression did not significantly alter EDTA-induced CSL activation (Figure 7B), highlighting the requirement for ligand binding in LFng modulation of N1 proteolysis and downstream signaling.
Figure 7.

Ligand-binding is required for fringe modulation of N1 ADAM cleavage. (A) 293T cells cotransfected with N1Δmyc and either SEAP or LFng were treated with EDTA for 15 min at room temperature followed by DMEM + 10% fetal bovine serum and incubation at 37°C for 30 min. Cells were lysed, and WCL were IPd with 9E10 and analyzed by IB with 9E10 and FCDN1Δmyc (FCDN1) served to identify S3. (B) 3T3 cells cotransfected with N1Δmyc and either SEAP or LFng and reporter constructs were treated with increasing amounts of EDTA (0.05–0.5 mM, horizontal axis) as described in A, except that the incubation in DMEM + 10% fetal bovine serum was lengthened to 8 h. Luciferase activity is expressed as fold activation over “minus EDTA,” reflecting relative luciferase units (RLUs) induced by EDTA treatment over RLUs obtained in the absence of treatment (line graph shows mean ± SD, n = 4; representative result of two independent experiments). (C) 293T cells cotransfected with N1Δmyc and either SEAP or LFng were treated with the phorbol ester TPA (100 nM) for the indicated time periods and processed as described in Figure 5D. (D) Parental L cells or cells stably expressing a C-terminal hemagglutinin (HA)-tagged form of D1 (D1-HA) were metabolically labeled with [35S]methionine and treated with TPA (100 nM). One plate of D1-HA cells contained BB3103 (5 μM) throughout the starvation and labeling period (lane 5). Conditioned medium from labeled cells was collected and IPd with 148G antibody (raised against the extracellular domain of D1; DiSibio and Weinmaster, unpublished data) to isolate and identify shed D1 extracellular domain (D1 ECD). (E) D1-HA cells were either treated with ethanol (lanes 1–3) or 100 nM TPA (lanes 4–6) for 2 h in the absence or presence of 10 μM BB3103 (lanes 2 and 5) or 30 μM DAPT (lanes 3 and 6). Whole cell lysates were harvested and analyzed by IB with 12CA5 that recognizes the C-terminal HA tag on D1FL, TACE-cleaved form of D1 (D1TM1 and D1TM2), and ICD form of D1 (D1ICD) are indicated. A protein band that nonspecifically reacts with 12CA5 is indicated with an asterisk.
ADAM Proteolysis of Notch1 Is Dependent on Ligand Binding
To further explore the requirement of ligand for ADAM-mediated Notch proteolysis, we treated N1 cells with phorbol esters known to induce TACE shedding of many transmembrane proteins (Seals and Courtneidge, 2003). In contrast to other known TACE substrates, treatment of N1+SEAP or N1+LFng-transfected cells with the phorbol ester TPA did not induce shedding of the N1 ectodomain (our unpublished data), nor promote proteolysis of membrane-bound N1™ (S1) in the absence of ligand (Figure 7C). This apparent resistance of the N1 heterodimer to proteolysis by TPA-activated TACE is consistent with an absolute requirement for ligand binding to induce N1 proteolysis. Moreover, if fringe glycosylation of N1 alters protein structure, these changes do not seem to enhance the sensitivity of N1™ to TACE proteolysis in the absence of ligand binding.
The DSL ligands also are proteolytically processed by ADAM and γ-secretase proteases (Bland et al., 2003; LaVoie and Selkoe, 2003); however, in contrast to N1 proteolysis, cleavage of the DSL ligands seems to be constitutive. Because TPA treatment did not induce N1 proteolysis in the absence of ligand (Figure 7C), we examined D1 proteolysis in response to TPA to ensure that the TPA treatments used were sufficient to induce ADAM-dependent ectodomain shedding. D1 cells constitutively shed D1ECD into the culture media (Figure 7D, lane 3), and this shedding was further induced by TPA (lane 4) and blocked by metalloprotease inhibitors BB3103 (lane 5) and BB94 (our unpublished data). At least three proteolytic fragments were constitutively generated in the absence of TPA from D1FL (Figure 7E, lane 1), and D1FL proteolysis was further enhanced by TPA (lane 4). Examination of cleavage fragments produced in D1 cells in response to TPA (Figure 7E, lanes 4–6), and addition of either BB3103 (lane 5) or DAPT (lane 6) identified the previously described membrane-associated ADAM cleavage fragments (D1TM1 and D1TM2) and the soluble intracellular domain (D1ICD) γ-secretase fragment. That N1 is not cleaved after TPA treatment is in strong contrast to D1 and other TACE substrates and illustrates the dependence of N1 proteolysis on ligand binding.
Notch1 Interacts with ADAM17 but Not ADAM10
Although protein studies have provided evidence that ADAM 17 (TACE) cleaves N1 (Brou et al., 2000; Mumm et al., 2000), genetic studies in flies (Pan and Rubin, 1997; Lieber et al., 2002) and mice (Hartmann et al., 2002) are more consistent with a role for ADAM10/Kuzbanian (Kuz) in Notch signaling. To investigate which ADAM might function in ligand-induced proteolysis of N1 detected in our coculture assays, we coexpressed N1Δmyc with either TACE or Kuz in 293T cells to determine which ADAM coimmunoprecipitated with N1, indicative of a substrate–enzyme relationship. When WCL were incubated with 9E10 to immunoprecipitate N1Δmyc and immunoblotted for either TACE or Kuz, only TACE was detected in the immune complex (Figure 8A), suggesting that TACE but not Kuz interacts with N1. Although the major form of TACE interacting with N1 was the proform (TACEP), minor amounts of the mature form (TACEM) (Sahin et al., 2004) also were detected (Figure 8A), and addition of BB94 to prevent autocatalysis of Kuz did not allow detection of N1–Kuz interactions. The detection of TACE from WCL in the absence of transfected TACE cDNA indicated the presence of endogenous TACE (Figure 8A). Therefore, 293T cells ectopically expressing only N1Δmyc were immunoprecipitated for TACE and Kuz followed by immunoblotting for N1Δmyc (9E10) and either TACE or Kuz, to detect interactions between these endogenous proteases and N1Δmyc. Endogenous TACE (Figure 8B), but not endogenous Kuz (our unpublished data), coimmunoprecipitated with N1Δmyc consistent with the interaction detected for ectopically expressed TACE (Figure 8A). Although the functional significance of both the pro- and mature forms of TACE interacting with the uncleaved (N1FL) and heterodimeric (N1™) forms of N1Δmyc (Figure 8B) is unclear, these findings are nonetheless reminiscent of the interactions reported for pro- and mature forms of presenilin1 with both N1FL and N1™ (Ray et al., 1999). Moreover, the data are consistent with previously published findings suggesting a role for TACE as the putative ADAM in ligand-induced N1 proteolysis (Brou et al., 2000; Mumm et al., 2000).
Figure 8.

N1 associates with TACE but not Kuzbanian, and expression of LFng does not alter the N1–TACE complex in response to ligands. (A) 293T cells were transfected with N1Δmyc and increasing amounts of TACE (0, 0.5, and 2 μg, top) or Kuzbanian (0, 0.5, and 2 μg, bottom). The transfected cells were either untreated (-) or treated (+) with metalloprotease inhibitor BB-94, and WCL were IPd with 9E10 and IB with anti-TACE antibody (Chemicon International) or anti-Kuzbanian antibody (Chemicon International) and then stripped and reprobed with 9E10. The proform (TACEp) and mature form (TACEm) of TACE, and the proform (Kuzp) and mature form (Kuzm) of Kuzbanian are indicated. The furin-cleaved transmembrane form of N1 is indicated as N1™. (B) 293T cells either mock transfected (-) or transfected with N1Δmyc (+, 1 μg/60-mm dish) were either untreated (-) or treated (+) with metalloprotease inhibitor BB-94, and WCL were IPd with anti-TACE antibody and IB with 9E10. (C) 293T cells transfected with N1, TACEea (TACE mutant in which the catalytic Glu-406 was mutated to Ala), and either SEAP or LFng were cocultured with parental L (lanes 1 and 4), D1 (lanes 2 and 5), or J1 (lanes 3 and 6) cells, and WCLs were either IPd with anti-TACE antibody and analyzed by IB with 9E10 (top) to reveal the amount of N1 associated with TACE or IB with 9E10 to reveal the N1 proteolytic cleavages induced by ligand (bottom). The membrane was stripped and reprobed with anti-TACE antibody (middle).
Our findings indicate that N1 and TACE exist in a preformed complex in the absence of ligand binding and suggest that ligand binding is not required to recruit TACE to N1. Alternatively, because TACE interacts with N1 in the absence of ligand, the loss in ADAM cleavage detected after J1 binding to fringe glycosylated N1 could be due to displacement of TACE from the N1–ligand complex. To investigate this idea, we used an enzymatically inactive TACE in which the “catalytic” Glu-406 is mutated to Ala (TACEea) to prevent autocleavage of the mature, proteolytically active TACE. This allowed us to detect TACE–N1 interactions in cocultures undergoing ligand-induced signaling in the absence of BB94. N1Δmyc cells coexpressing either SEAP or LFng were cocultured with L, D1, or J1 cells, and lysates were immunoprecipitated with TACE antibodies and immunoblotted with 9E10 to detect N1. Equivalent amounts of N1™ coimmunoprecipitated with TACE from D1 and J1 cocultures (Figure 8C, top), although D1 increased S2 and J1 decreased S2 in the presence of LFng (Figure 6A, lanes 11 and 12, and Figure 8C, bottom). These data argue that the losses in N1 ADAM cleavage detected with J1 cocultures in the presence of LFng are not due to displacement of TACE from the N1 complex after J1 binding.
DISCUSSION
Here, we show that the mammalian fringe proteins alter N1 signaling induced by two classes of DSL ligands. Specifically, N1 signaling induced by D1 is enhanced by all fringe proteins supporting current ideas that fringe proteins potentiate D1-induced N1 signaling through increased ligand binding. Although signaling in response to J1 is suppressed by LFng and MFng but enhanced by RFng, we found that none of the three fringe proteins altered binding of soluble J1 to N1 cells. This lack in correlation between ligand binding and signaling is in contrast to that reported for Drosophila studies where losses and gains in ligand binding reflect losses and gains in signaling. Nevertheless, our data indicate that D1 binding to N1 is enhanced by fringe glycosylation and that this increased D1 binding potentiates signaling. Furthermore, we propose that although fringe glycosylation does not prevent J1 binding to N1, the resultant ligand–receptor interactions do not effectively promote proteolysis required for activation of downstream signaling events.
The extracellular domains of all Notch proteins contain multiple, highly conserved EGF-like motifs, many of which have potential sites for both N- and O-linked glycosylation (Haltiwanger, 2002; Haltiwanger and Stanley, 2002; Haines and Irvine, 2003). O-Fucosylation consensus sequences have been identified in 21 of the 36 EGF-like motifs present in mammalian N1 (Shao et al., 2003); however, biochemical studies suggest that not all potential O-fucosylated EGF motifs are further modified by fringe proteins. Moreover, different fringe proteins exhibit differences in stoichiometry, specificity, and preference for different Notch EGF-repeats, as well as differences in intrinsic enzymatic activities (Shimizu et al., 2001; Haltiwanger, 2002; Haltiwanger and Stanley, 2002; Haines and Irvine, 2003). Studies in animal models and cellular-based systems should provide a clearer understanding of the functional consequences of the diversity in Notch glycosylation.
As predicted from the biochemical analyses, our cell-based assays revealed differences in modulation of ligand-induced Notch signaling among the three fringe proteins. LFng glycosylation of N1 enhanced signaling by D1, whereas signaling induced by J1 was suppressed. In contrast, MFng preferentially suppressed J1-induced signaling. RFng exhibited yet another pattern, enhancing signaling induced by both D1 and J1, a finding that is reminiscent of our previous report that LFng increases signaling via the N2 receptor when activated by either D1 or J1 (Hicks et al., 2000). Together with previous studies (Hicks et al., 2000; Shimizu et al., 2001), our findings indicate that different combinations of DSL ligands, Notch receptors and fringe glycosyltransferases could produce different levels of signaling and lead to different biological outcomes. Consistent with this notion, of the three fringe glycosyltransferases, developmental defects have only been reported for LFng (Evrard et al., 1998; Zhang and Gridley, 1998). RFng has been reported to induce ectopic apical ectodermal ridge formation when misexpressed in developing chick limb buds (Laufer et al., 1997); however, mice deficient in RFng do not display limb defects even though RFng is expressed in developing limbs (Zhang et al., 2002). Furthermore, mice lacking both RFng and LFng have defects associated with disruption of LFng, suggesting that these glycosyltransferases do not play redundant roles, at least in some developmental processes (Zhang et al., 2002).
How could addition of O-fucose glycans affect ligand–Notch interactions to either positively or negatively effect ligand-induced Notch signaling? One explanation would be that sugars added to Notch potentiate signaling by enhancing ligand binding, whereas losses in signaling would result from losses in ligand binding to glycosylated Notch. In fact, studies in flies have demonstrated that DFng strongly enhances binding of either soluble Notch to Delta-expressing cells or soluble Delta to cells expressing Notch (Bruckner et al., 2000; Lei et al., 2003; Okajima et al., 2003), in agreement with the potentiation in Delta-induced Notch signaling proposed to account for the DFng phenotypes in flies (Haines and Irvine, 2003). In this study, we found that all three fringe proteins enhanced D1 binding to N1, suggesting that increases in ligand binding account for potentiation in signaling.
In contrast to the findings with Delta, DFng decreases binding of soluble Notch to Serrate-expressing cells (Lei et al., 2003; Okajima et al., 2003), and this decrease in binding correlates with a loss in Serrate signaling in whole animal studies. In addition, MFng and to a lesser degree LFng have been reported to decrease binding of J1Fc to mammalian cells expressing N2 and to decrease signaling induced by J1 cells (Shimizu et al., 2001). However, our studies did not detect any losses in J1Fc binding to N1 cells in the presence of any of the three fringe proteins, although we routinely observed losses in J1-induced N1 signaling attributable to fringe glycosylation. Soluble proteins containing the extracellular domains of either D1 or J1 fused in frame with human Fc (D1Fc and J1Fc) were used to obtain the ligand binding data reported here and previously (Shimizu et al., 1999, 2000a,b, 2001, 2002; Hicks et al., 2000, 2002). These soluble ligands bind to N1 cells and D1Fc has been shown to block neuronal and oligodendrocyte differentiation and promote gliogenesis (Wang et al., 1998; Morrison et al., 2000), indicating that D1Fc binding to Notch activates downstream signaling events. However, we also have previously reported that the D1Fc oligomeric state influences binding and activation of Notch signaling, and thus we precluster soluble ligands with anti-Fc antibodies to achieve optimal activity (Hicks et al., 2002).
The clustering of soluble ligands is one obvious difference between the ligand binding assays in our studies and those reported by others (Bruckner et al., 2000; Shimizu et al., 2001; Lei et al., 2003; Okajima et al., 2003). To directly address this difference and to rule out that antibody clustering may mask losses in J1Fc binding in the presence of fringe proteins, we tested the binding of unclustered, purified J1Fc as described previously (Shimizu et al., 1999, 2000a,b, 2001, 2002). This analysis revealed that J1Fc in the absence of pretreatment with clustering antibodies still bound to N1 cells expressing any one of the fringe proteins as well as the functionally inactive LFng (LFADD), corroborating our findings with clustering antibodies that fringe glycosylation of N1 does not prevent J1Fc binding. This raises the question, if J1 can still bind to fringe glycosylated N1, what is the mechanism by which fringe glycosyltransferases inhibit J1-induced signaling? A reasonable explanation may be offered by recent models of ligand-induced Notch signaling that suggest an active role for the Delta-presenting cell in Notch signaling beyond ligand presentation to the receptor. Genetic and biochemical studies indicate that sequences in the NECD are inhibitory to Notch signaling (Lieber et al., 1993; Kopan et al., 1996), and evidence suggests that ligand-binding facilitates removal of the NECD through transendocytosis into the Delta-presenting cell in flies (Parks et al., 2000). That NECD removal from the surface of the Notch responding cell is an important aspect of signaling also is supported by studies where EDTA treatment of N1 cells causes shedding of the NECD and activation of Notch signaling independent of ligand (Rand et al., 2000). These findings imply that dissociation of the Notch heterodimer is all that is required for Notch proteolysis and activation of signaling to occur. We found that EDTA treatment generated both S2 and S3 cleavage fragments in N1 cells and activated the CSL-reporter, consistent with the idea that once NECD is released from cells, the remaining membrane-associated N1™ undergoes ADAM cleavage followed by γ-secretase cleavage to produce NICD. In fact, a N1 mutant similar in structure to the N1™ fragment of the heterodimer is constitutively active (Aster et al., 1997) and oncogenic (Pear et al., 1996), and we would predict that both ADAM and γ-secretase are required for these activities. In the context of these observations, fringe glycosylation of Notch could alter the ability of Jagged1–Notch complexes to survive the forces applied during ligand endocytosis. Such differences could dictate which complexes are sufficiently stable to cause NECD dissociation and subsequent activation of signaling after ligand binding.
It has been suggested that ligand binding to N1 induces conformational changes that allow recruitment of the ADAM to N1 (Parks et al., 2000). However, in the absence of ligand binding, we found that TACE and N1 exist in a preformed complex and that N1 is not cleaved at the S2 site in the absence of ligand even when ADAMs are activated by TPA. These results are more compatible with ligand binding leading to exposure of the ADAM cleavage site within N1. Therefore, we favor a model in which ligand binding is not sufficient for Notch activation but must be followed by internalization of ligand–NECD complexes into ligand-presenting cells to drive dissociation of heterodimeric N1. In contrast to intact heterodimeric N1, the remaining membrane-associated N1™ would be sensitive to ADAM proteolysis and this cleavage event would remove sequences inhibitory to γ-secretase cleavage (Brown et al., 2000) and thereby allow generation of the biologically active NICD.
Although speculative at this point, Notch activation may require ligand endocytosis for dissociation of the N1 heterodimer and removal of NECD. If this is the case, then soluble ligand-binding assays may not be adequate to evaluate the effects of fringe glycosylation on ligand–Notch interactions that regulate Notch signaling. Indeed, a requirement for ligand endocytosis for effective activation of signaling in the Notch responding cell may account for the low levels of CSL activation induced by clustered soluble ligands reported here and by others (Shimizu et al., 2002). Alternatively, low activation by soluble ligands may reflect physical dissociation of the N1 heterodimer by clustered soluble ligands independent of endocytosis, or binding of clustered soluble ligands may induce receptor clustering to activate signaling. In any event, understanding the mechanism by which fringe differentially modulates ligand-induced Notch signaling may require more sophisticated techniques such as atomic force microscopy (Almqvist et al., 2004), to specifically measure the effects of fringe glycosylation on the strength of ligand–Notch interactions after direct cell–cell interactions.
Glycans added to O-fucosylated Notch by fringe may, depending on the particular interacting ligand, either positively or negatively affect the strength of the resultant ligand-Notch interactions (Figure 9). Specifically, fringe glycosylation may alter the ability of ligand–Notch interactions to survive the “force” produced by ligand endocytosis, especially if strong ligand–Notch interactions are required for efficient transendocytosis of NECD. Integrating these suppositions with our findings, we favor the following model in which fringe glycosylation enhances D1 binding to N1, thereby allowing NECD to remain complexed with D1 during internalization into D1-expressing cells (Figure 9B). Sustained D1–N1 complex formation during ligand internalization would effectively promote physical dissociation of heterodimeric N1 and serve to remove NECD inhibitory sequences. Once NECD is removed from the N1 heterodimer, the remaining membrane-bound N1™ would be sensitive to ADAM proteolysis to generate the S2 fragment that is subsequently cleaved by γ-secretase. Important to our findings, the same N1 fringe glycosylation would not preclude J1 binding; however according to our model, the resultant J1-N1 interactions would not be sufficiently strong to survive the force of ligand internalization that is required to effectively dissociate the noncovalent N1 heterodimer. If NECD is not effectively removed from the N1 heterodimer then N1 proteolysis and activation of signaling will not occur (Figure 9C). In support of this, expression of LFng or MFng did not prevent soluble J1Fc binding to N1, even though the binding correlated with high levels of cell surface N1 as well as decreased N1 proteolysis and signaling.
Figure 9.

Fringe glycosylation differentially modulates Notch1 proteolysis induced by Delta1 and Jagged1. (A) N1 O-fucosylation (circles) allows Delta/Jagged binding and sustained interactions during ligand internalization into the ligand-presenting cell, which function to mechanically dissociate the noncovalent N1 heterodimer. Once the NECD is removed from the N1 cell, the remaining membrane-bound N1 (N1™) is efficiently cleaved at S2 and S3 to release NICD and effect downstream signaling. (B) Fringe glycosylation of N1 (triangles) enhances Delta binding to Notch to promote NECD dissociation and transendocytosis that increase S2 and S3 cleavage and downstream signaling. (C) Jagged binds fringe glycosylated N1 but the interactions with Notch are not sufficiently strong to sustain the “pulling” force that is necessary to remove NECD and thus N1 proteolysis and signaling are suppressed.
The mechanism proposed here for fringe modulation of ligand-induced Notch signaling is based on the premise that events subsequent to ligand binding function to mechanically dissociate the noncovalent N1 heterodimer and activate N1 proteolysis and downstream signaling. However, Drosophila Notch is not processed by furin and the most abundant form on the surface of Drosophila cells is the full-length, uncleaved protein (Kidd and Lieber, 2002). Structural differences between mammalian and Drosophila Notch proteins could account for the different mechanisms reported for DFng and that proposed here for modulation of J1-induced N1 signaling by mammalian fringe glycosyltransferases. Although highly speculative, this model accounts for our soluble J1Fc binding and decreased J1-induced N1 signaling associated with fringe glycosylation and provides a number of testable predictions that we are currently investigating.
Acknowledgments
We thank Carl Blobel for the mutant TACEea construct, TACE antibodies, and numerous valuable conversations regarding ADAMs; Esra Cagavi for the subcloned TACE mammalian expression construct; Tom Vogt for the LFng, MFng, and RFng expression constructs; Guy diSibio for generating the 148G Delta antibody; Falk Fahrenholz for the Kuz cDNA; and Diane Hayward (pJH26), Michael Hancock, and Anthony Orth (pGL3JH26) for CBF1-reporterconstructs. Helpful comments regarding the manuscript from Greg Payne, Alison Miyamoto, Brendan D'Souza, and Luisa Iruela-Arispe were greatly appreciated. L.-T.Y. thanks Joanna Bloom for useful discussions on proteasome inhibitors. Flow cytometry was performed at the UCLA Jonsson Comprehensive Cancer Center and Center for AIDS Research Flow Cytometry Core Facility that is supported by National Institutes of Health awards CA-16042 and AI-28697, and by the Jonsson Comprehensive Cancer Center, the UCLA AIDS Institute, and the David Geffen School of Medicine at UCLA. J. N. thanks Ingrid Schmid and Michael Gulrajani for help with the FACS analysis and the Ruth L. Kirschstein National Research Service Award GM-07185 for support. This work was supported by National Institutes of Health NS31885 and STOP CANCER funds to G. W.
Article published online ahead of print in MBC in Press on December 1, 2004 (http://www.molbiolcell.org/cgi/doi/10.1091/mbc.E04-07-0614).
References
- Almqvist, N., Bhatia, R., Primbs, G., Desai, N., Banerjee, S., and Lal, R. (2004). Elasticity and adhesion force mapping reveals real-time clustering of growth factor receptors and associated changes in local cellular rheological properties. Biophys. J. 86, 1753-1762. [DOI] [PMC free article] [PubMed] [Google Scholar]
- Artavanis-Tsakonas, S., Rand, M. D., and Lake, R. J. (1999). Notch signaling: cell fate control and signal integration in development. Science 284, 770-776. [DOI] [PubMed] [Google Scholar]
- Aster, J. C., Robertson, E. S., Hasserjian, R. P., Turner, J. R., Kieff, E., and Sklar, J. (1997). Oncogenic forms of NOTCH1 lacking either the primary binding site for RBP-Jkappa or nuclear localization sequences retain the ability to associate with RBP-Jkappa and activate transcription. J. Biol. Chem. 272, 11336-11343. [DOI] [PubMed] [Google Scholar]
- Bland, C. E., Kimberly, P., and Rand, M. D. (2003). Notch induced proteolysis and nuclear localization of the Delta ligand. J. Biol. Chem. 278, 13607-13610. [DOI] [PubMed] [Google Scholar]
- Brou, C., Logeat, F., Gupta, N., Bessia, C., LeBail, O., Doedens, J. R., Cumano, A., Roux, P., A., B. R., and Israel, A. (2000). A novel proteolytic cleavage involved in Notch signaling: the role of the disintegrin-metalloprotease TACE. Mol. Cell 5, 207-216. [DOI] [PubMed] [Google Scholar]
- Brown, M. S., Ye, J., Rawson, R. B., and Goldstein, J. L. (2000). Regulated intramembrane proteolysis: a control mechanism conserved from bacteria to humans. Cell 100, 391-398. [DOI] [PubMed] [Google Scholar]
- Bruckner, K., Perez, L., Clausen, H., and Cohen, S. (2000). Glycosyltransferase activity of Fringe modulates Notch-Delta interactions. Nature 406, 411-415. [DOI] [PubMed] [Google Scholar]
- Bush, G., diSibio, G., Miyamoto, A., Denault, J. B., Leduc, R., and Weinmaster, G. (2001). Ligand-induced signaling in the absence of furin processing of Notch1. Dev. Biol. 229, 494-502. [DOI] [PubMed] [Google Scholar]
- Chen, J., Moloney, D. J., and Stanley, P. (2001). Fringe modulation of Jagged1-induced Notch signaling requires the action of beta 4galactosyltransferase-1. Proc. Natl. Acad. Sci. USA 98, 13716-13721. [DOI] [PMC free article] [PubMed] [Google Scholar]
- Dovey, H. F., et al. (2001). Functional gamma-secretase inhibitors reduce beta-amyloid peptide levels in brain. J. Neurochem. 76, 173-181. [DOI] [PubMed] [Google Scholar]
- Evrard, Y. A., Lun, Y., Aulehla, A., Gan, L., and Johnson, R. L. (1998). lunatic fringe is an essential mediator of somite segmentation and patterning. Nature 394, 377-381. [DOI] [PubMed] [Google Scholar]
- Foltz, D. R., and Nye, J. S. (2001). Hyperphosphorylation and association with RBP of the intracellular domain of Notch1. BBRC 286, 484-492. [DOI] [PubMed] [Google Scholar]
- Goto, S., Taniguchi, M., Muraoka, M., Toyoda, H., Sado, Y., Kawakita, M., and Hayashi, S. (2001). UDP-sugar transporter implicated in glycosylation and processing of Notch. Nat. Cell Biol. 3, 816-822. [DOI] [PubMed] [Google Scholar]
- Haines, N., and Irvine, K. D. (2003). Glycosylation regulates Notch signalling. Nat. Rev. Mol. Cell. Biol. 4, 786-797. [DOI] [PubMed] [Google Scholar]
- Haltiwanger, R. S. (2002). Regulation of signal transduction pathways in development by glycosylation. Curr. Opin. Struct. Biol. 12, 593-598. [DOI] [PubMed] [Google Scholar]
- Haltiwanger, R. S., and Stanley, P. (2002). Modulation of receptor signaling by glycosylation: fringe is an O-fucose-B1,3-N-acetylglucosaminyltransferase. Biochim. Biophys. Acta 1573, 328-335. [DOI] [PubMed] [Google Scholar]
- Hartmann, D., et al. (2002). The disintegrin/metalloprotease ADAM 10 is essential for Notch signalling but not for alpha-secretase activity in fibroblasts. Hum. Mol. Genet. 11, 2615-2624. [DOI] [PubMed] [Google Scholar]
- Hicks, C., Johnston, S. H., diSibio, G., Collazo, A., Vogt, T. F., and Weinmaster, G. (2000). Fringe differentially modulates Jagged1 and Delta1 signalling through Notch1 and Notch2. Nat. Cell Biol. 2, 515-520. [DOI] [PubMed] [Google Scholar]
- Hicks, C., Ladi, E., Lindsell, C., Hsieh, J., Hayward, S., Collazo, A., and Weinmaster, G. (2002). A secreted Delta1-Fc fusion protein functions both as an activator and inhibitor of Notch1 signaling. J. Neurosci. Res. 69, 60-71. [DOI] [PubMed] [Google Scholar]
- Johnston, S. H., Rauskolb, C., Wilson, R., Prabhakaran, B., Irvine, K. D., and Vogt, T. F. (1997). A family of mammalian Fringe genes implicated in boundary determination and the Notch pathway. Development 124, 2245-2254. [DOI] [PubMed] [Google Scholar]
- Kidd, S., and Lieber, T. (2002). Furin cleavage is not a requirement for Drosophila Notch function. Mech. Dev. 115, 41-51. [DOI] [PubMed] [Google Scholar]
- Kopan, R., Schroeter, E. H., Weintraub, H., and Nye, J. S. (1996). Signal transduction by activated mNotch: importance of proteolytic processing and its regulation by the extracellular domain. Proc. Natl. Acad. Sci. USA 93, 1683-1688. [DOI] [PMC free article] [PubMed] [Google Scholar]
- Laufer, E., Dahn, R., Orozco, O. E., Yeo, C. Y., Pisenti, J., Henrique, D., Abbott, U. K., Fallon, J. F., and Tabin, C. (1997). Expression of Radical fringe in limb-bud ectoderm regulates apical ectodermal ridge formation. Nature 386, 366-373. [DOI] [PubMed] [Google Scholar]
- LaVoie, M. J., and Selkoe, D. J. (2003). The Notch ligands, Jagged and Delta, are sequentially processed by alpha-secretase and presenilin/gamma-secretase and release signaling fragments. J. Biol. Chem. 278, 34427-34437. [DOI] [PubMed] [Google Scholar]
- Lei, L., Xu, A., Panin, V. M., and Irvine, K. D. (2003). An O-fucose site in the ligand binding domain inhibits Notch activation. Development 130, 6411-6421. [DOI] [PubMed] [Google Scholar]
- Lieber, T., Kidd, S., Alcamo, E., Corbin, V., and Young, M. W. (1993). Antineurogenic phenotypes induced by truncated Notch proteins indicate a role in signal transduction and may point to a novel function for Notch in nuclei. Genes Dev. 7, 1949-1965. [DOI] [PubMed] [Google Scholar]
- Lieber, T., Kidd, S., and Young, M. W. (2002). kuzbanian-mediated cleavage of Drosophila Notch. Genes Dev. 16, 209-221. [DOI] [PMC free article] [PubMed] [Google Scholar]
- Logeat, F., Bessia, C., Brou, C., LeBail, O., Jarriault, S., Seiday, N., and Israel, A. (1998). The Notch1 receptor is cleaved constitutively by a furin-like convertase. Proc. Natl. Acad. Sci. USA 95, 8108-8112. [DOI] [PMC free article] [PubMed] [Google Scholar]
- Moloney, D. J., et al. (2000). Fringe is a glycosyltransferase that modifies Notch. Nature 406, 369-375. [DOI] [PubMed] [Google Scholar]
- Morrison, S. J., Perez, S. E., Qiao, Z., Verdi, J. M., Hicks, C., Weinmaster, G., and Anderson, D. J. (2000). Transient Notch activation initiates an irreversible switch from neurogenesis to gliogenesis by neural crest stem cells. Cell 101, 499-510. [DOI] [PubMed] [Google Scholar]
- Mumm, J. S., and Kopan, R. (2000). Notch signaling: from the outside in. Dev. Biol. 228, 151-165. [DOI] [PubMed] [Google Scholar]
- Mumm, J. S., Schroeter, E. H., Saxena, M. T., Griesemer, A., Tian, X., Pan, D. J., Ray, W. J., and Kopan, R. (2000). A ligand-induced extracellular cleavage regulates g-secretase-like proteolytic activation of Notch1. Mol. Cell 5, 197-206. [DOI] [PubMed] [Google Scholar]
- Munro, S., and Freeman, M. (2000). The notch signalling regulator fringe acts in the Golgi apparatus and requires the glycosyltransferase signature motif DXD. Curr. Biol. 10, 813-820. [DOI] [PubMed] [Google Scholar]
- Nofziger, D., Miyamoto, A., Lyons, K. M., and Weinmaster, G. (1999). Notch signaling imposes two distinct blocks in the differentiation of C2C12 myoblasts. Development 126, 1689-1702. [DOI] [PubMed] [Google Scholar]
- Okajima, T., and Irvine, K. D. (2002). Regulation of Notch signaling by O-linked fucose. Cell 111, 893-904. [DOI] [PubMed] [Google Scholar]
- Okajima, T., Xu, A., and Irvine, K. D. (2003). Modulation of notch-ligand binding by protein O-fucosyltransferase 1 and fringe. J. Biol. Chem. 278, 42340-42345. [DOI] [PubMed] [Google Scholar]
- Pan, D., and Rubin, G. M. (1997). Kuzbanian controls proteolytic processing of Notch and mediates lateral inhibition during Drosophila and vertebrate neurogenesis. Cell 90, 271-280. [DOI] [PubMed] [Google Scholar]
- Panin, V. M., Shao, L., Lei, L., Moloney, D. J., Irvine, K. D., and Haltiwanger, R. S. (2002). Notch ligands are substrates for Protein O-fucosyltransferase and Fringe. J. Biol. Chem. 29, 29. [DOI] [PubMed] [Google Scholar]
- Parks, A. L., Klueg, K. M., Stout, J. R., and Muskavitch, M. A. (2000). Ligand endocytosis drives receptor dissociation and activation in the Notch pathway. Development 127, 1373-1385. [DOI] [PubMed] [Google Scholar]
- Pear, W. S., Aster, J. C., Scott, M. L., Hasserjian, R. P., Soffer, B., Sklar, J., and Baltimore, D. (1996). Exclusive development of T cell neoplasms in mice transplanted with bone marrow expressing activated Notch alleles. J. Exp. Med. 183, 2283-2291. [DOI] [PMC free article] [PubMed] [Google Scholar]
- Rand, M. D., Grimm, L. M., Artavanis-Tsakonas, S., Patriub, V., Blacklow, S. C., Sklar, J., and Aster, J. C. (2000). Calcium depletion dissociates and activates heterodimeric notch receptors. Mol. Cell. Biol. 20, 1825-1835. [DOI] [PMC free article] [PubMed] [Google Scholar]
- Ray, W. J., Yao, M., Nowotny, P., Mumm, J., Zhang, W., Wu, J. Y., Kopan, R., and Goate, A. M. (1999). Evidence for a physical interaction between presenilin and Notch. Proc. Natl. Acad. Sci. USA 96, 3263-3268. [DOI] [PMC free article] [PubMed] [Google Scholar]
- Robey, E. A., and Bluestone, J. A. (2004). Notch signaling in lymphocyte development and function. Curr. Opin. Immunol. 16, 360-366. [DOI] [PubMed] [Google Scholar]
- Sahin, U., Weskamp, G., Kelly, K., Zhou, H. M., Higashiyama, S., Peschon, J., Hartmann, D., Saftig, P., and Blobel, C. P. (2004). Distinct roles for ADAM10 and ADAM17 in ectodomain shedding of six EGFR ligands. J. Cell Biol. 164, 769-779. [DOI] [PMC free article] [PubMed] [Google Scholar]
- Sasamura, T., et al. (2003). neurotic, a novel maternal neurogenic gene, encodes an O-fucosyltransferase that is essential for Notch-Delta interactions. Development 130, 4785-4795. [DOI] [PubMed] [Google Scholar]
- Schroeter, E., Kisslinger, J., and Kopan, R. (1998). Notch1 signalling requires ligand-induced proteolytic release of the intracellular domain. Nature 393, 382-386. [DOI] [PubMed] [Google Scholar]
- Schweisguth, F. (1999). Dominant-negative mutation in the beta2 and beta6 proteasome subunit genes affect alternative cell fate decisions in the Drosophila sense organ lineage. Proc. Natl. Acad. Sci. USA 96, 11382-11386. [DOI] [PMC free article] [PubMed] [Google Scholar]
- Seals, D. F., and Courtneidge, S. A. (2003). The ADAMs family of metallo-proteases: multidomain proteins with multiple functions. Genes Dev. 17, 7-30. [DOI] [PubMed] [Google Scholar]
- Shao, L., Moloney, D. J., and Haltiwanger, R. S. (2003). Fringe modifies O-fucose on mouse Notch1 at EGF repeats within the ligand-binding site and the Abruptex region. J. Biol. Chem. 278, 7775-7782. [DOI] [PubMed] [Google Scholar]
- Shawber, C., Nofziger, D., Hsieh, J., Lindsell, C., Bogler, O., Hayward, D., and Weinmaster, G. (1996). Notch signalling inhibits muscle cell differentiation through a CBF1-independent pathway. Development 122, 3765-3773. [DOI] [PubMed] [Google Scholar]
- Shi, S., and Stanley, P. (2003). Protein O-fucosyltransferase1 is an essential component of Notch signaling pathways. Proc. Natl. Acad. Sci. USA 100, 5234-5239. [DOI] [PMC free article] [PubMed] [Google Scholar]
- Shimizu, K., Chiba, S., Hosoya, N., Kumano, K., Saito, T., Kurokawa, M., Kanda, Y., Hamada, Y., and Hirai, H. (2000a). Binding of Delta1, Jagged1, and Jagged2 to Notch2 rapidly induces cleavage, nuclear translocation, and hyperphosphorylation of Notch2. Mol. Cell. Biol. 20, 6913-6922. [DOI] [PMC free article] [PubMed] [Google Scholar]
- Shimizu, K., Chiba, S., Kumano, K., Hosoya, N., Takahashi, T., Kanda, Y., Hamada, Y., Yazaki, Y., and Hirai, H. (1999). Mouse Jagged1 Physically Interacts with Notch2 and Other Notch Receptors. Assessment by quantitative methods. J. Biol. Chem. 274, 32961-32969. [DOI] [PubMed] [Google Scholar]
- Shimizu, K., Chiba, S., Saito, T., Kumano, K., and Hirai, H. (2000b). Physical interaction of Delta1, Jagged1, and Jagged2 with Notch1 and Notch3 receptors. Biochem. Biophys. Res. Commun. 276, 385-389. [DOI] [PubMed] [Google Scholar]
- Shimizu, K., Chiba, S., Saito, T., Kumano, K., Takahashi, T., and Hirai, H. (2001). Manic fringe and lunatic fringe modify different sites of the Notch2 extracellular region, resulting in different signaling modulation. J. Biol. Chem. 276, 25753-25758. [DOI] [PubMed] [Google Scholar]
- Shimizu, K., Chiba, S., Saito, T., Takahashi, T., Kumano, K., Hamada, Y., and Hirai, H. (2002). Integrity of intracellular domain of Notch ligand is indispensable for cleavage required for release of the Notch2 intracellular domain. EMBO J. 21, 294-302. [DOI] [PMC free article] [PubMed] [Google Scholar]
- Struhl, G., and Adachi, A. (1998). Nuclear access and action of notch in vivo. Cell 93, 649-660. [DOI] [PubMed] [Google Scholar]
- Varnum-Finney, B., Wu, L., Yu, M., Brashem-Stein, C., Staats, S., Flowers, D., Griffin, J. D., and Bernstein, I. D. (2000). Immobilization of Notch ligand, Delta-1, is required for induction of notch signaling. J. Cell Sci. 113, 4313-4318. [DOI] [PubMed] [Google Scholar]
- Wang, S., Sdrulla, A. D., diSibio, G., Bush, G., Nofziger, D., Hicks, C., Weinmaster, G., and Barres, B. (1998). Notch receptor activation inhibits oligodendrocyte differentiation. Neuron 21, 63-75. [DOI] [PubMed] [Google Scholar]
- Weinmaster, G. (1997). The ins and outs of notch signaling. Mol. Cell Neurosci. 9, 91-102. [DOI] [PubMed] [Google Scholar]
- Weinmaster, G. (2000). Notch signal transduction: a real rip and more. Curr. Opin. Genet Dev. 10, 363-369. [DOI] [PubMed] [Google Scholar]
- Wu, G., Lyapina, S., Das, I., Li, J., Gurney, M., Pauley, A., Chui, I., Deshaies, R. J., and Kitajewski, J. (2001). SEL-10 is an inhibitor of notch signaling that targets notch for ubiquitin-mediated protein degradation. Mol. Cell. Biol. 21, 7403-7415. [DOI] [PMC free article] [PubMed] [Google Scholar]
- Zhang, N., and Gridley, T. (1998). Defects in somite formation in lunatic fringe-deficient mice. Nature 394, 374-377. [DOI] [PubMed] [Google Scholar]
- Zhang, N., Norton, C. R., and Gridley, T. (2002). Segmentation defects of Notch pathway mutants and absence of a synergistic phenotype in lunatic fringe/radical fringe double mutant mice. Genesis 33, 21-28. [DOI] [PubMed] [Google Scholar]