Figure 6.

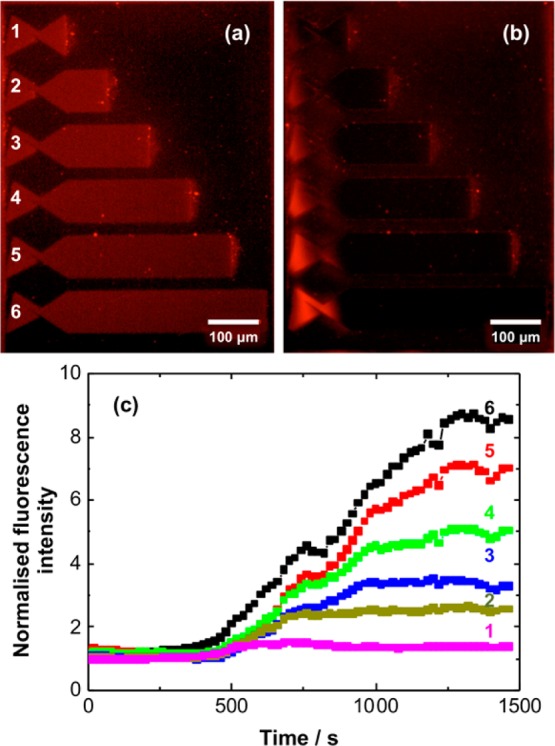
Fluorescence micrographs of trap structures before (a) and after (b) application of a 100 V dc potential for 20 min. (c) Time dependence of the fluorescence intensity measured at the left-hand side of the trap structures in panels a and b.

Fluorescence micrographs of trap structures before (a) and after (b) application of a 100 V dc potential for 20 min. (c) Time dependence of the fluorescence intensity measured at the left-hand side of the trap structures in panels a and b.