

Abstract
Importance
Over the last decade, acute myocardial infarction (AMI) incidence and mortality have decreased substantially. Yet it is unknown whether these improvements were consistent across communities of different economic status and geographic regions, for which efforts to improve cardiovascular disease prevention and management may have had variable impact.
Objective
To determine whether trends in county-level risk-standardized AMI hospitalization and mortality rates varied by county-based median income level.
Design
Observational study from 1999 to 2013.
Setting
National study of U.S. counties.
Participants
County-level risk-standardized (age, sex, race) hospitalization and 1-year mortality rates for AMI from 1999 to 2013 were measured for Medicare beneficiaries ≥65 years.
Exposures
Counties were stratified by median income percentile using 1999 U.S. Census Bureau data, adjusted for inflation: low (<25th), average (25–75th) or high (>75th) income groups.
Main Outcome and Measure
We examined the effect of income on the slope of AMI hospitalizations and mortality. We measured differences in rate of change in AMI hospitalizations and mortality by county income and by the 4 U.S. geographic regions. We also tested for a ‘lag’ effect among low-income counties.
Results
In the 15-year period, AMI risk-standardized hospitalization and mortality rates decreased significantly for all three county income groups. Average hospitalization rates were significantly higher among low-income counties compared with high-income counties, with rates for low-income counties in 2013 lower than for high-income counties in 1999 (853 versus 1,123 per 100,000 person years, respectively). 1-year mortality rates after hospitalization for AMI were similar across county income groups, decreasing from 1999 (31.5%, 31.4%, and 31.1%, for high, average and low income counties, respectively) to 2013 (26.2%, 26.1%, and 25.4%). The rate of decline in AMI hospitalizations was similar for all county income groups; however, low-income counties lagged behind high-income counties by 4.3 (95% CI 3.1 to 5.9) years. There were no differences in trends across geographic regions.
Conclusion and Relevance
AMI hospitalization and mortality rates declined among counties of all income levels, though hospitalization rates among low-income counties lag behind. These findings lend support for a more targeted community-based approached to AMI prevention.
INTRODUCTION
There are longstanding disparities in cardiovascular disease prevalence and outcomes based on a neighborhood or regions’ income.1–6 In many low-income areas, there are several challenges to improving cardiovascular outcomes, including: inadequate physician supply;7–9 poor healthcare quality;10–12 and limited resources to implement policies and programs designed to prevent and manage cardiovascular disease.13–16 Concurrently, populations living in these communities tend to have fewer opportunities to engage in healthy behaviors, greater exposure to stress, and higher rates of cardiovascular risk factors. Thus, it is generally accepted that living in a disadvantaged area puts people at higher risk for cardiovascular events.17,18
Over the last decade and a half, however, there have been significant population health initiatives to improve cardiovascular health and reduce health disparities.19 Campaigns such as Healthy People 2010,20 the American Heart Association’s 2010 and 2020 Impact Goal,21 Million Hearts and others,22 set forth national agendas of policy and system-level reforms to impact community and clinical care environments. There has been greater attention to ambulatory care access, evidence-based practice, quality measurement and reporting, and implementation of policies and programs to support healthy lifestyle behaviors. In this period, from 1999 to 2011, the national hospitalization rate for acute myocardial infarction (AMI) declined by 38% and the 1-year mortality rate for AMI decreased by 23%.23 Yet it is unknown whether these trends were consistent across communities of different economic status and geographic regions, for which efforts to improve cardiovascular disease prevention and management may have had variable penetration and impact. Specifically, we lack data on trends in AMI incidence and outcomes among low-income communities as compared with high-income communities, important for reducing health disparities.
Accordingly, we examined disparities in trends in AMI hospitalization and 1-year mortality rates among counties of low, average, and high income. The median income was selected as an indicator of a county’s socioeconomic status as it is sensitive to economic trends24 and may serve as a proxy of unmeasured environmental contextual factors associated with geographic communities.25–27 Our aims were to describe the association between county-level median income and AMI hospitalization and mortality rates; assess trends in AMI hospitalization and mortality rates by county-level median income and across geographic regions; and perform a lag analysis to determine the additional years needed, if any, for low-income counties to achieve outcomes similar to high-income communities. We hypothesized that counties of low-income would follow different trends than high-income counties, with higher hospitalization and mortality rates for AMI at all time periods; we additionally hypothesized that these effects would be most pronounced in the South, a region with the highest county-level rates of cardiovascular risk factors and disease, and deepest socioeconomic challenges.28,29 This national perspective on trends in AMI incidence and mortality by county-level income can help to interpret the effectiveness of past campaigns to improve CV health and can inform whether future efforts should target the most vulnerable communities.
METHODS
Study Population
We used the Medicare denominator files to identify Medicare beneficiaries aged 65 years or older who were enrolled in the Fee-For-Service plan for at least one month during the time period of January 1, 1999 to December 31, 2013. To account for new enrollment, disenrollment and death, we calculated the person-years contributed by each beneficiary during the study period. We linked the person-years beneficiary data to the Medicare inpatient claims data and identified beneficiaries discharged from an acute-care hospital with a principal discharge diagnosis of 410.xx based on the International Classification of Diseases, Ninth Revision, Clinical Modification codes. We assessed demographic characteristics of patients hospitalized with AMI, including age, sex, race (White, Black, Other), and Medicare-Medicaid dual eligibility from the denominator file. Clinical comorbidities were identified using secondary diagnoses of inpatient claims data from the incident hospitalization and the primary and secondary diagnoses from hospitalizations that occurred in the preceding 12 months.30 We assigned beneficiaries to counties based on the zip code of their residence at the time of hospitalization for AMI. The Yale University Human Investigation Committee approved the study and waived the requirement for informed consent.
County Characteristics
Using data from the U.S. Census Bureau, we determined the median income and percentage of people living below the federal poverty level by county for each year from 1999 through 2013. We compared county-level income with county-level poverty rates and found a high correlation (supplement Table S1). Thus, consistent with prior studies, we used median income to characterize the socioeconomic status of the county in each year.31–36 County-level median income was adjusted for the consumer price index (CPI), with 2013 as the index year, to account for inflation.37 We stratified counties into three mutually exclusive categories based on each county’s annual median income level: “low-income,” if the median income was less than the 25th percentile of the national level, “high-income” if greater than the 75th percentile, and “average income,” if otherwise. We obtained county-level covariates from the U.S. Census Bureau, including the estimated population size, proportion of residents over age 65 years, percent female, percent white/non-Hispanic, black/non-Hispanic, other race/non-Hispanic, and Hispanic. For each county, we also calculated the proportion of Medicare-Medicaid dual eligible based on Medicare data.
Outcomes
Our primary outcomes were risk-standardized AMI hospitalizations and 1-year mortality following AMI. We calculated the observed AMI hospitalization rates by dividing the total numbers of AMI hospitalizations in each year by the corresponding person-years of Fee-For-Service beneficiaries for that year for each county by each age group (65–74, 75–84, and 85 or older), race group (white, black, and other race), and sex group (male and female). For hospitalizations, if a beneficiary had more than one AMI hospitalization in a given year we counted them all. We determined 1-year mortality following AMI using the death information in the denominator files, regardless of cause of death. The 2014 denominator file was used to obtain mortality information for beneficiaries discharged in 2013. We calculated the mortality by dividing the total number of all-cause deaths following AMI in each year by the corresponding total number of Fee-For-Service beneficiaries who were hospitalized for AMI for that year. For mortality, if a beneficiary had more than one AMI hospitalization in a given year we randomly selected one. This was based on the rationale of minimizing sample selection bias, in which selecting the first hospitalization would result in a relatively low mortality rate, and selecting the last hospitalization would result in a relatively high mortality rate.
To obtain the risk-standardized AMI hospitalization rate for each county or county-equivalent and for each year from 1999 to 2013, we extended the CMS hierarchical model29 used for profiling hospital performance on outcomes with a Poisson link function and county-specific random intercepts to model the number of AMI hospitalizations as a function of beneficiaries’ age, sex, and race and accounting for spatial differences between counties. We repeated this hierarchical model with a logit link function, adjusting for patient comorbidities, to calculate the risk-standardized 1-year all-cause mortality following AMI.
Statistical analyses
We examined trends in patient characteristics, hospitalization rates, and one-year mortality rates for each county over the study period, stratified by the three income categories. Hospitalization estimates were expressed in the number of events per 100,000 person-years and 1-year mortality rates were expressed as percentages. We evaluated the association between income and county-level risk-standardized AMI hospitalizations by fitting a mixed effects model with the county-specific risk-standardized AMI hospitalization rate as a function of change in median income, defined as one inter-quartile range (IQR) of median income, adjusted for county-specific covariates described previously. Time was modeled as a continuous variable corresponding to years 1999 (time = 0) to 2013 (time = 14); an interaction term between time and change in median income was included in the model. We repeated the model for the one-year mortality outcome.
To assess the difference in the rates of change in AMI hospitalization rates among the three county-income groups over the study period, we fitted a random intercept (county) and coefficient (time) model with the risk-standardized AMI hospitalization rate as a function of two binary income group indicators (low income and average income, with the reference group being the high income group), a time variable, and interaction terms between income group and time, adjusted for the county-specific proportion of residents over age 65 years and percent female. We repeated this model for the 1-year AMI mortality rate. We estimated the “lag effects” using the method described in the online appendix, to obtain the number of additional years needed for low- and average-income counties to achieve the hospitalization rates of high-income counties in 2013.
To assess geographic differences in changes of AMI hospitalization and mortality rates, we mapped county-specific risk-standardized AMI hospitalization separately for 1999 and 2013, using the 1999 distribution of AMI hospitalization rates as the gradient reference. We also divided counties into 4 regions: Northeast, West, Midwest and South, based on US Census regional definition. For each region, we reclassified counties into region-specific income categories based on regional distributions of median income. As a result, the thresholds for defining low-, average-, and high-income counties vary by region, which considers regional differences in cost-of-living and standardizes comparisons among and between regions. Analyses were conducted using SAS version 9.3 64-bit (SAS Institute Inc, Cary, North Carolina).
RESULTS
Study population
We identified 60,056,069 unique Medicare beneficiaries aged ≥65 years who were enrolled in the Medicare Fee-For-Service program for ≥1 month from 1999 to 2013 (Table 1), contributing 416,667,038 person-years. There were a total of 4,290,784 hospitalizations for AMI, contributed by 3,294,700 unique patients during this period. The total number of counties or county equivalents without missing income information was 3,131 in 1999 and 2013. Between 1999 and 2013 the CPI adjusted median (IQR) incomes decreased among all county-income groups, from $37,271 (4,912) to $34,593 (4,329), $46,344 (6,230) to $43,966 (6,253), and $60,495 (11,455) to $57,559 (11,948) for low, average, and high-income groups (eFigure 1). Between 1999 and 2013, 79.1% of low-income, 78.3% of average-income, and 76.6% of high-income counties remained unchanged in their income classification (eFigure 2). In 1999, there were 2,512,262 person-years of Fee-For-Service beneficiaries in 783 low-income counties, 9,812,513 person-years of beneficiaries in 1,565 average-income counties, and 14,248,657 person-years of beneficiaries in 783 high-income counties. Comparison of counties by income status across three time-periods, 1999, 2006 and 2013, revealed that for all years, low-income counties had smaller populations and more residents ≥65 years of age compared with high-income counties (Table 1). The greatest proportion of White residents lived in high-income counties, though this decreased over time, offset by increasing proportions of Hispanic residents living in high-income counties. The greatest proportion of Black residents lived in low-income communities and did not change over time. The prevalence of comorbidities among Medicare beneficiaries did not substantially differ among county income groups (Table 1).
Table 1.
Characteristics of U.S. counties and Fee-For-Service beneficiaries, stratified by median-county household income* (1999, 2006, and 2013)
| 1999 County CPI-adjusted Income Group |
2006 County Income Group |
2013 County Income Group |
|||||||
|---|---|---|---|---|---|---|---|---|---|
| Low | Average | High | Low | Average | High | Low | Average | High | |
| Counties | |||||||||
| Total population (in million) | 21.8 | 85.8 | 180.8 | 20.2 | 100.3 | 187.5 | 23.2 | 121.6 | 176.6 |
| Age, Proportion ≥65 yrs, (SD) | 13.4 (3.5) | 14.2 (3.9) | 11.4 (3.0) | 14.0 (3.6) | 13.8 (3.5) | 11.5 (2.8) | 14.9 (3.8) | 14.4 (3.9) | 12.2 (2.7) |
| Proportion female, (SD) | 52.0 (2.0) | 51.1 (1.5) | 50.1 (1.0) | 51.1 (2.2) | 50.9 (1.5) | 51.0 (0.9) | 51.0 (2.1) | 50.8 (1.4) | 50.8 (8.4) |
| Median CPI-adjusted income in $1,000 (IQR) | 38.1 (3.9) | 48.2 (6.2) | 61.4 (15.9) | 36.5 (4.3) | 47.8 (4.8) | 61.1 (14.6) | 34.8 (3.7) | 45.4 (6.1) | 59.1 (17.0) |
| Race and ethnicity, % (SD) | |||||||||
| Non-Hispanic Black | 22.8 (22.0) | 12.7 (13.7) | 11.0 (10.3) | 20.9 (21.1) | 13.9 (14.4) | 10.2 (9.7) | 21.7 (21.3) | 13.8 (13.5) | 9.8 (9.1) |
| Non-Hispanic white | 55.4 (29.5) | 74.6 (20.9) | 68.7 (20.3) | 56.0 (30.2) | 70.0 (21.5) | 63.0 (21.0) | 58.0 (29.0) | 66.3 (21.9) | 60.1 (21.4) |
| Hispanic | 17.6 (27.0) | 9.8 (14.7) | 14.3 (14.0) | 18.6 (28.8) | 12.0 (16.3) | 17.8 (14.6) | 14.3 (24.9) | 14.9 (17.6) | 19.8 (15.4) |
| Medicare Fee-For-Service Beneficiaries+ | |||||||||
| Total (# in million) | 2.5 | 9.8 | 14.2 | 2.3 | 10.9 | 15.5 | 2.5 | 12.0 | 14.7 |
| Proportion of total population | 11.5 | 11.4 | 7.9 | 11.4 | 10.9 | 8.3 | 10.8 | 9.9 | 8.3 |
| Proportion dual-eligible for Medicaid, (SD) | 24.6 (9.4) | 14.6 (8.0) | 12.1 (9.0) | 25.6 (10.2) | 14.5 (8.9) | 13.1 (10.1) | 22.5 (9.5) | 14.0 (8.4) | 12.7 (9.3) |
| Beneficiaries hospitalized for AMI (# in thousand) | 28.8 | 109.3 | 140.9 | 22.3 | 95.7 | 119.1 | 21.5 | 87.3 | 89.9 |
| Mean age | 77.9 (1.6) | 78.2 (1.3) | 78.6 (1.1) | 77.8 (1.7) | 78.5 (1.5) | 79.3 (1.2) | 77.4 (1.8) | 78.2 (1.6) | 78.8 (1.3) |
| Proportion male | 48.5 (9.3) | 50.0 (7.2) | 49.5 (4.7) | 51.0 (10.1) | 50.5 (7.5) | 49.8 (5.3) | 53.6 (9.7) | 53.7 (7.6) | 53.6 (5.6) |
| Common comorbidities, % | |||||||||
| History of CHF | 18.2 (6.9) | 16.1 (5.2) | 16.1 (3.8) | 18.3 (8.2) | 16.5 (6.2) | 16.8 (4.2) | 16.4 (8.1) | 15.3 (5.8) | 15.7 (4.5) |
| Prior MI | 7.8 (4.4) | 7.3 (3.3) | 7.1 (2.2) | 7.1 (4.8) | 6.9 (3.5) | 6.8 (2.2) | 7.6 (5.1) | 7.3 (3.6) | 7.2 (2.6) |
| Unstable Angina | 7.2 (4.3) | 6.4 (3.2) | 6.2 (2.0) | 4.6 (4.1) | 3.9 (2.5) | 3.8 (1.6) | 3.3 (3.4) | 3.1 (2.3) | 3.4 (1.9) |
| Hypertension | 52.3 (9.7) | 51.5 (7.3) | 52.2 (5.2) | 60.0 (10.0) | 58.2 (7.6) | 58.1 (5.2) | 70.0 (9.8) | 68.3 (7.0) | 67.4 (5.5) |
| Stroke | 2.3 (2.4) | 2.1 (1.7) | 2.1 (1.1) | 2.0 (2.4) | 2.0 (1.7) | 1.9 (1.2) | 2.0 (2.5) | 1.7 (1.5) | 2.0 (1.2) |
| Pneumonia | 14.1 (6.3) | 12.0 (4.6) | 12.0 (3.3) | 15.4 (7.7) | 14.1 (5.3) | 14.9 (3.7) | 16.7 (8.1) | 15.2 (5.5) | 15.3 (4.4) |
| Cancer | 5.9 (3.7) | 5.7 (2.7) | 6.3 (1.9) | 6.1 (4.4) | 6.4 (3.2) | 6.9 (2.2) | 5.4 (4.1) | 6.1 (3.1) | 6.8 (2.5) |
| Depression | 3.7 (3.2) | 3.9 (2.6) | 4.1 (1.7) | 5.2 (4.2) | 5.5 (3.0) | 5.3 (2.1) | 5.9 (4.6) | 6.0 (3.2) | 5.9 (2.5) |
| Diabetes | 31.9 (8.9) | 30.3 (6.3) | 29.5 (4.3) | 34.7 (10.4) | 31.5 (6.8) | 30.6 (4.8) | 37.6 (10.4) | 35.0 (7.5) | 34.0 (5.8) |
| Observed AMI hospitalization rate, per 100,000 person-years | 1452.8 (521.1) | 1375.1 (279.1) | 1183.7 (284.1) | 1140.7 (405.7) | 1009.7 (290.9) | 890.9 (219.0) | 942.0 (341.3) | 798.2 (243.5) | 681.4 (176.9) |
| Risk-standardized AMI hospitalization rate, per 100,000 person-years | 1352.7 (362.2) | 1286.5 (282.4) | 1122.5 (233.8) | 1085.3 (281.7) | 984.0 (226.5) | 874.0 (189.7) | 852.9 (228.5) | 744.0 (182.7) | 648.3 (147.2) |
| Observed AMI 1-year mortality rate, % | 32.7 (8.5) | 31.0 (6.1) | 31.1 (4.1) | 28.9 (9.0) | 27.9 (6.5) | 28.2 (4.5) | 26.3 (8.9) | 26.1 (6.4) | 25.8 (4.7) |
| Risk-standardized AMI 1-year mortality rate, % | 31.5 (1.0) | 31.4 (1.2) | 31.1 (1.2) | 28.3 (1.0) | 28.3 (1.1) | 27.8 (1.4) | 26.2 (0.9) | 26.1 (1.1) | 25.4 (1.3) |
Method for classifying counties as low, average, or high income is described in text. Number in parentheses indicates standard deviation, unless otherwise specified.
Refers to Medicare Fee-For-Service beneficiaries residing in the relevant county group.
Abbreviations: AMI, acute myocardial infarction; CHF, congestive heart failure; CPI, consumer price index; FFS, Fee-For-Service; FPL, federal poverty level; MI, myocardial infarction.
Association between income and AMI hospitalization and mortality rates
Income was associated with county-level risk-standardized AMI hospitalization and mortality rates and this association persistent over the study period (Figure 2 and eFigure 4). Increasing one IQR of median county CPI-adjusted income ($12,000) was associated with a decline in 46 and 37 hospitalizations per 100,000 person-years for 1999 and 2013, respectively. Although there was an interaction between income and time for the hospitalization rate, the effect was small (0.56). The association between income and AMI hospitalizations varied by income groups. For low-, average-, and high-income groups, respectively, each IQR increase was associated with a decrease in hospitalization rates of 74, 47, and 32 per 100,000 person-years.
Figure 2. Association between county-level risk-standardized hospitalization rates for AMI and income, 1999 to 2013.

County-level risk-standardized AMI hospitalization rates (per 100,000 person years) are plotted, with colors indicating year of hospitalization rates (red [1999]; yellow [2005]; green [2013]). The x-axis represents county-level CPI-adjusted median income in 1999.
Trends in hospitalizations and mortality by county-income groups
County-level AMI risk-standardized hospitalization rates decreased significantly from 1999 to 2013 for all counties (eFigure 3). However, hospitalization rates varied by income groups (Figure 1). The greatest number of AMI hospitalizations occurred in low-income counties (140,922 in 1999, 119,125 in 2006, and 89,893 in 2013) and lowest number of AMI hospitalizations occurred in high-income counties (28,756 in 1999, 22,289 in 2006, and 21,502 in 2013). In 2013, the average hospitalization rate for low-income counties was 853 per 100,000 person-years, which is lower than the average hospitalization rates for high-income counties in 1999 (1,123 per 100,000 person years). The rate of decline in hospitalizations was consistent across all county-income groups (Figure 3, top panel). There was an interaction between time and the average income group but no interaction between time and the low-income group, indicating that the slope of decline in the low income group was similar to the slope of decline in the high-income county group. Low- and average-income counties lagged behind high-income counties. To achieve the 2013 hospitalization rate of the high-income counties, assuming a continuing trend, low-income counties would require an additional 4.3 years (95% CI 3.1 to 5.9) and average-income counties would require an additional 1.9 years (95% CI 1.6 to 2.3). One-year risk-standardized AMI mortality decreased for counties of all levels of income, with small differences between counties. The one-year mortality rates for counties of low-, average-, and high-income county groups in 1999 was 31.5%, 31.4%, and 31.1%, respectively, compared with 2013, 26.2%, 26.1%, and 25.4%. The maximum difference between counties at any one time-point was 2% (Figure 3, bottom panel).
Figure 1. Geographic variation in county-level risk-standardized hospitalization rates for AMI between 1999 and 2013 (Left panel: 1999. Right panel: 2013. From top to bottom panel: Low to high income groups).

County-level hospitalization rates per 100,000 person years are color-coded based on quintiles of observed risk-standardized hospitalization rates for AMI in 1999. Counties in the lowest quintile are in green; counties in the highest quintile are in red.
Figure 3.

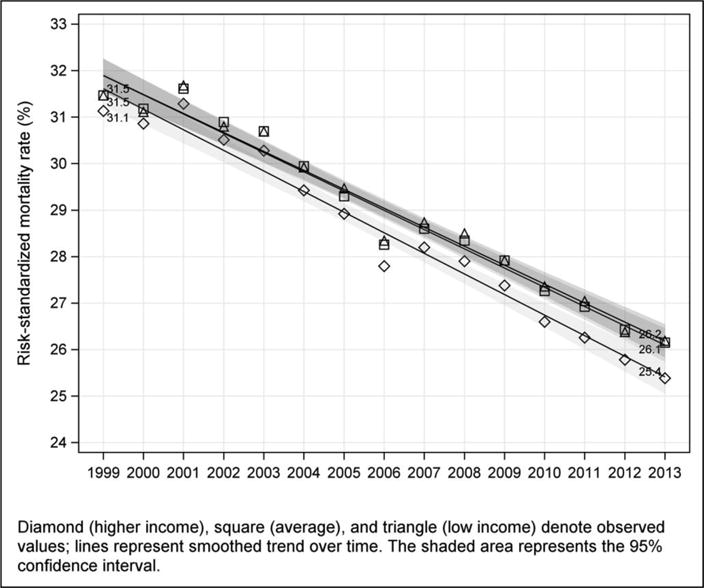
Trends in county-level risk-standardized hospitalization rates (top panel) and 1-year mortality rates (bottom panel) for AMI by income group.
Geographic Variation
The average (SD) CPI-adjusted median income in 2013 differed by region: Northeast $45,580 (14,011); West $49,064 (12,193); Midwest $49,114 (10,632); and South $43,949 (10,122). The densest proportion of low-income counties was in the South. AMI hospitalization rates for each income-county group were similar across regions. Additionally, trends in decline in risk-standardized AMI hospitalizations and mortality rates were similar across the four geographic regions (Figure 4).
Figure 4.


Comparison in trends in county-level risk-standardized hospitalization rates (top panel) and 1-year mortality rates (bottom panel) for AMI by income group among 4 U.S. regions.
DISCUSSION
In this national study assessing trends in AMI hospitalization rates and outcomes by county-level income, we found significant declines among low-, average- and high-income communities in all regions of the country. The rate of decline was similar across low-, average-, and high-income county groups; however, low-income counties had persistently higher AMI hospitalizations, though not mortality, compared with high-income counties. For example, AMI hospitalization rates in low-income counties in 2013 were similar to AMI hospitalization rates for high-income counties in 2008. This estimated 4-year ‘lag time’ was observed across the entire study period, suggesting that efforts to reduce AMI burden have reached diverse income areas throughout the U.S., though disparities persist.
Previous work, conducted at the individual-level, demonstrates significant nationwide declines in AMI hospitalization and mortality rates that were consistent across demographic groups of age, sex and race.23 We expand upon this work, showing that trends in AMI were similar across communities of different income levels. This is important, as differences in the physical, social and built environment can impact cardiovascular outcomes of a population, leading to health disparities.38–40 Areas with poor access to healthy foods, recreational activities, and healthcare are limited in their capacity to promote healthy lifestyle behaviors and primary and secondary prevention.26 Also in these areas, exposure to stress, unemployment and inadequate social support, may attenuate the effects of efforts to improve cardiovascular health.41–43
Yet over the last 2 decades, there have been several broad cardiovascular health initiatives aimed to improve outcomes among all communities. These include nation-wide quality improvement campaigns for better cardiovascular risk factor screening, prevention and control,16,44,45 smoking bans,46 and process and outcome measures assessing adherence to guideline-based risk factor modification47–49 and cardiovascular events and mortality,30,48,50,51 respectively. The Agency for Healthcare Research and Quality developed prevention quality indicators, intended for use by communities as a ‘screening tool’ to assess quality of care outside of the hospital.52 The emphasis on measurement and transparency of outcomes, and the use of evidence-based practices, may have impacted communities of different economic status. Additionally, secular (i.e. not specific to AMI prevention) trends in the health system may also have contributed to declines, such as greater integration, coordination, and access to care during this period. Thus, a national assessment of AMI trends across communities of different income is important for understanding whether these efforts had similar reach.
Our study focused on income level as a means of assessing health disparities across diverse communities. Low-income communities tend be chronically under-resourced, as demonstrated by the stagnant income levels we observed among most counties across the U.S.53,54 Median income can serve as a proxy for other socioeconomic indicators (e.g., poverty; education levels; employment), which have previously been associated with health outcomes. In our study, we found highly significant correlations between county-level median income, poverty rates, and eligibility for Medicaid. Additionally, income level can be associated with other community level factors (e.g., health behaviors, healthcare access and quality, and the physical environment) that also can contribute to higher AMI event rates.1,33
The higher hospitalization rates among low-income communities, along with the lagged decline in hospitalization rates compared with high-income counties have several explanations. High-income counties may have greater capacity to quickly adopt new models of care delivery, join campaigns to reduce AMI, and implement evidence-based primary and secondary treatment recommendations.36 Additionally, high-income communities may have greater resources to invest in the physical and social health environment.55–57 Conversely, low-income communities may face unique challenges (e.g. closures of health centers during economic depression) or disorganized health services that may attenuate the success of new primary and secondary prevention efforts to reduce AMI.58,59 Interestingly, AMI hospitalizations and mortality declined at a similar pace across low- and high-income communities, suggesting that a single factor or intervention was not responsible for the decline. If so, one might have expected admission rates in low-income counties to drop more rapidly since they started with higher rates. In our study, we found that income had a greater effect on AMI hospitalizations in low-income counties in later years compared with earlier years, suggesting that AMI rates among low-income counties may be particularly vulnerable to economic trends, mitigating efforts to eliminate disparities.
The lack of association of county-income with AMI mortality is compelling. We hypothesized that the community factors contributing to AMI incidence would also impact AMI recovery. Prior studies of coronary heart disease mortality from 1990 to 1999 showed two-three fold differences by state and county, respectively.1,25,60 One explanation for the difference in findings is that having an AMI, today, activates a robust medical system that may be comparably responsive in different socioeconomic settings. Another explanation is that county-level income becomes less important following a major, life-threatening event. Future studies should examine whether other recovery outcomes, such as recurrent AMI, rehospitalization, patient-reported symptoms and health status, and long-term life expectancy following AMI are associated with county-level income.
Interestingly, while more low-income counties cluster in the South, we did not find a difference in the rate of decline between regions. Aggregating counties into 4 regions may have obscured differences, highlighting the importance of analyses of smaller population units.61
Our study has some limitations. Median county household income is only one marker for socioeconomic status, and an index of other variables (e.g. education, employment, household crowding) may provide a more holistic indicator of socioeconomic status.62 In prior studies, median income, when combined with other socioeconomic variables, was the principal component explaining the greatest variance.62,63 Moreover, median income is strongly associated with health outcomes, and small differences in income have been associated with large changes in health status, especially among poor communities.64,24 Second, this study describes AMI risk-standardized hospital rates among Medicare Fee-For-Service beneficiaries, who may not be representative of the entire population. Younger, uninsured/underinsured populations with AMI may be more impacted by county-level income; thus, we suspect that focusing on the Medicare population would have biased our results to the null. Third, within each county, there exists heterogeneity in annual household income. However, we chose to study counties rather than a smaller geographic area such as a 5-digit zip code or U.S. census tracts or blocks because the former is more relevant to policy action steps. County-level data on the contextual environment39 can help drive leaders in government, healthcare, business and community organizations to consider community efforts to improve cardiovascular health. Finally, this study focuses on one condition. Further studies are needed to determine whether trends by county-level income are consistent for other conditions.
In 1999, the National Conference on Cardiovascular Disease Prevention, convened by the US Congress, was charged to “enhance efforts to remove differences in risk behaviors, preventive care, and morbidity and mortality in the disadvantaged.”1 The findings of this study indicate that the cardiovascular health of people residing in high-, average- and low-income communities has improved since then. However, disparities continue to persist. While significant improvements have been achieved, low-income communities continue to lag behind. Future policies, programs and nationwide campaigns should consider more focused efforts in low-income communities, potentially targeting health factors in the community that may contribute to the differences in outcomes.
CONCLUSIONS
In this national study of disparities and trends in AMI between 2000 and 2013, we observed similar rates in decline in AMI hospitalizations and 1-year mortality between communities of different income levels. However, low-income counties had persistently higher hospitalizations, though not mortality, than high-income counties in all years of the study – with an estimated 4-year lag time for low-income counties. The declines in AMI hospitalizations and mortality across socioeconomic groups is commendable, though disparities persist in AMI event rates, a topic for future research and action.
Supplementary Material
References
- 1.Cooper R, Cutler J, Desvigne-Nickens P, et al. Trends and Disparities in Coronary Heart Disease, Stroke, and Other Cardiovascular Diseases in the United States Findings of the National Conference on Cardiovascular Disease Prevention. Circulation. 2000;102(25):3137–47. doi: 10.1161/01.cir.102.25.3137. [DOI] [PubMed] [Google Scholar]
- 2.Diez Roux AV, Merkin SS, Arnett D, et al. Neighborhood of residence and incidence of coronary heart disease. N Engl J Med. 2001;345(2):99–106. doi: 10.1056/NEJM200107123450205. [DOI] [PubMed] [Google Scholar]
- 3.Lindenauer PK, Lagu T, Rothberg MB, et al. Income inequality and 30 day outcomes after acute myocardial infarction, heart failure, and pneumonia: retrospective cohort study. BMJ. 2013 Feb 14;346(3):f521–f521. doi: 10.1136/bmj.f521. [DOI] [PMC free article] [PubMed] [Google Scholar]
- 4.Alter DA, Chong A, Austin PC, et al. Socioeconomic Status and Mortality after Acute Myocardial Infarction. Ann Intern Med. 2006;144(2):82–93. doi: 10.7326/0003-4819-144-2-200601170-00005. [DOI] [PubMed] [Google Scholar]
- 5.Bikdeli B, Wayda B, Bao H, et al. Place of Residence and Outcomes of Patients With Heart Failure Analysis From the Telemonitoring to Improve Heart Failure Outcomes Trial. Circ Cardiovasc Qual Outcomes. 2014 doi: 10.1161/CIRCOUTCOMES.113.000911. CIRCOUTCOMES.113.000911. [DOI] [PMC free article] [PubMed] [Google Scholar]
- 6.Kitagawa E, Hauser P. Differential Mortality in the United States: A Study in Socioeconomic Epidemiology. Cambridge, MA: Harvard University Press; 1973. [Google Scholar]
- 7.Kulkarni VT, Ross JS, Wang Y, et al. Regional density of cardiologists and rates of mortality for acute myocardial infarction and heart failure. Circ Cardiovasc Qual Outcomes. 2013;6(3):352–9. doi: 10.1161/CIRCOUTCOMES.113.000214. [DOI] [PMC free article] [PubMed] [Google Scholar]
- 8.Cooper RA. States With More Physicians Have Better-Quality Health Care. Health Aff (Millwood) 2009;28(1):w91–102. doi: 10.1377/hlthaff.28.1.w91. [DOI] [PubMed] [Google Scholar]
- 9.Aneja S, Ross JS, Wang Y, et al. US Cardiologist Workforce From 1995 To 2007: Modest Growth, Lasting Geographic Maldistribution Especially In Rural Areas. Health Aff (Millwood) 2011;30(12):2301–9. doi: 10.1377/hlthaff.2011.0255. [DOI] [PMC free article] [PubMed] [Google Scholar]
- 10.Smith GD, Hart C, Watt G, Hole D, Hawthorne V. Individual social class, area-based deprivation, cardiovascular disease risk factors, and mortality: the Renfrew and Paisley Study. J Epidemiol Community Health. 1998;52(6):399–405. doi: 10.1136/jech.52.6.399. [DOI] [PMC free article] [PubMed] [Google Scholar]
- 11.Waitzman NJ, Smith KR. Phantom of the area: poverty-area residence and mortality in the United States. Am J Public Health. 1998;88(6):973–6. doi: 10.2105/ajph.88.6.973. [DOI] [PMC free article] [PubMed] [Google Scholar]
- 12.Kleinschmidt I, Hills M, Elliott P. Smoking behaviour can be predicted by neighbourhood deprivation measures. J Epidemiol Community Health. 1995;49(Suppl 2):S72–7. doi: 10.1136/jech.49.suppl_2.s72. [DOI] [PMC free article] [PubMed] [Google Scholar]
- 13.Social Determinants of Health: The Solid Facts. Second. Denmark: World Health Organization; 2003. [Google Scholar]
- 14.Jencks SF, Cuerdon T, Burwen DR, et al. Quality of medical care delivered to Medicare beneficiaries: A profile at state and national levels. JAMA. 2000;284(13):1670–6. doi: 10.1001/jama.284.13.1670. [DOI] [PubMed] [Google Scholar]
- 15.Ferrer RL, Cruz I, Burge S, Bayles B, Castilla MI. Measuring Capability for Healthy Diet and Physical Activity. Ann Fam Med. 2014;12(1):46–56. doi: 10.1370/afm.1580. [DOI] [PMC free article] [PubMed] [Google Scholar]
- 16.Peterson ED, Roe MT, Rumsfeld JS, et al. A call to ACTION (acute coronary treatment and intervention outcomes network): a national effort to promote timely clinical feedback and support continuous quality improvement for acute myocardial infarction. Circ Cardiovasc Qual Outcomes. 2009;2(5):491–9. doi: 10.1161/CIRCOUTCOMES.108.847145. [DOI] [PubMed] [Google Scholar]
- 17.Havranek EP, Mujahid MS, Barr DA, et al. Social Determinants of Risk and Outcomes for Cardiovascular Disease: A Scientific Statement From the American Heart Association. Circulation. 2015;132(9):873–98. doi: 10.1161/CIR.0000000000000228. [DOI] [PubMed] [Google Scholar]
- 18.McCarthy M. Tackling social factors is key in reducing cardiovascular disease, say US heart doctors. BMJ [Internet] 2015;351 doi: 10.1136/bmj.h4333. Available from: http://www.bmj.com/bmj/351/bmj.h4333.full.pdf. [DOI] [PubMed] [Google Scholar]
- 19.Pearson TA, Bazzarre TL, Daniels SR, et al. American Heart Association guide for improving cardiovascular health at the community level: a statement for public health practitioners, healthcare providers, and health policy makers from the American Heart Association Expert Panel on Population and Prevention Science. Circulation. 2003;107(4):645–51. doi: 10.1161/01.cir.0000054482.38437.13. [DOI] [PubMed] [Google Scholar]
- 20.U.S. Department of Health and Human Services. Healthy People 2010: The Cornerstone for Prevention [Internet] Available from: http://www.cdc.gov/nchs/data/hpdata2010/hp2010_final_review.pdf.
- 21.Lloyd-Jones DM, Hong Y, Labarthe D, et al. Defining and Setting National Goals for Cardiovascular Health Promotion and Disease Reduction The American Heart Association’s Strategic Impact Goal Through 2020 and Beyond. Circulation. 2010;121(4):586–613. doi: 10.1161/CIRCULATIONAHA.109.192703. [DOI] [PubMed] [Google Scholar]
- 22.Centers for Disease Control and Prevention (CDC) Million hearts: strategies to reduce the prevalence of leading cardiovascular disease risk factors–United States, 2011. MMWR Morb Mortal Wkly Rep. 2011;60(36):1248–51. [PubMed] [Google Scholar]
- 23.Krumholz HM, Normand S-LT, Wang Y. Trends in Hospitalizations and Outcomes for Acute Cardiovascular Disease and Stroke: 1999–2011. Circulation. 2014 doi: 10.1161/CIRCULATIONAHA.113.007787. CIRCULATIONAHA.113.007787. [DOI] [PMC free article] [PubMed] [Google Scholar]
- 24.Krieger N, Williams DR, Moss NE. Measuring social class in US public health research: concepts, methodologies, and guidelines. Annu Rev Public Health. 1997;18:341–78. doi: 10.1146/annurev.publhealth.18.1.341. [DOI] [PubMed] [Google Scholar]
- 25.Haan M, Kaplan GA, Camacho T. Poverty and health. Prospective evidence from the Alameda County Study. Am J Epidemiol. 1987;125(6):989–98. doi: 10.1093/oxfordjournals.aje.a114637. [DOI] [PubMed] [Google Scholar]
- 26.Kaplan G. Socioeconomic considerations in the health of urban areas. J Urban Health. 1998;75(2):228–35. doi: 10.1007/BF02345090. [DOI] [PMC free article] [PubMed] [Google Scholar]
- 27.White Paper on Income and Health [Internet] 2014 Available from: http://www.health.state.mn.us/divs/opa/2014incomeandhealth.pdf.
- 28.Flippen A. Where Are the Hardest Places to Live in the U.S.? [Internet] NY Times. 2014 [cited 2015 Nov 27]; Available from: http://www.nytimes.com/2014/06/26/upshot/where-are-the-hardest-places-to-live-in-the-us.html.
- 29.Pickle LW, Gillum RF. Geographic variation in cardiovascular disease mortality in US blacks and whites. J Natl Med Assoc. 1999;91(10):545–56. [PMC free article] [PubMed] [Google Scholar]
- 30.Krumholz HM, Wang Y, Mattera JA, et al. An Administrative Claims Model Suitable for Profiling Hospital Performance Based on 30-Day Mortality Rates Among Patients With an Acute Myocardial Infarction. Circulation. 2006;113(13):1683–92. doi: 10.1161/CIRCULATIONAHA.105.611186. [DOI] [PubMed] [Google Scholar]
- 31.Bucholz EM, Ma S, Normand SL, Krumholz HM. Race, Socioeconomic Status, and Life Expectancy After Acute Myocardial Infarction. Circulation. 2015;132(14):1338–46. doi: 10.1161/CIRCULATIONAHA.115.017009. [DOI] [PMC free article] [PubMed] [Google Scholar]
- 32.Koopman C, van Oeffelen AA, Bots ML, et al. Neighbourhood socioeconomic inequalities in incidence of acute myocardial infarction: a cohort study quantifying age- and gender-specific differences in relative and absolute terms. BMC Public Health. 2012;12:617. doi: 10.1186/1471-2458-12-617. [DOI] [PMC free article] [PubMed] [Google Scholar]
- 33.Rodriguez F, Wang Y, Naderi S, Johnson CE, Foody JM. Community-level cardiovascular risk factors impact geographic variation in cardiovascular disease hospitalizations for women. J Community Health. 2013;38(3):451–7. doi: 10.1007/s10900-012-9640-2. [DOI] [PubMed] [Google Scholar]
- 34.Yen IH, Kaplan GA. Poverty area residence and changes in physical activity level: evidence from the Alameda County Study. Am J Public Health. 1998;88(11):1709–12. doi: 10.2105/ajph.88.11.1709. [DOI] [PMC free article] [PubMed] [Google Scholar]
- 35.Anderson RT, Sorlie P, Backlund E, Johnson N, Kaplan GA. Mortality effects of community socioeconomic status. Epidemiology. 1997;8(1):42–7. doi: 10.1097/00001648-199701000-00007. [DOI] [PubMed] [Google Scholar]
- 36.Gebreab SY, Davis SK, Symanzik J, Mensah GA, Gibbons GH, Diez-Roux AV. Geographic variations in cardiovascular health in the United States: contributions of state- and individual-level factors. J Am Heart Assoc. 2015;4(6):e001673. doi: 10.1161/JAHA.114.001673. [DOI] [PMC free article] [PubMed] [Google Scholar]
- 37.CPI Inflation Calculator [Internet] 2014 [cited 2015 Oct 22];Available from: http://www.bls.gov/data/inflation_calculator.htm.
- 38.Kindig DA, Asada Y, Booske B. A population health framework for setting national and state health goals. JAMA. 2008;299(17):2081–3. doi: 10.1001/jama.299.17.2081. [DOI] [PubMed] [Google Scholar]
- 39.Robert Wood Johnson Foundation. Robert Wood Johnson Foundation County Health Rankings. http://www.countyhealthrankings.org.
- 40.DiezRoux AV, Nieto FJ, Muntaner C, et al. Neighborhood environments and coronary heart disease: A multilevel analysis. Am J Epidemiol. 1997;146(1):48–63. doi: 10.1093/oxfordjournals.aje.a009191. [DOI] [PubMed] [Google Scholar]
- 41.Bucholz EM, Rathore SS, Gosch K, et al. Effect of living alone on patient outcomes after hospitalization for acute myocardial infarction. Am J Cardiol. 2011;108(7):943–8. doi: 10.1016/j.amjcard.2011.05.023. [DOI] [PMC free article] [PubMed] [Google Scholar]
- 42.Dupre ME, George LK, Liu G, Peterson ED. The cumulative effect of unemployment on risks for acute myocardial infarction. Arch Intern Med. 2012;172(22):1731–7. doi: 10.1001/2013.jamainternmed.447. [DOI] [PubMed] [Google Scholar]
- 43.Laszlo KD, Ahnve S, Hallqvist J, Ahlbom A, Janszky I. Job strain predicts recurrent events after a first acute myocardial infarction: the Stockholm Heart Epidemiology Program. J Intern Med. 2010;267(6):599–611. doi: 10.1111/j.1365-2796.2009.02196.x. [DOI] [PubMed] [Google Scholar]
- 44.Marciniak TA, Ellerbeck EF, Radford MJ, et al. Improving the quality of care for Medicare patients with acute myocardial infarction: results from the Cooperative Cardiovascular Project. JAMA. 1998;279(17):1351–7. doi: 10.1001/jama.279.17.1351. [DOI] [PubMed] [Google Scholar]
- 45.Krumholz HM, Bradley EH, Nallamothu BK, et al. A campaign to improve the timeliness of primary percutaneous coronary intervention: Door-to-Balloon: An Alliance for Quality. JACC Cardiovasc Interv. 2008;1(1):97–104. doi: 10.1016/j.jcin.2007.10.006. [DOI] [PubMed] [Google Scholar]
- 46.Dube SR, Asman K, Malarcher A, Carabollo R. Cigarette smoking among adults and trends in smoking cessation-United States, 2008. Morb Mortal Wkly Rep. 2009;58(44):1227–32. [PubMed] [Google Scholar]
- 47.Mann D, Reynolds K, Smith D, Muntner P. Trends in statin use and low-density lipoprotein cholesterol levels among US adults: impact of the 2001 National Cholesterol Education Program guidelines. Ann Pharmacother. 2008;42(9):1208–15. doi: 10.1345/aph.1L181. [DOI] [PubMed] [Google Scholar]
- 48.Dharmarajan K, Krumholz HM. Strategies to Reduce 30-Day Readmissions in Older Patients Hospitalized with Heart Failure and Acute Myocardial Infarction. Curr Geriatr Rep. 2014;3(4):306–15. doi: 10.1007/s13670-014-0103-8. [DOI] [PMC free article] [PubMed] [Google Scholar]
- 49.Krumholz HM, Anderson JL, Brooks NH, et al. ACC/AHA clinical performance measures for adults with ST-elevation and non-ST-elevation myocardial infarction: a report of the American College of Cardiology/American Heart Association Task Force on Performance Measures (Writing Committee to Develop Performance Measures on ST-Elevation and Non-ST-Elevation Myocardial Infarction) J Am Coll Cardiol. 2006;47(1):236–65. doi: 10.1016/j.jacc.2005.10.020. [DOI] [PubMed] [Google Scholar]
- 50.Curtis JP, Schreiner G, Wang Y, et al. All-cause readmission and repeat revascularization after percutaneous coronary intervention in a cohort of medicare patients. J Am Coll Cardiol. 2009;54(10):903–7. doi: 10.1016/j.jacc.2009.04.076. [DOI] [PubMed] [Google Scholar]
- 51.Suter LG, Li SX, Grady JN, et al. National patterns of risk-standardized mortality and readmission after hospitalization for acute myocardial infarction, heart failure, and pneumonia: update on publicly reported outcomes measures based on the 2013 release. J Gen Intern Med. 2014;29(10):1333–40. doi: 10.1007/s11606-014-2862-5. [DOI] [PMC free article] [PubMed] [Google Scholar]
- 52.Prevention Quality Indicators Overview [Internet] Agency Healthc Res Qual. Available from: http://www.qualityindicators.ahrq.gov/modules/pqi_resources.aspx.
- 53.Mensah GA. Eliminating Disparities in Cardiovascular Health Six Strategic Imperatives and a Framework for Action. Circulation. 2005;111(10):1332–6. doi: 10.1161/01.CIR.0000158134.24860.91. [DOI] [PubMed] [Google Scholar]
- 54.Cheng E, Kindig D. Disparities in Premature Mortality Between High- and Low-Income US Counties. Prev Chronic Dis [Internet] 2012 [cited 2015 Oct 22];Available from: http://www.cdc.gov/pcd/issues/2012/11_0120.htm. [PMC free article] [PubMed]
- 55.Unger E, Diez-Roux AV, Lloyd-Jones DM, et al. Association of Neighborhood Characteristics With Cardiovascular Health in the Multi-Ethnic Study of Atherosclerosis. Circ Cardiovasc Qual Outcomes. 2014;7(4):524–31. doi: 10.1161/CIRCOUTCOMES.113.000698. [DOI] [PMC free article] [PubMed] [Google Scholar]
- 56.Auchincloss AH, Mujahid MS, Shen M, Michos ED, Whitt-Glover MC, Diez Roux AV. Neighborhood health-promoting resources and obesity risk (the multi-ethnic study of atherosclerosis) Obes Silver Spring. 2013;21(3):621–8. doi: 10.1038/oby.2012.91. [DOI] [PMC free article] [PubMed] [Google Scholar]
- 57.Christine PJ, Auchincloss AH, Bertoni AG, et al. Longitudinal Associations Between Neighborhood Physical and Social Environments and Incident Type 2 Diabetes Mellitus: The Multi-Ethnic Study of Atherosclerosis (MESA) JAMA Intern Med. 2015;175(8):1311–20. doi: 10.1001/jamainternmed.2015.2691. [DOI] [PMC free article] [PubMed] [Google Scholar]
- 58.Sussman JB, Halasyamani LK, Davis MM. Hospitals during recession and recovery: vulnerable institutions and quality at risk. J Hosp Med. 2010;5(5):302–5. doi: 10.1002/jhm.654. [DOI] [PubMed] [Google Scholar]
- 59.Kaufman BG, Thomas SR, Randolph RK, et al. The Rising Rate of Rural Hospital Closures. J Rural Health. 2015 doi: 10.1111/jrh.12128. [DOI] [PubMed] [Google Scholar]
- 60.Casper M, Barnett E, Halverson JA. Women and heart disease: an atlas of racial and ethnic disparities in mortality. Morgantown, West Virginia: West Virginia Univesity, Office for Social Environment and Health Research; 1999. [Google Scholar]
- 61.Cooper RA, Cooper MA, McGinley EL, Fan X, Rosenthal JT. Poverty, Wealth, and Health Care Utilization: A Geographic Assessment. J Urban Health Bull N Y Acad Med. 2012;89(5):828–47. doi: 10.1007/s11524-012-9689-3. [DOI] [PMC free article] [PubMed] [Google Scholar]
- 62.Bonito A, Bann C, Eicheldinger C, Carpenter L. Creation of New Race-Ethnicity Codes and Socioeconomic Status (SES) Indicators for Medicare Beneficiaries [Internet] 2008 Available from: http://archive.ahrq.gov/research/findings/final-reports/medicareindicators/medicareindicators.pdf.
- 63.Blum AB, Egorova NN, Sosunov EA, et al. Impact of socioeconomic status measures on hospital profiling in New York City. Circ Cardiovasc Qual Outcomes. 2014;7(3):391–7. doi: 10.1161/CIRCOUTCOMES.113.000520. [DOI] [PMC free article] [PubMed] [Google Scholar]
- 64.Muennig P. Health selection vs. causation in the income gradient: what can we learn from graphical trends? J Health Care Poor Underserved. 2008;19(2):574–9. doi: 10.1353/hpu.0.0018. [DOI] [PubMed] [Google Scholar]
Associated Data
This section collects any data citations, data availability statements, or supplementary materials included in this article.