

Abstract
Importance
In a period of dynamic change in health care technology, delivery and behaviors, tracking trends in health and health care can provide a perspective on what is being achieved.
Objective
To comprehensively describe national trends in mortality, hospitalizations, and expenditures in the Medicare Fee-For-Service population between 1999 and 2013.
Design, Setting, and Participants
Serial cross-sectional analysis of Medicare beneficiaries aged ≥65 years between 1999 and 2013 using Medicare denominator and inpatient files.
Main Outcomes and Measures
For all Medicare beneficiaries, trends in all-cause mortality; for Fee-for-Service beneficiaries, trends in all-cause hospitalization and hospitalization-associated outcomes and expenditures. Also, geographic variation, stratified by key demographic groups, and changes in the intensity of care for Fee-For-Service beneficiaries in the last 1, 3, and 6 months of life.
Results
The sample consisted of 68,374,904 unique Medicare beneficiaries (Fee-For Service and Medicare Advantage). All-cause mortality for all Medicare beneficiaries declined from 5.30% in 1999 to 4.45% in 2013 (difference, 0.85 percentage points; 95% confidence interval [CI], 0.83 to 0.87). Among Fee-for-Service beneficiaries (n=60,056,069), the total number of hospitalizations per 100,000 person-years decreased from 35,274 to 26,930 (difference, 8,344; 95% CI, 8,315 to 8,374). Mean inflation-adjusted inpatient expenditures per Medicare Fee-for-Service beneficiary declined from $3,290 to $2,801 (difference, $489; 95% CI, 487 to 490). Among Fee-for-Service beneficiaries in the last 6 months of life, the number of hospitalizations decreased from 131.1 to 102.9 per 100 deaths (difference 28.2; 95% CI, 27.9 to 28.4), the percentage of beneficiaries with one or more hospitalizations decreased from 70.5 to 56.8 per 100 deaths (difference 13.7; 95% CI, 13.5 to 13.8); while the inflation-adjusted inpatient expenditure per death increased from $15,312 in 1999 to $17,423 in 2009 and then decreased to $13,338 in 2013. Findings were consistent across geographic and demographic groups.
Conclusions and Relevance
Among Medicare Fee-for-Service beneficiaries aged ≥65, all-cause mortality rates, hospitalization rates, and expenditures per beneficiary decreased from 1999 to 2013. In the last 6 months of life, total hospitalizations decreased and inpatient expenditures decreased in recent years.
INTRODUCTION
In recent decades, the United States has experienced a period of dynamic change in health behaviors, health care technology, and health care delivery. Given these changes, which could provide benefit or cause unintended harm, there is a need to assess the results that are being achieved. In particular, hospitalizations are associated with considerable morbidity and expenditures. The Medicare Fee-for Service program of the Centers for Medicare & Medicaid Services (CMS), the nation’s social insurance program, is ideally positioned to provide information on trends in hospitalizations and hospitalization outcomes during this period in health care. A comprehensive analysis of national hospital trends in the Medicare Fee-for-Service population can reveal what has been achieved and the trajectories of change.
Accordingly, we assessed trends in hospitalization rates and hospitalization-associated outcomes and expenditures for beneficiaries enrolled in the Fee-for-Service plan from 1999 through 2013. In addition, we evaluated trends at the end of life. Finally, we also evaluated trends in overall mortality for all beneficiaries and for those enrolled in Fee-for-Service and Medicare Advantage, the managed care component of Medicare for which hospitalization data are unavailable, to assess selection effects.
METHODS
Study Population
The Medicare denominator files, which are produced by CMS, describe the demographic characteristics, monthly enrollment status, and mortality information for all beneficiaries. We used the denominator files to identify the overall Medicare population by limiting the analyses to beneficiaries aged ≥65 years enrolled in the Medicare program for ≥1 month from January 1999 through December 2013. For each year, the number of beneficiaries according to their choice of plan (i.e., Fee-for-Service or Medicare Advantage) were counted; to reflect the focus on the Fee-for-Service plan, any beneficiary enrolled in this plan for ≥1 month of the year was counted in the Fee-for-Service analysis for the duration of the period in which they were enrolled (which could be as little time as 1 month). Beneficiaries who were never enrolled in the Fee-for-Service plan in a given year were classified as only Medicare Advantage. Person-years of enrollment, based an aggregate of the months, to reflect new enrollment, disenrollment, and deaths occurring during the benefit year among the Fee-for-Service beneficiaries, and used this as the denominator in our analyses of hospitalizations, their related outcomes, and expenditures were calculated. The Yale University Human Investigation Committee approved the study and waived the requirement for informed consent.
All-cause Mortality
To measure all-cause mortality, we identified beneficiaries who died during the study period, regardless of cause, and determined the timing of their death. We determined the all-cause mortality rate for the entire Medicare population. We also calculated the all-cause mortality rate by dividing the total number of deaths in each year by the corresponding number of Medicare beneficiaries (Fee-for-Service and Medicare Advantage). For this analysis, individuals were considered in Fee-for-Service if they were participating in that plan for any part of the year. For beneficiaries enrolled in the Fee-for-Service plan, the all-cause mortality rates for those who were also eligible for Medicaid (“dual-eligibles”) for ≥1 month was also calculated.
Characteristics of Medicare Beneficiaries
We determined the age, sex, and race (white, black, other) of beneficiaries and counted the number eligible for Medicaid for ≥1 month (dual eligible) for the Medicare population, the number enrolled in the Fee-for-Service plan, and the number enrolled in Medicare Advantage. For Fee-for-Service beneficiaries who were hospitalized, we ascertained comorbidities from secondary diagnosis codes as well as from principal and secondary diagnosis codes from all hospitalizations for 12 months before the index hospitalization; data from 1998 were used for hospitalizations in 1999. These comorbidities were classified using the Hierarchical Condition Categories method.1,2
Hospitalizations and Outcomes
The Medicare inpatient files aggregate claims data submitted to CMS by hospitals that care for Fee-for-Service beneficiaries as inpatients. Using the 1999 through 2013 inpatient files, the all-cause hospitalization rate among Fee-for-Service beneficiaries was estimated by dividing the total number of hospitalizations for each year by the corresponding number of person-years of Fee-for-Service enrollment, based on the total months that people were in Fee-for-Service. All Fee-for-Service hospitalizations were counted. Using a similar approach, the rates of beneficiaries with ≥1 hospitalization and rates of in-hospital major surgical procedures based on the International Classification of Diseases, Ninth Revision, Clinical Modification (ICD-9-CM) codes listed in the Surgical Care Improvement Project were calculated.3 Deaths during the hospitalization, within 30 days of admission, and within 1 year of admission were also analyzed. We used the 2014 denominator file to obtain 1-year mortality information for patients discharged in 2013. All mortality rates were calculated at the patient-level. Trends in hospital length of stay and major discharge dispositions: discharge to home, homecare, intermediate care or skilled nursing facility, hospice, and transfer to another acute-care hospital were also assessed.
To measure Medicare inpatient expenditures for Fee-for-Service beneficiaries, we determined the annual Medicare inpatient reimbursements, adjusting for inflation using the Consumer Price Index (CPI) with 2013 as the index year.4 The average inpatient expenditure per Medicare beneficiary each year was calculated by dividing the CPI-adjusted Medicare inpatient expenditure by the corresponding number of person-years of Fee-for-Service enrollment.
To assess trends in the utilization of inpatient care at the end of life, we calculated the all-cause hospitalization rate per 100 deaths in the last 1, 3, and 6 months of deceased Fee-for-Service beneficiaries’ lives, using all-cause deaths in each calendar year as the denominator. Similarly, we computed CPI-adjusted Medicare inpatient expenditure per death, and length of stay in the last 1, 3, and 6 months of deceased Fee-for-Service beneficiaries’ lives.
Statistical Analysis
To assess trends in rates of mortality and hospitalization among beneficiaries enrolled in the Fee-for-Service plan, a mixed effects model with a Poisson link function and state-specific random intercepts was fitted, adjusting for age, sex, and race. Time was modeled as a continuous variable corresponding to years 1999 (time = 0) to 2013 (time = 14). The adjusted annual decline for each reported outcome is based on the incidence rate ratio of the time variable, which represents the age-sex-race-adjusted annual trends in these outcomes. We repeated each model for the various age-sex-race subgroups.
To assess geographic trends and variation in outcomes,5 the CMS model used for profiling hospital performance on outcomes1,2,6 was extended with a Poisson link function and county-specific random intercepts to model the number of deaths as a function of patients’ age, sex, and race and accounting for geographic differences between counties. Geographic differences were accounted for because several factors that are related to health outcomes, such as lifestyle, access to care, and local environments, vary across counties and may impact outcomes. Using this model, we calculated the rates of risk-standardized all-cause mortality for each county or county equivalent for years 1999 and 2013. The county-specific risk-standardized rates were then mapped, coloring counties according to their risk-standardized rates in 1999 with a gradient from green to red (the lowest rates to the highest rates). To assess the changes in death rates between 1999 and 2013, we applied the 1999 map’s color classification to the 2013 map. The model was repeated to calculate the risk-standardized hospitalization rate for years 1999 and 2013 and mapped the risk-standardized hospitalization rates for years 1999 and 2013. The analyses were conducted with SAS version 9.3, 64-bit (SAS Institute Inc., Cary, North Carolina). Statistical testing was 2-sided, at a significance level of 0.05.
RESULTS
Trends and Characteristics in Fee-for-Service Medicare and Medicare Advantage Beneficiaries
There were 68,374,904 unique beneficiaries aged ≥65 years enrolled in the Medicare program for ≥1 month from 1999 to 2013. The number increased from 35,540,41 in 1999 to 42,474,26 in 2013 (Table 1). Of these, 60,056,069 were enrolled in the Fee-for-Service plan for ≥1 month, representing 416,667,038 person-years of enrollment over the 15-year period. The proportion of beneficiaries enrolled in the Fee-for-Service plan decreased from 82.2% in 1999 to 71.0% in 2013. Over the study period, 2.1% to 3.0% of beneficiaries changed their enrollment between Fee-for-Service and Medicare Advantage plans. Beneficiaries enrolled in Fee-for-Service were 1 year older than beneficiaries enrolled in Medicare Advantage, a difference that has declined in recent years (Table 1). Between 1999 and 2013, beneficiaries dually enrolled in both Medicare and Medicaid increased from 13.0% to 13.2% for those enrolled in Fee-for-Service, and from 4.6% to 11.9% for beneficiaries enrolled in the Medicare Advantage plan (Table 1).
Table 1.
Medicare Population 1999 to 2013 – Demographic Features, Comorbidities, and Hospitalizations.
| 1999 | 2000 | 2001 | 2002 | 2003 | 2004 | 2005 | 2006 | 2007 | 2008 | 2009 | 2010 | 2011 | 2012 | 2013 | |
|---|---|---|---|---|---|---|---|---|---|---|---|---|---|---|---|
| Medicare population, age ≥65 years | |||||||||||||||
| Total number of Medicare beneficiaries (aged ≥ 65) | 33,540,416 | 33,778,395 | 33,985,556 | 34,185,146 | 34,427,443 | 34,758,077 | 35,187,050 | 35,628,663 | 36,204,221 | 37,043,742 | 37,947,575 | 38,813,636 | 39,612,090 | 40,873,237 | 42,474,269 |
| Mean age, year (standard deviation) | 75.1 (7.4) | 75.2 (7.4) | 75.2 (7.4) | 75.3 (7.5) | 75.3 (7.5) | 75.3 (7.5) | 75.3 (7.6) | 75.3 (7.6) | 75.3 (7.7) | 75.2 (7.7) | 75.1 (7.8) | 75.1 (7.8) | 75.1 (7.8) | 74.9 (7.8) | 74.7 (7.8) |
| Female sex, % | 59.1 | 58.9 | 58.7 | 58.6 | 58.4 | 58.1 | 58.0 | 57.7 | 57.5 | 57.3 | 57.0 | 56.8 | 56.6 | 56.3 | 56.1 |
| Race, % | |||||||||||||||
| White | 86.5 | 87.0 | 86.8 | 86.5 | 86.4 | 86.2 | 85.9 | 85.7 | 85.5 | 85.3 | 85.2 | 84.9 | 84.6 | 84.3 | 83.9 |
| Black | 7.8 | 7.9 | 8.0 | 8.0 | 8.1 | 8.1 | 8.2 | 8.2 | 8.3 | 8.3 | 8.4 | 8.4 | 8.5 | 8.5 | 8.5 |
| Other | 5.7 | 5.1 | 5.2 | 5.4 | 5.6 | 5.7 | 5.9 | 6.1 | 6.2 | 6.4 | 6.5 | 6.7 | 6.9 | 7.2 | 7.6 |
| Dual eligible, % | 11.5 | 11.7 | 11.8 | 12.3 | 12.5 | 12.6 | 12.9 | 13.1 | 13.0 | 12.9 | 12.7 | 12.9 | 13.1 | 13.0 | 12.8 |
| All-cause annual death, % | 5.3 | 5.3 | 5.2 | 5.2 | 5.2 | 5.0 | 5.0 | 4.9 | 4.8 | 4.8 | 4.6 | 4.6 | 4.6 | 4.5 | 4.5 |
| Medicare Fee-for-Service Population | |||||||||||||||
| Enrolled in Fee-for-Service for ≥1 month (#) | 27,552,139 | 27,745,895 | 28,591,646 | 29,284,512 | 29,689,923 | 30,000,107 | 30,187,136 | 29,788,694 | 29,001,434 | 28,763,911 | 28,669,816 | 29,011,553 | 29,162,587 | 29,541,324 | 30,148,234 |
| Proportion of total Medicare population (%) | 82.1 | 82.1 | 84.1 | 85.7 | 86.2 | 86.3 | 85.8 | 83.6 | 80.1 | 77.6 | 75.6 | 74.7 | 73.6 | 72.3 | 71.0 |
| Person-years of Fee-For Service enrollment | 26,147,690 | 26,428,721 | 27,196,165 | 27,977,751 | 28,443,557 | 28,722,464 | 28,764,927 | 28,062,803 | 27,514,260 | 27,291,534 | 27,341,658 | 27,694,716 | 27,956,099 | 28,289,986 | 28,834,706 |
| Mean age, year (standard deviation) | 75.3 (7.5) | 75.3 (7.5) | 75.3 (7.5) | 75.3 (7.5) | 75.3 (7.6) | 75.3 (7.6) | 75.3 (7.6) | 75.3 (7.7) | 75.3 (7.8) | 75.3 (7.8) | 75.2 (7.9) | 75.2 (7.9) | 75.1 (7.9) | 75 (8) | 74.8 (8) |
| Female sex, % | 59.4 | 59.1 | 58.8 | 58.5 | 58.3 | 58.0 | 57.9 | 57.6 | 57.4 | 57.1 | 56.8 | 56.6 | 56.3 | 56.0 | 55.7 |
| Race, % | |||||||||||||||
| White | 86.7 | 87.1 | 87.0 | 86.8 | 86.6 | 86.4 | 86.2 | 86.2 | 86.1 | 86.0 | 85.8 | 85.5 | 85.2 | 84.9 | 84.6 |
| Black | 7.8 | 8.0 | 8.0 | 8.0 | 8.1 | 8.1 | 8.1 | 8.1 | 8.0 | 7.9 | 7.9 | 8.1 | 8.1 | 8.1 | 8.1 |
| Other | 5.4 | 4.9 | 5.0 | 5.2 | 5.3 | 5.4 | 5.7 | 5.7 | 5.9 | 6.1 | 6.3 | 6.5 | 6.7 | 7.0 | 7.3 |
| Dual eligible, % | 13.0 | 13.1 | 13.1 | 13.3 | 13.4 | 13.5 | 13.7 | 13.5 | 13.6 | 13.5 | 13.4 | 13.6 | 13.7 | 13.6 | 13.2 |
| At least 1 month enrollment in Medicare Advantage, % | 2.5 | 2.2 | 2.4 | 1.9 | 1.5 | 1.8 | 3.0 | 4.4 | 3.3 | 3.3 | 2.7 | 2.5 | 2.0 | 2.1 | 2.5 |
| All-cause annual death, % | 5.5 | 5.5 | 5.4 | 5.4 | 5.3 | 5.1 | 5.1 | 5.0 | 5.0 | 5.0 | 4.8 | 4.8 | 4.8 | 4.7 | 4.7 |
| Comorbidities (per 100,000 person-years) for Medicare Fee-for-Service beneficiaries | |||||||||||||||
| History of heart failure | 2,552 | 2,592 | 2,596 | 2,582 | 2,602 | 2,642 | 2,638 | 2,556 | 2,503 | 2,357 | 2,274 | 2,239 | 2,237 | 2,141 | 2,048 |
| History of myocardial infarction | 489 | 504 | 524 | 519 | 520 | 504 | 480 | 459 | 447 | 449 | 433 | 417 | 411 | 393 | 378 |
| Hypertension | 10,543 | 11,106 | 11,681 | 12,060 | 12,356 | 12,666 | 12,786 | 12,504 | 13,054 | 13,177 | 12,864 | 12,726 | 12,849 | 12,505 | 11,623 |
| Diabetes | 4,733 | 4,879 | 5,032 | 5,142 | 5,242 | 5,336 | 5,445 | 5,362 | 5,356 | 5,334 | 5,278 | 5,249 | 5,337 | 5,207 | 4,972 |
| Chronic atherosclerosis | 6,694 | 6,826 | 6,972 | 7,027 | 7,042 | 7,053 | 7,003 | 6,790 | 6,618 | 6,504 | 6,195 | 5,958 | 5,937 | 5,635 | 5,140 |
| Stroke | 453 | 445 | 435 | 421 | 402 | 384 | 373 | 363 | 350 | 345 | 334 | 330 | 326 | 311 | 298 |
| Chronic obstructive pulmonary disease | 4,466 | 4,452 | 4,503 | 4,578 | 4,627 | 4,662 | 4,746 | 4,641 | 4,515 | 3,995 | 3,777 | 3,703 | 3,744 | 3,580 | 3,414 |
| Asthma | 477 | 512 | 539 | 570 | 597 | 625 | 666 | 667 | 643 | 648 | 636 | 622 | 644 | 637 | 615 |
| Pneumonia | 1,937 | 1,985 | 1,942 | 2,028 | 2,048 | 2,113 | 2,176 | 2,155 | 2,192 | 2,425 | 2,369 | 2,346 | 2,373 | 2,277 | 2,277 |
| Trauma, past year | 1,727 | 1,767 | 1,864 | 1,951 | 1,995 | 2,020 | 2,036 | 2,009 | 1,916 | 1,918 | 1,658 | 1,621 | 1,708 | 1,533 | 1,410 |
| Chronic liver disease | 230 | 233 | 236 | 244 | 249 | 253 | 252 | 250 | 252 | 239 | 240 | 250 | 266 | 273 | 279 |
| Cancer | 2,502 | 2,482 | 2,492 | 2,478 | 2,434 | 2,397 | 2,364 | 2,312 | 2,289 | 2,263 | 2,185 | 2,117 | 2,099 | 2,018 | 1,927 |
| Hospitalization (per 100,000 person-years) for Medicare Fee-for-Service beneficiaries | |||||||||||||||
| Number of hospitalizations | 35,274 | 35,412 | 35,682 | 35,328 | 35,060 | 34,655 | 34,368 | 33,538 | 33,050 | 32,603 | 31,169 | 30,677 | 29,941 | 29,460 | 26,930 |
| 1 or more hospitalizations | 21,782 | 21,760 | 21,829 | 21,660 | 21,464 | 21,272 | 21,167 | 20,703 | 20,387 | 20,087 | 19,495 | 19,227 | 18,811 | 18,248 | 17,344 |
| Hospitalizations for major surgical care | 3,784 | 3,751 | 3,780 | 3,746 | 3,711 | 3,749 | 3,699 | 3,614 | 3,572 | 3,515 | 3,420 | 3,363 | 3,229 | 3,102 | 3,105 |
| Mortality (per 100 beneficiaries) among hospitalized patients for Medicare Fee-for-Service beneficiaries | |||||||||||||||
| In-hospital mortality (%) | 1.30 | 1.26 | 1.22 | 1.20 | 1.13 | 1.06 | 1.02 | 0.95 | 0.91 | 0.91 | 0.84 | 0.80 | 0.78 | 0.72 | 0.71 |
| 30-day all-cause mortality (%) | 2.16 | 2.11 | 2.08 | 2.07 | 2.02 | 1.93 | 1.92 | 1.83 | 1.81 | 1.83 | 1.76 | 1.74 | 1.73 | 1.67 | 1.65 |
| 1-year all-cause mortality (%) | 4.49 | 4.41 | 4.41 | 4.33 | 4.25 | 4.10 | 4.05 | 3.92 | 3.93 | 3.90 | 3.76 | 3.73 | 3.68 | 3.65 | 3.48 |
| Medicare Advantage population | |||||||||||||||
| Enrolled in Medicare Advantage for all 12 months (#) | 5,988,277 | 6,032,500 | 5,393,910 | 4,900,634 | 4,737,520 | 4,757,970 | 4,999,914 | 5,839,969 | 7,202,787 | 8,279,831 | 9,277,759 | 9,802,083 | 10,449,503 | 11,331,913 | 12,326,035 |
| Proportion of total Medicare population, % | 17.9 | 17.9 | 15.9 | 14.3 | 13.8 | 13.7 | 14.2 | 16.4 | 19.9 | 22.4 | 24.4 | 25.3 | 26.4 | 27.7 | 29.0 |
| Mean age, year (standard deviation) | 74.3 (6.8) | 74.4 (6.8) | 74.7 (6.9) | 75 (6.9) | 75.3 (7) | 75.4 (7) | 75.5 (7) | 75.4 (7.1) | 75.2 (7.2) | 75.1 (7.3) | 74.9 (7.3) | 74.8 (7.3) | 74.8 (7.3) | 74.7 (7.3) | 74.6 (7.4) |
| Female sex, % | 57.7 | 57.9 | 58.3 | 58.6 | 58.7 | 58.7 | 58.6 | 58.4 | 58.1 | 58.0 | 57.7 | 57.5 | 57.4 | 57.2 | 57.2 |
| Race, % | |||||||||||||||
| White | 85.5 | 86.1 | 85.8 | 85.3 | 84.9 | 84.6 | 84.1 | 83.1 | 83.0 | 83.1 | 83.2 | 83.3 | 82.9 | 82.6 | 82.1 |
| Black | 7.8 | 7.8 | 7.8 | 7.9 | 8.0 | 8.1 | 8.5 | 9.0 | 9.4 | 9.6 | 9.6 | 9.4 | 9.5 | 9.6 | 9.6 |
| Other | 6.7 | 6.1 | 6.4 | 6.8 | 7.1 | 7.2 | 7.4 | 7.9 | 7.6 | 7.3 | 7.2 | 7.3 | 7.6 | 7.8 | 8.2 |
| Dual eligible, % | 4.6 | 4.9 | 5.2 | 6.2 | 6.9 | 7.5 | 8.3 | 10.8 | 10.8 | 10.9 | 10.8 | 10.8 | 11.2 | 11.5 | 11.9 |
Between 1999 and 2013, the average age of beneficiaries enrolled in the Fee-for-Service plan decreased slightly (75.3 years [standard deviation [SD] 7.5] vs. 74.8 years [8.0]), the proportion of female Medicare beneficiaries declined from 59.4% to 55.7%, white beneficiaries decreased from 86.7% to 84.6%, and black beneficiaries increased from 7.8% to 8.1%. Additionally, there were significant changes in the comorbidities of Fee-for-Service beneficiaries: heart failure, myocardial infarction, stroke, and cancer decreased, while asthma and diabetes increased (Table 1 and Table S1).
The annual all-cause mortality rate across the Medicare population declined from 5.30% in 1999 to 4.45% in 2013 (difference, 0.85 percentage points; 95% confidence interval [CI], 0.83 to 0.85). There were declines for both Fee-for-Service and Medicare Advantage (Figure 1). The difference between the Fee-for Service and Medicare Advantage populations did not substantially change from 2003 through 2013 (difference 0.72% in 2003; 0.76% in 2005; 0.68% in 2007; 0.78% in 2009; 0.89% in 2011; 0.80% in 2013).
Figure 1. Trends in Observed All-Cause Mortality Rates in the Medicare Population, 1999–2013.
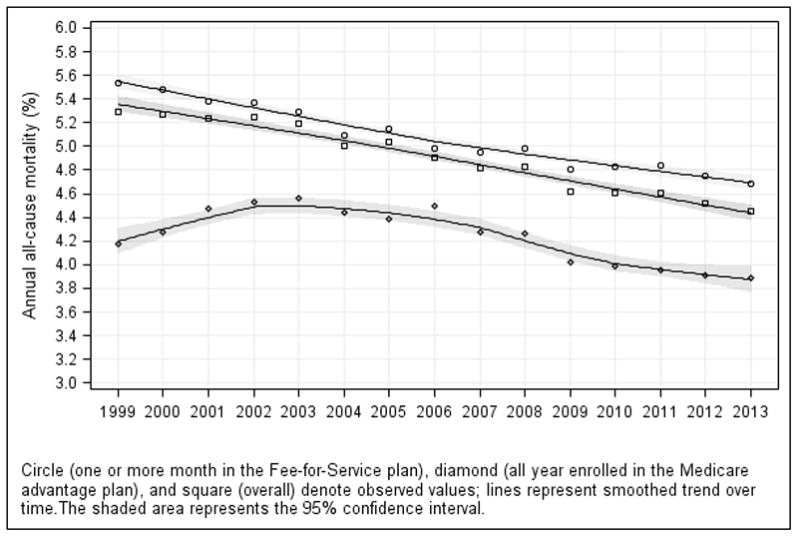
The symbols around each trend line represent the observed mortality rates for each year. All Medicare beneficiaries aged 65 years or older (square), Medicare beneficiaries aged 65 years or older who were enrolled in the Fee-for-Service plan for 1 or more month (circles), as well as Medicare beneficiaries aged 65 years or older who were enrolled in a Medicare Advantage program for the full duration for the year (diamonds) are shown. Lines were smoothed using the loess method (local regression). The numbers of Medicare beneficiaries aged 65 years or older in each year and plan are shown in Table 1.
Trends in All-Cause Fee-for-Service Mortality
Among Fee-for-Service beneficiaries, there was a decrease in mortality, which was consistent across age-sex-race subgroups, after accounting for beneficiaries’ age, sex, race, and geographical location (adjusted relative annual decline 1.32%, 95% CI, 1.29 to 1.36; Figure S1 and Table S2 in the Online Supplementary Appendix). At the county level, there were declines in risk-standardized rates between 1999 and 2013, but considerable geographic variation persisted. Figure 2 (top panels) shows the county-level changes in risk-standardized rates between 1999 and 2013 in U.S. maps and Figure S2 shows histograms of these changes.
Figure 2. Maps Showing Trends in Risk-Standardized All-Cause Deaths and Hospitalizations among Fee-for-Service Beneficiaries for Individual U.S. Counties in 1999 and 2013.
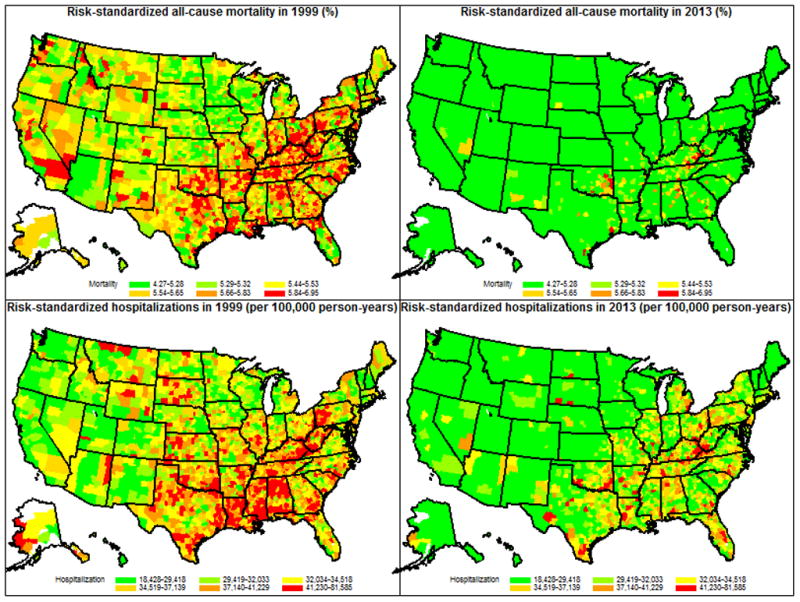
U.S. counties are shaded according to the risk-standardized all-cause mortality rates (%) (top 2 panels) and the number of risk-standardized hospitalizations (bottom 2 panels) per 100,000 person-years of enrollment in the Medicare Fee-for-Service program: counties with the lowest death and hospitalization rates in 1999 were shaded green, while those with the highest death and hospitalization rates in 1999 were shaded red. Counties are shaded white if there were missing data that precluded the calculation of death, or hospitalization rates. The same legend was used for the panels describing mortality and hospitalization rates in 2013. Both all-cause mortality and hospitalizations were for all beneficiaries enrolled for 1 or more months in Medicare Fee-for-Service. For 1999 and 2013, respectively, there were 27,552,139 and 30,148,234 unique Medicare Fee-for-Service beneficiaries aged 65 or older, representing 26,147,690 and 28,834,706 person-years of enrollment. Data from Puerto Rico were included to estimate the national rates but were not included in the maps. For Puerto Rico, the risk-standardized mortality rate decreased from 4.97% (95% CI 4.91 to 5.04) in 1999 to 3.64 (95% CI 3.55 to 3.73) in 2013; the risk-standardized hospitalization rate per 100,000 person-years decreased from 29,038 (95% CI 27,891 to 30,184) in 1999 to 17,432 (95% CI 16,775 to 18,089) in 2013.
Fee-for-Service beneficiaries who were dual-eligible had a higher mortality compared with those who were not dual-eligible (10.22% vs. 4.84%) in 1999, a difference that persisted in 2013 (8.34% vs. 4.13%). The age-sex-race adjusted odds of dying were 2.11 (95% CI, 2.11–2.12) and 2.19 (95% CI, 2.18–2.20) for beneficiaries who were dual-eligible compared with those who were not dual-eligible, for 1999 and 2013, respectively.
Trends in All-Cause Hospitalizations Among Fee-for-Service Beneficiaries
Between 1999 and 2013, the total number of hospitalizations per 100,000 person-years of enrollment in the Fee-for-Service plan decreased from 35,274 in 1999 to 26,930 in 2013 (difference, 8,344; 95% CI, 8,315 to 8,374; Table 1, Figure 3A). Correspondingly, the number of beneficiaries admitted to the hospital at least once, per 100,000 person-years, decreased from 21,782 to 17,344 (difference, 4,438; 95% CI, 4,415 to 4,462). The number of hospitalizations that involved major surgical procedures per 100,000 person-years of beneficiaries also decreased from 3,784 to 3,105 (difference, 679; 95% CI, 652 to 712). These findings did not change substantially after accounting for beneficiaries’ demographic characteristics and geographical differences: the adjusted relative annual declines were 1.57% (95% CI, 1.54 to 1.71) and 1.36% (95% CI, 1.33 to 1.39) for the number of beneficiaries who had ≥1 hospitalization and the total number of hospitalizations, respectively (Figure S3). Although declines were consistent across age-sex-race subgroups, there was considerable variation (Table S2). At the county level, there was substantial decline, varying in size across counties, in rates of risk-standardized hospitalization. Figure 2 (bottom panels) shows the county-level changes in risk-standardized rates between 1999 and 2013 in U.S. maps and Figure S4 shows histograms of these changes.
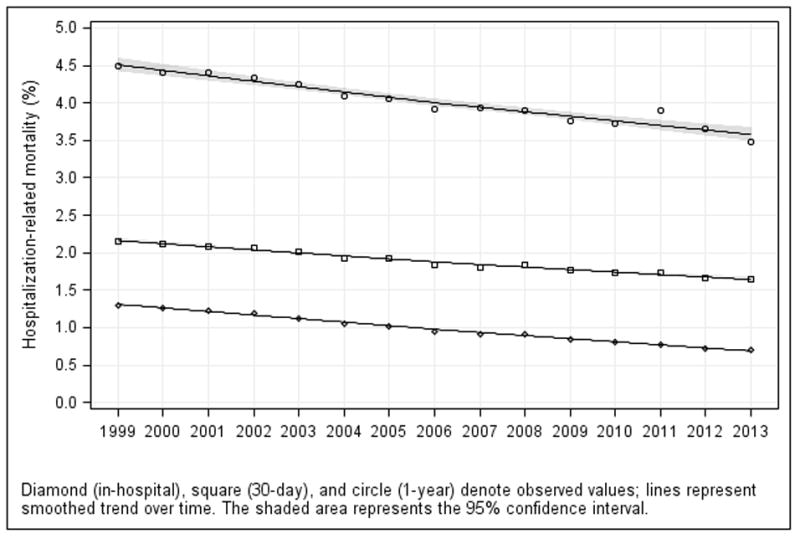
Figure 3. Trends in Observed (A) Hospitalization Rates and (B) Hospitalization-Related Outcomes in the Medicare Fee-for-Service Population, 1999–2013.
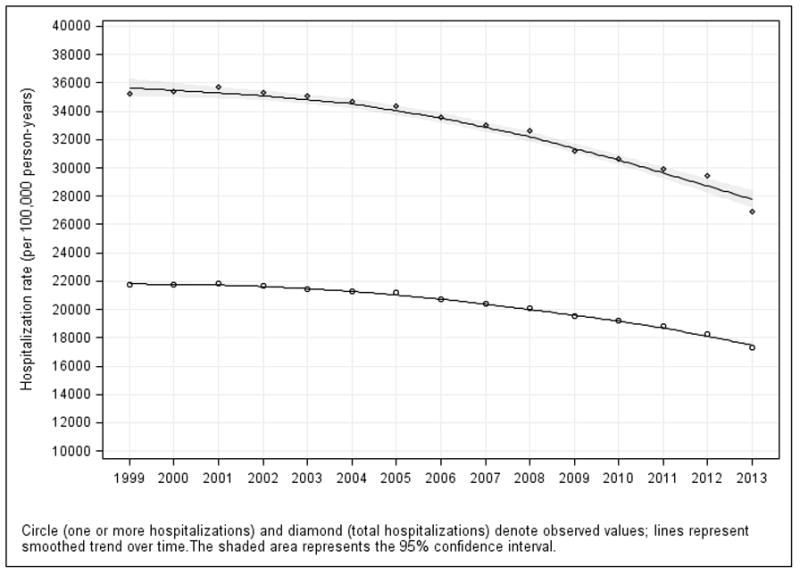
A. Trends in Observed Hospitalization Rates: Rates for 1 or more hospitalizations (circle) and total hospitalizations (diamond) are shown in the figure and Table 3; hospitalizations for major surgical care are shown in Table 3. They all declined over time. The symbols around each trend line represent the observed hospitalization rates for each year. Lines were smoothed using the loess method (local regression).
B: Trends in Observed In-Hospital, 30-Day, and 1-Year Mortality Rates: Among hospitalized patients: In-hospital (diamond), 30-day (square), and 1-year (circle) mortality. The symbols around each trend line represent the observed mortality rates for each year. Lines were smoothed using the loess method (local regression).
The most frequent principal diagnosis of these hospitalizations changed between 1999 and 2013: pneumonia was the leading diagnosis in 1999, but it declined to fifth by 2013, surpassed by osteoarthritis and other allied disorders, septicemia, heart failure, and cardiac dysrhythmias (Figure S5).
Trends in Hospitalization-Related Deaths, Expenditures, and Patterns of Care Among Fee-for-Service Beneficiaries
Among hospitalized Fee-for-Service beneficiaries, in-hospital mortality declined from 1.30% to 0.71% (difference, 0.59 percentage points; 95% CI, 0.59 to 0.60), 30-day mortality declined from 2.16% to 1.65% (difference, 0.51 percentage points; 95% CI, 0.50 to 0.51), and 1-year mortality declined from 4.49% to 3.48% (difference, 1.01%; 95% CI, 0.99 to 1.01) (Table 1, Figure 3B). These findings did not change substantially after accounting for beneficiary age-sex-race and geographical location: for in-hospital mortality, 30-day mortality, and 1-year mortality, respectively, the adjusted annual declines, consistent across age-sex-race subgroups, were 4.49% (95% CI, 4.45 to 4.55), 2.02% (95% CI, 1.98 to 2.06), and 1.80% (95% CI, 1.76 to 1.83). (Figure S1 and Table S2).
From 1999 through 2013, the annual CPI-adjusted mean Medicare inpatient expenditure per beneficiary declined from $3,290 to $2,801. The mean (SD) hospital length of stay for beneficiaries who had ≥1 hospitalization declined from 6.0 (6.8) to 5.1 (5.6) days. Beneficiaries were increasingly likely to be discharged to a skilled nursing facility, home with care, hospice, and long-term care, and less likely to be discharged to home or transferred to another acute-care facility (Table 3).
Table 3.
Major Discharge Disposition, 1999–2013.
| Discharge Disposition | 1999 | 2000 | 2001 | 2002 | 2003 | 2004 | 2005 | 2006 | 2007 | 2008 | 2009 | 2010 | 2011 | 2012 | 2013 |
|---|---|---|---|---|---|---|---|---|---|---|---|---|---|---|---|
|
| |||||||||||||||
| Rate, % (95% confidence interval)
| |||||||||||||||
| Home | 55.29 (55.25–55.32) | 55.81 (55.78–55.84) | 55.82 (55.79–55.85) | 54.47 (54.44–54.50) | 52.79 (52.76–52.82) | 50.49 (50.46–50.52) | 50.06 (50.03–50.09) | 49.31 (49.28–49.34) | 48.34 (48.31–48.37) | 47.21 (47.18–47.25) | 46.51 (46.47–46.54) | 45.40 (45.36–45.43) | 44.74 (44.70–44.77) | 43.93 (43.90–43.96) | 42.94 (42.91–42.98) |
| Home with care service | 10.65 (10.63–10.67) | 10.26 (10.24–10.28) | 10.00 (9.98–10.02) | 10.48 (10.46–10.50) | 11.65 (11.63–11.67) | 13.68 (13.66–13.70) | 13.92 (13.90–13.95) | 14.53 (14.51–14.56) | 14.99 (14.96–15.01) | 15.43 (15.41–15.46) | 16.00 (15.97–16.02) | 16.63 (16.61–16.66) | 16.62 (16.59–16.64) | 17.38 (17.36–17.41) | 17.56 (17.53–17.58) |
| Transferred out | 3.21 (3.20–3.22) | 3.20 (3.19–3.21) | 3.09 (3.08–3.10) | 3.07 (3.06–3.08) | 2.71 (2.70–2.72) | 2.47 (2.47–2.48) | 2.28 (2.27–2.29) | 2.11 (2.11–2.12) | 2.03 (2.02–2.04) | 1.96 (1.95–1.97) | 1.85 (1.84–1.86) | 1.79 (1.78–1.80) | 1.75 (1.74–1.75) | 2.06 (2.05–2.07) | 1.81 (1.80–1.82) |
| Rehabilitation | — | — | — | 2.80 (2.79–2.81) | 4.00 (3.99–4.01) | 4.21 (4.20–4.22) | 3.90 (3.89–3.91) | 3.77 (3.75–3.78) | 3.63 (3.62–3.64) | 3.63 (3.62–3.65) | 3.74 (3.72–3.75) | 3.74 (3.73–3.75) | 3.89 (3.88–3.91) | 3.84 (3.83–3.86) | 4.10 (4.08–4.11) |
| Long-term care | — | — | — | 0.37 (0.37–0.37) | 0.70 (0.70–0.71) | 0.82 (0.82–0.83) | 0.90 (0.89–0.90) | 0.95 (0.94–0.95) | 0.99 (0.98–1.00) | 1.03 (1.02–1.04) | 1.07 (1.06–1.08) | 1.11 (1.10–1.11) | 1.15 (1.15–1.16) | 1.14 (1.13–1.15) | 1.18 (1.18–1.19) |
| Intermediate care or skilled nursing facility | 20.04 (20.02–20.07) | 19.76 (19.73–19.78) | 19.75 (19.72–19.77) | 19.48 (19.45–19.50) | 19.82 (19.80–19.85) | 20.43 (20.40–20.45) | 21.05 (21.03–21.08) | 21.54 (21.51–21.57) | 22.16 (22.13–22.19) | 22.72 (22.69–22.75) | 22.90 (22.87–22.93) | 23.35 (23.33–23.38) | 23.74 (23.71–23.77) | 23.63 (23.60–23.66) | 23.92 (23.89–23.95) |
| Hospice | 0.12 (0.12–0.13) | 0.19 (0.19–0.20) | 0.35 (0.35–0.36) | 0.66 (0.66–0.67) | 0.99 (0.98–0.99) | 1.39 (1.38–1.40) | 1.68 (1.67–1.69) | 1.94 (1.93–1.95) | 2.17 (2.16–2.18) | 2.37 (2.36–2.38) | 2.57 (2.56–2.58) | 2.76 (2.75–2.77) | 2.98 (2.96–2.99) | 3.03 (3.02–3.04) | 3.28 (3.27–3.30) |
| Expired | 5.98 (5.96–6.00) | 5.80 (5.78–5.82) | 5.59 (5.57–5.61) | 5.53 (5.51–5.55) | 5.28 (5.26–5.30) | 4.97 (4.95–4.99) | 4.84 (4.82–4.86) | 4.60 (4.58–4.61) | 4.48 (4.46–4.50) | 4.51 (4.50–4.53) | 4.30 (4.29–4.32) | 4.17 (4.15–4.18) | 4.13 (4.11–4.15) | 3.96 (3.95–3.98) | 4.09 (4.07–4.11) |
| Others | 5.38 (5.36–5.39) | 5.64 (5.63–5.66) | 5.99 (5.98–6.01) | 3.76 (3.75–3.78) | 2.61 (2.60–2.62) | 2.07 (2.06–2.08) | 1.86 (1.85–1.86) | 1.70 (1.69–1.71) | 1.64 (1.63–1.65) | 1.57 (1.57–1.58) | 1.48 (1.47–1.49) | 1.46 (1.45–1.46) | 1.42 (1.41–1.42) | 1.45 (1.44–1.46) | 1.50 (1.49–1.51) |
“—” indicates that information was not available or considered unreliable.
Trends in Hospitalizations and Expenditures in the Last 1, 3, and 6 Months of Life Among Fee-for-Service Beneficiaries
Among Medicare Fee-for-Service beneficiaries who died during the study period, the utilization of inpatient care during their last 6 months of life decreased: the total number of hospitalizations declined from 131.1 to 102.9 per 100 deaths (difference 28.2; 95% CI, 27.9 to 28.4), the percentage of beneficiaries with 1 or more hospitalizations decreased from 70.5 to 56.8 per 100 deaths (difference 13.7; 95% CI, 13.5 to 13.8), and the average number of days spent as an inpatient declined from 17 to 14 (Table 2). However, there was a mixed pattern of expenditures in the last 6 months of life, which increased from $15,312 per deceased beneficiary in 1999 to $17,423 in 2009, then decreased to $13,388 in 2013. Similar patterns were observed in the last 3 months and 1 month of life (Table 2). Overall, approximately 60% of spending in the last 6 months of beneficiaries’ lives occurred during their final month.
Table 2.
Trends in Hospitalizations and Expenditures in the Last 1, 3, and 6 Months of Life Among Fee-for-Service Beneficiaries, 1999–2013.
| Measure | 1999 | 2000 | 2001 | 2002 | 2003 | 2004 | 2005 | 2006 | 2007 | 2008 | 2009 | 2010 | 2011 | 2012 | 2013 |
|---|---|---|---|---|---|---|---|---|---|---|---|---|---|---|---|
| Last 1 month of life | |||||||||||||||
| CPI-adjusted Medicare inpatient expenditure per death* ($) | 9,038 | 8,771 | 9,102 | 9,189 | 8,852 | 8,652 | 8,683 | 8,759 | 8,893 | 9,242 | 9,836 | 9,438 | 9,115 | 8,793 | 8,410 |
| Total mean length of stay (days) | 15 | 15 | 15 | 15 | 15 | 15 | 15 | 15 | 15 | 14 | 14 | 14 | 13 | 13 | 13 |
| ≥1 hospitalization (per 100 deaths*) | 41.5 | 41.3 | 41.3 | 41.4 | 41.0 | 40.7 | 39.9 | 38.9 | 39.0 | 39.0 | 38.8 | 38.2 | 38.0 | 37.3 | 36.4 |
| Total hospitalizations (per 100 deaths*) | 65.9 | 65.9 | 66.7 | 66.5 | 66.3 | 65.8 | 64.8 | 63.3 | 63.6 | 63.7 | 62.9 | 61.8 | 61.1 | 60.3 | 57.1 |
| Last 3 months of life | |||||||||||||||
| CPI-adjusted Medicare inpatient expenditure per death* ($) | 12,406 | 12,104 | 12,616 | 12,710 | 12,412 | 12,273 | 12,316 | 12,445 | 12,660 | 13,093 | 13,984 | 13,475 | 12,985 | 12,703 | 11,446 |
| Ratio of expenditure (last 1 month to last 3 months) | 0.729 | 0.725 | 0.721 | 0.723 | 0.713 | 0.705 | 0.705 | 0.704 | 0.702 | 0.706 | 0.703 | 0.700 | 0.702 | 0.692 | 0.735 |
| Total mean length of stay (days) | 16 | 16 | 16 | 16 | 16 | 16 | 16 | 16 | 16 | 16 | 15 | 15 | 14 | 14 | 14 |
| ≥1 hospitalization (per 100 deaths*) | 57.2 | 57.0 | 57.4 | 57.3 | 57.0 | 57.0 | 55.8 | 54.9 | 55.2 | 55.0 | 54.9 | 54.4 | 53.9 | 53.3 | 49.1 |
| Total hospitalizations (per 100 deaths*) | 100.0 | 100.4 | 102.2 | 101.5 | 102.1 | 102.0 | 100.3 | 98.8 | 99.7 | 99.5 | 98.6 | 97.3 | 96.1 | 95.5 | 84.4 |
| Last 6 months of life | |||||||||||||||
| CPI-adjusted Medicare inpatient expenditure per death* ($) | 15,312 | 15,014 | 15,684 | 15,727 | 15,455 | 15,370 | 15,371 | 15,565 | 15,838 | 16,292 | 17,423 | 16,865 | 16,231 | 16,012 | 13,388 |
| Ratio of expenditure (last 1 month to last 6 months) | 0.590 | 0.584 | 0.580 | 0.584 | 0.573 | 0.563 | 0.565 | 0.563 | 0.561 | 0.567 | 0.565 | 0.560 | 0.562 | 0.549 | 0.628 |
| Total mean length of stay (days) | 17 | 17 | 17 | 17 | 17 | 17 | 16 | 16 | 16 | 16 | 15 | 15 | 15 | 15 | 14 |
| ≥1 hospitalization (per 100 deaths*) | 70.5 | 70.7 | 71.2 | 70.6 | 70.6 | 70.7 | 69.0 | 68.2 | 68.7 | 68.1 | 68.4 | 67.9 | 67.2 | 66.9 | 56.8 |
| Total hospitalizations (per 100 deaths*) | 131.1 | 132.6 | 134.9 | 133.4 | 134.6 | 134.9 | 132.0 | 130.7 | 132.2 | 131.3 | 130.8 | 129.4 | 127.4 | 127.4 | 102.9 |
Any deaths that occurred within 1 year regardless of hospitalizations.
CPI, Consumer Price Index
DISCUSSION
In this comprehensive analysis of the hospital trends in the Medicare Fee-for-Service population aged ≥ 65 years, there were marked reductions in all-cause mortality rates, all-cause hospitalization rates, and inpatient expenditures, as well as improvements in outcomes during and after hospitalization. Although the geographic variations are marked, even the worst performing regions in 2013 performed at a higher level than the best performing regions in 1999. Moreover, hospitalizations for beneficiaries in the last 6 months of life declined. Even though it is difficult to disentangle the specific reasons for improvement, it is clear that over the past 15 years there have been marked reductions in mortality, hospitalization, and adverse hospital outcomes.
There are many possible explanations for our findings of reduced hospitalizations and improved mortality. First, the improvements may, at least in part, be associated with national efforts to improve the care of all patients across the study period. The Health Care Financing Administration (now CMS) introduced the Health Care Quality Improvement Initiative in 1992.7 In the ensuing years, many other efforts driven by CMS and other organizations were launched, which may have favorably affected outcomes.8–13 There is evidence for improvements in process measures for many conditions that affect large numbers of beneficiaries14 as well as outcomes for specific conditions.5,15–18
Second, these changes may have been, in part, a reflection of healthier behaviors. Although obesity was increasing, this period was marked by increases in exercise and decreases in smoking.19 Risk factor management has also improved.19
Third, shifting lifetime exposures could also have accounted for some of the change. For example, people born in later years are healthier because of improvements in public health and different exposures during their lifetime. However, the period is rather short for dramatic changes in effects based on the years when people were born.
Fourth, these improvements in outcomes observed may have been related, at least in part, to technological advances. During the study period, several targeted cancer therapies that appear to extend life became available to patients, and the use of statins for prevention and coronary revascularization markedly expanded, likely easing the morbidity and mortality associated with cardiovascular disease.20 In addition to drug and device innovation, the proliferation of other technologies may be contributory; for example, advances in telecommunications have helped many patients, especially those in rural areas, to receive medical attention more rapidly.
Fifth, changes in percentage of people in Fee-for-Service may be related to less well individuals moving from Fee-for-Service to Medicare Advantage, leaving a healthier population in Fee-for-Service and an appearance of improvement over time. However, with respect to mortality, our empirical analyses and those of others indicate that the Medicare Advantage beneficiaries have a lower risk of death than Fee-for-Service beneficiaries.21 Moreover, since 2003 both groups have experienced similar declines in overall mortality, lending support to the conclusion that the observed changes among the Fee-for-Service population are not the result of changes in the risks of the groups relative to each other and do represent true improvement. Moreover, other studies have found that healthier people are likely to shift enrollment from Fee-for-Service to Medicare Advantage, which may have led to an underestimation of the improvement over time,22,23 because we observed increasing enrollment in Medicare Advantage over time.
Other factors merit consideration. Lack of access to care is an unlikely explanation for the declining hospitalization rates, as the Medicare population is insured and few physicians doctors have opted out of Medicare.24 Hospitalizations have been avoided as a result of trends toward performing elective procedures on an outpatient basis. However, prior studies showing reductions in selected acute events, such as acute myocardial infarction and heart failure,5 suggest that the reduction in hospitalization rates is not entirely a result of movement of procedures to the outpatient setting. Nevertheless, this trend toward outpatient care has likely also contributed to the change. Additionally, improvements in air quality may have affected hospitalization and mortality rates.25,26
The study also revealed that the improvements were consistent across several patient groups, defined by age, sex, and race. Declines in annual mortality and hospitalization rates, although most pronounced in the youngest age groups, were even observed among patients who were aged ≥85 years. Black and white patients had similar magnitudes of improvement, yet racial disparities persisted.
The study has some other important findings. Patients were increasingly discharged to rehabilitation and nursing facilities or with home health care, whereas the proportion of patients discharged to home without care decreased steadily. The cause of this shift may be the declining lengths of hospital stay or the increased focus on providing high-quality post-acute care.27,28 It may also be that hospitalizations are being reserved for patients who have higher clinical severity of disease, although that explanation contrasts with our finding that mortality rates associated with hospitalizations declined.
In addition, analyses of data on care during the last 6 months of life revealed divergent patterns in treatment intensity and the use of hospital resources, as hospitalizations and lengths of stay decreased, but inflation-adjusted expenditure increased. The decreased hospitalization rates may reflect an increasing recognition of the importance of person-centered care at the end of life, and a focus on decreasing the burden of multiple care transitions and hospitalizations on patients and their families.29–33 The increasing role of hospice may also be a contributory factor. Other studies, which are important but less contemporary and with a more limited range of years, have also noted lower hospitalization rates at the end of life and increasing expenditures.34 Our study adds a perspective since 1999 and evidence that the trend has continued through 2013. We also show that more than half of the inpatient expenditures in the last 6 months of life occur in the last month.
The study has several limitations. First, we necessarily focused on the Medicare Fee-for-Service population to describe hospitalizations and their associated outcomes and expenditures because those enrolled in the Medicare Advantage program are not described in the Medicare inpatient files. Nevertheless, our findings and those of others suggest that changes in the Fee-for-Service population as a result of movement into Medicare Advantage do not account for the improvement. Second, the study was not capable of establishing the causes of the observed changes in mortality, hospitalization rates, and expenditures. It is likely that improvements in health and the health care of the population, as well as changes in health care delivery, have produced tangible benefits that are reflected in mortality and hospital resource utilization. There is a need for further study of all expenditures to determine how reductions in inpatient expenditures are related to those in other areas, particularly with respect to post-acute care. Finally, we used administrative claims data, which lack the clinical detail afforded by medical records; however, clinical data do not offer a significant advantage over administrative claims data in analyses of overall mortality, hospitalization, and expenditures.
CONCLUSIONS
Among Medicare Fee-for-Service beneficiaries aged ≥65, all-cause mortality rates, hospitalization rates, and expenditures per beneficiary decreased from 1999 to 2013. In the last 6 months of life, total hospitalizations decreased and inpatient expenditures decreased in recent years. Health outcomes related to hospitalizations appear to have improved substantially in the last 2 decades.
Supplementary Material
Acknowledgments
Funding/Support: Dr. Krumholz is supported by grant U01 HL105270-05 (Center for Cardiovascular Outcomes Research at Yale University) from the National Heart, Lung, and Blood Institute. The National Heart, Lung, and Blood Institute had no role in the design and conduct of the study; collection, management, analysis, and interpretation of the data; preparation, review, or approval of the manuscript; and decision to submit the manuscript for publication
Footnotes
Disclosures: Dr. Krumholz is the recipient of research grants from Medtronic and from Johnson & Johnson, through Yale University, to develop methods of clinical trial data sharing, and chairs a cardiac scientific advisory board for UnitedHealth. Drs. Krumholz and Normand work under contract to the Centers for Medicare & Medicaid Services to develop and maintain performance measures. The other authors do not have disclosures to report.
Data Access, Responsibility, and Analysis: Dr. Wang had full access to all the data in the study and takes responsibility for the integrity of the data and the accuracy of the data analysis.
References
- 1.Krumholz HM, Wang Y, Mattera JA, et al. An administrative claims model suitable for profiling hospital performance based on 30-day mortality rates among patients with heart failure. Circulation. 2006;113(13):1693–1701. doi: 10.1161/CIRCULATIONAHA.105.611194. [DOI] [PubMed] [Google Scholar]
- 2.Krumholz HM, Wang Y, Mattera JA, et al. An administrative claims model suitable for profiling hospital performance based on 30-day mortality rates among patients with an acute myocardial infarction. Circulation. 2006;113(13):1683–1692. doi: 10.1161/CIRCULATIONAHA.105.611186. [DOI] [PubMed] [Google Scholar]
- 3. [Accessed June 19, 2015];Surgical Care Improvement Project. http://www.jointcommission.org/surgical_care_improvement_project/
- 4.CPI Inflation Calculator. [Accessed June 19, 2015];2014 http://www.bls.gov/data/inflation_calculator.htm.
- 5.Krumholz HM, Normand SL, Wang Y. Trends in hospitalizations and outcomes for acute cardiovascular disease and stroke, 1999–2011. Circulation. 2014;130(12):966–975. doi: 10.1161/CIRCULATIONAHA.113.007787. [DOI] [PMC free article] [PubMed] [Google Scholar]
- 6.Normand S-LT, Wang Y, Krumholz HM. Assessing surrogacy of data sources for institutional comparisons. Health Serv Outcome Res Meth. 2007;7(1–2):79–96. [Google Scholar]
- 7.Jencks SF, Wilensky GR. The health care quality improvement initiative. A new approach to quality assurance in Medicare. JAMA. 1992;268(7):900–903. [PubMed] [Google Scholar]
- 8.Costante PA. AMAP: toward standardized physician quality data. American Medical Accreditation Program. N J Med. 1999;96(10):47–48. [PubMed] [Google Scholar]
- 9.Ellerbeck EF, Jencks SF, Radford MJ, et al. Quality of care for Medicare patients with acute myocardial infarction. A four-state pilot study from the Cooperative Cardiovascular Project. JAMA. 1995;273(19):1509–1514. [PubMed] [Google Scholar]
- 10.Larson JS, Muller A. Managing the quality of health care. J Health Hum Serv Admin. 2002;25(3):261–280. [PubMed] [Google Scholar]
- 11.Lee KY, Loeb JM, Nadzam DM, Hanold LS. Special Report: An Overview of the Joint Commission’s ORYX Initiative and Proposed Statistical Methods. Health Serv Outcome Res Meth. 2000;1(1):63–73. [Google Scholar]
- 12.Marciniak TA, Ellerbeck EF, Radford MJ, et al. Improving the quality of care for Medicare patients with acute myocardial infarction: results from the Cooperative Cardiovascular Project. JAMA. 1998;279(17):1351–1357. doi: 10.1001/jama.279.17.1351. [DOI] [PubMed] [Google Scholar]
- 13.Sawin CT, Walder DJ, Bross DS, Pogach LM. Diabetes process and outcome measures in the Department of Veterans Affairs. Diabetes care. 2004;27(Suppl 2):B90–94. doi: 10.2337/diacare.27.suppl_2.b90. [DOI] [PubMed] [Google Scholar]
- 14.Nuti SV, Wang Y, Masoudi FA, et al. Improvements in the distribution of hospital performance for the care of patients with acute myocardial infarction, heart failure, and pneumonia, 2006–2011. Med Care. 2015;53(6):485–491. doi: 10.1097/MLR.0000000000000358. [DOI] [PMC free article] [PubMed] [Google Scholar]
- 15.Chen J, Dharmarajan K, Wang Y, Krumholz HM. National trends in heart failure hospital stay rates, 2001 to 2009. J Am Coll Cardiol. 2013;61(10):1078–1088. doi: 10.1016/j.jacc.2012.11.057. [DOI] [PMC free article] [PubMed] [Google Scholar]
- 16.Chen J, Normand SL, Wang Y, Drye EE, Schreiner GC, Krumholz HM. Recent declines in hospitalizations for acute myocardial infarction for Medicare fee-for-service beneficiaries: progress and continuing challenges. Circulation. 2010;121(11):1322–1328. doi: 10.1161/CIRCULATIONAHA.109.862094. [DOI] [PubMed] [Google Scholar]
- 17.Chen J, Normand SL, Wang Y, Krumholz HM. National and regional trends in heart failure hospitalization and mortality rates for Medicare beneficiaries, 1998–2008. JAMA. 2011;306(15):1669–1678. doi: 10.1001/jama.2011.1474. [DOI] [PMC free article] [PubMed] [Google Scholar]
- 18.Masoudi FA, Foody JM, Havranek EP, et al. Trends in acute myocardial infarction in 4 US states between 1992 and 2001: clinical characteristics, quality of care, and outcomes. Circulation. 2006;114(25):2806–2814. doi: 10.1161/CIRCULATIONAHA.106.611707. [DOI] [PubMed] [Google Scholar]
- 19.Centers for Disease Control and Prevention. CDC National Health Report: Leading causes of morbidity and mortality and associated behavioral risk and protective factors - United States, 2005–2013. MMWR. 2014;63(Suppl)(4) [PubMed] [Google Scholar]
- 20.Kesselheim AS, Avorn J. The most transformative drugs of the past 25 years: a survey of physicians. Nat Rev Drug Discov. 2013;12(6):425–431. doi: 10.1038/nrd3977. [DOI] [PubMed] [Google Scholar]
- 21.Newhouse JP, Price M, Huang J, McWilliams JM, Hsu J. Steps to reduce favorable risk selection in Medicare Advantage largely succeeded, boding well for health insurance exchanges. Health Aff (Millwood) 2012;31(12):2618–2628. doi: 10.1377/hlthaff.2012.0345. [DOI] [PMC free article] [PubMed] [Google Scholar]
- 22.Dowd B, Maciejewski ML, O’Connor H, Riley G, Geng Y. Health plan enrollment and mortality in the Medicare program. Health Econ. 2011;20:645–659. doi: 10.1002/hec.1623. [DOI] [PubMed] [Google Scholar]
- 23.Nicholas LH. Better quality of care or healthier patients? Hospital utilization by Medicare Advantage and Fee-for-Service enrollees. Forum Health Econ Policy. 2013;16(1):137–161. doi: 10.1515/fhep-2012-0037. [DOI] [PMC free article] [PubMed] [Google Scholar]
- 24.Boccuti C, Swoope C, Damico A, Neuman T. Medicare patients’ access to physicians: a synthesis of the evidence. The Kaiser Family Foundation; 2013. [Accessed July 18, 2015]. http://kff.org/medicare/issue-brief/medicare-patients-access-to-physicians-a-synthesis-of-the-evidence/ [Google Scholar]
- 25.Correia AW, Pope CA, 3rd, Dockery DW, Wang Y, Ezzati M, Dominici F. Effect of air pollution control on life expectancy in the United States: an analysis of 545 U.S. counties for the period from 2000 to 2007. Epidemiology. 2013;24(1):23–31. doi: 10.1097/EDE.0b013e3182770237. [DOI] [PMC free article] [PubMed] [Google Scholar]
- 26.Dominici F, Peng RD, Bell ML, et al. Fine particulate air pollution and hospital admission for cardiovascular and respiratory diseases. JAMA. 2006;295(10):1127–1134. doi: 10.1001/jama.295.10.1127. [DOI] [PMC free article] [PubMed] [Google Scholar]
- 27. [Accessed June 18, 2015];Home Health Quality Initiative. 2014 https://www.cms.gov/Medicare/Quality-Initiatives-Patient-Assessment-Instruments/HomeHealthQualityInits/index.html?redirect=/HomeHealthQualityInits/
- 28. [Accessed June 19, 2015];Nursing Home Quality Initiative. 2014 http://www.cms.gov/Medicare/Quality-Initiatives-Patient-Assessment-Instruments/NursingHomeQualityInits/index.html?redirect=/nursinghomequalityinits/
- 29.The SUPPORT Principal Investigators. A controlled trial to improve care for seriously ill hospitalized patients. The study to understand prognoses and preferences for outcomes and risks of treatments (SUPPORT) JAMA. 1995;274(20):1591–1598. [PubMed] [Google Scholar]
- 30.Patient Self-Determination Act. Omnibus Budget Reconciliation Act. Public law. 1990:101–508. 4206. [Google Scholar]
- 31.Field MJ, Cassel CK. Approaching Death:: Improving Care at the End of Life. National Academies Press; 1997. [PubMed] [Google Scholar]
- 32.Institute of Medicine. Dying in America: Improving Quality and Honoring Individual Preferences Near the End of Life. Washington, DC: The National Academies Press; 2014. [PubMed] [Google Scholar]
- 33.Wennberg JE, Fisher ES, Goodman DC, Skinner JS. Tracking the care of patients with severe chronic illness. The Dartmouth Atlas of Health Care; 2008. [PubMed] [Google Scholar]
- 34.Fisher ES, Wennberg JE, Skinner JS, Chasan-taber S, Bronner KK. Tracking improvements in the care of chronically ill patients: a Dartmouth Atlas brief on Medicare beneficiaries near the end of life. 2013:7–10. [PubMed] [Google Scholar]
Associated Data
This section collects any data citations, data availability statements, or supplementary materials included in this article.