Abstract
Purpose
To investigate whether qualitative magnetic resonance (MR) features can distinguish leiomyosarcoma (LMS) from atypical leiomyoma (ALM) and assess the feasibility of texture analysis (TA).
Methods
This retrospective study included 41 women (ALM=22, LMS=19) imaged with MRI prior to surgery. Two readers (R1, R2) evaluated each lesion for qualitative MR features. Associations between MR features and LMS were evaluated with Fisher's exact test. Accuracy measures were calculated for the four most significant features. TA was performed for 24 patients (ALM=14, LMS=10) with uniform imaging following lesion segmentation on axial T2-weighted images. Texture features were pre-selected using Wilcoxon signed-rank test with Bonferroni correction and analyzed with unsupervised clustering to separate LMS from ALM.
Results
Four qualitative MR features most strongly associated with LMS were nodular borders, haemorrhage, “T2 dark” area(s), and central unenhanced area(s) (p≤0.0001 each feature/reader). The highest sensitivity [1.00 (95%CI:0.82-1.00)/0.95 (95%CI: 0.74-1.00)] and specificity [0.95 (95%CI:0.77-1.00)/1.00 (95%CI:0.85-1.00)] were achieved for R1/R2, respectively, when a lesion had ≥3 of these four features. Sixteen texture features differed significantly between LMS and ALM (p-values: <0.001-0.036). Unsupervised clustering achieved accuracy of 0.75 (sensitivity: 0.70; specificity: 0.79).
Conclusions
Combination of ≥3 qualitative MR features accurately distinguished LMS from ALM. TA was feasible.
Keywords: Magnetic Resonance Imaging, Uterine Leiomyosarcoma, Uterine Leiomyoma, Atypical Uterine Leiomyoma, Texture Analysis
Introduction
Uterine leiomyomas (LM) are very common, observed in nearly 40% of reproductive-age women [1; 2]. Whereas traditionally symptomatic LM were treated with hysterectomy or myomectomy, currently they may be managed with standard surgery or minimally-/non-invasive methods such as uterine artery embolization, MRI-guided high-intensity focused ultrasound, or hormonal therapy [3]. While the latter techniques offer obvious benefits of faster recovery and organ-preservation, they do not provide histopathologic confirmation and could therefore allow leiomyosarcoma (LMS) to go unrecognized. LMS are rare, highly aggressive tumours that require prompt radical resection [4-6]. Unfortunately, distinguishing LMS from LM clinically is often impossible due to the similarity of the symptoms and laboratory data they produce [4-6].
MRI is the best imaging modality for assessing uterine masses before intervention [7]. Most LM are easily recognized as well-circumscribed, homogenous low-T2-signal-intensity (SI) masses with avid post-contrast enhancement [7]. However, the appearance of LM may be affected by degeneration, oedema, and/or unusual patterns of growth, making their differentiation from LMS difficult [8; 9]. Conflicting results from prior studies have led to uncertainty regarding the value of qualitative MRI features for differentiating LMS from unusual/atypical LM (ALM) [9-18]. These studies had small numbers of patients with LMS, included few ALM, and grouped various uterine sarcomas (leiomyosarcoma, endometrial stromal sarcoma, carcinosarcoma, etc.) into one category despite their often having distinct MR features and clinical outcomes.
Furthermore, we are unaware of any published studies regarding the value of quantitative MR texture features for the differentiation of LMS from ALM. Texture analysis (TA) extracts local variations in pixel intensities using well-established mathematical formulas and provides a set of quantifiable metrics that may supplement radiologists' qualitative image interpretations. Research suggests that TA may be of particular value for the differentiation of tumours with similar imaging characteristics on conventional imaging [19-23].
Thus, the aims of our study were to investigate whether qualitative magnetic resonance (MR) features can distinguish leiomyosarcoma (LMS) from atypical leiomyoma (ALM) and assess the feasibility of texture analysis (TA).
Materials and Methods
The Institutional Review Board approved this retrospective, HIPAA-compliant study and waived written informed consent.
Eligibility
We retrospectively searched our institutional database to identify all consecutive patients who 1) underwent myomectomy and/or hysterectomy, 2) had contrast-enhanced MRI within 6 months of surgery, and had either 3) histopathologically-proven leiomyosarcoma, high-grade spindle cell neoplasm, smooth muscle tumour of uncertain malignant potential (STUMP), highly cellular or cellular leiomyoma, mitotically active leiomyoma, “atypical” leiomyoma, leiomyoma with hydropic changes, myxoid leiomyoma (leiomyoma with myxoid stromal changes), epithelioid leiomyoma, or intravenous leiomyomatosis or 4) had ≥1 of the following keywords in their MRI report: atypical/unusual uterine/myometrial mass, cellular leiomyoma/fibroid, or leiomyosarcoma. The above electronic search of our institutional database yielded 144 patients with surgically resected myometrial masses between 1/1/2007 and 12/31/2013. One-hundred and three patients were excluded due to lack of MRI examination prior to the surgery, MRI examination obtained without intravenous contrast administration or only partial coverage of the myometrial mass. The final study population consisted of 41 patients with histopathologically-confirmed diagnoses (ALM=22, LMS=19), none of whom had STUMP. As uniform acquisition parameters are required for machine learning methods, scans were excluded from TA if any of the following were present on the subjective assessment of axial T2-weighted imaging (T2WI): 1) fat saturation (ALM=2, LMS=2), 2) motion artefacts (ALM=2, LMS=5), 3) pixel size >1 standard deviation from the mean (ALM=4, LMS=2). Thus, TA was performed on the scans of 24 patients (ALM=14, LMS=10).
Histopathology
Histopathologic diagnoses rendered by fellowship-trained gynaecologic oncologic pathologists at the time of the initial surgical specimen evaluation served as our reference standard. These diagnoses were based on the Stanford criteria, supplemented by the World Health Organization's Classification of Tumors of the Breast and Female Genital Organs [24; 25].
MR Imaging Protocol
MRIs were obtained at our institution (13/41, 32%) or elsewhere (28/41, 68%) and digitized into our picture archiving and communication system (Centricity PACS; GE Medical Systems, Milwaukee, WI). At our institution, MRIs were acquired on ≥1.5-Tesla systems (GE Medical Systems, Milwaukee, USA) using pelvic phased-array coils for signal reception. At a minimum, each study included axial and sagittal T2-weighted fast spin-echo images (repetition time msec/echo time msec, 3500–4500/85-120; bandwidth (BW), 16-32 kHz; section thickness (ST), 4 mm; intersection gap, 1 mm; field of view (FOV), 20–24 cm; ≥256 × 192 matrix), axial T1-weighted spin-echo images (typical parameters: 400-650/minimum; BW, 32 kHz; ST, 5 mm; intersection gap, 1 mm; FOV, 32–36 cm), and fat-suppressed three-dimensional spoiled gradient-recalled echo T1-weighted images (typical parameters: flip angle, 12°; BW, 62.5-83.3 kHz; ST, 3 mm with no intersection gap; FOV, 20-24 cm) obtained before and 1, 2, 3, and 4 minutes after intravenous administration of gadopentetate dimeglumine (Magnevist; Berlex Laboratories, Montville, NJ) at a dose of 0.1 mmol/kg of body weight.
All 28 outside MR imaging examinations (performed at 24 different imaging centres) met or exceeded standards agreed to by the investigators. These standards required ≥1.5-Tesla systems, phased-array surface coils, acquisition of axial and sagittal T2-weighted images, and spin-echo or gradient-echo axial T1-weighted images obtained before and after intravenous contrast agent administration. With the exception of one MRI examination, all contrast-enhanced sequences were obtained with fat saturation. For all sequences, the parameters were the following: field of view, 20–34 cm; section thickness, 6 mm or less; and 256 × 192 or greater matrix. We could not determine the type of the intravenous contrast agent administered or the timing protocol used at the outside institutions.
Qualitative MR Feature Analysis
One radiologist (D.F., not involved in MR feature interpretation) reviewed all MRI scans. For each of the patients with more than one myometrial mass (16/41, 39%), this radiologist correlated MRI and relevant histopathologic findings and marked one index lesion per patient for both qualitative and quantitative assessment. Two blinded radiologists (Y.L. and J.C.) with 7 and 6 years of experience in oncologic MR imaging independently interpreted all MRI scans.
Each reader evaluated the following qualitative MR features in each lesion: 1) borders (smooth or nodular), 2) haemorrhage, 3) SI relative to the outer myometrium on T2WI, 4) heterogeneity on T2WI, 5) presence/location of cystic alteration(s) on T2WI (SI equal to that of urine), 6) fluid-fluid level(s) on T2WI, 7) flow voids on T2WI (round and/or serpiginous low SI vessels that enhance after contrast administration), 8) SI relative to the myometrium on contrast-enhanced images, and 9) presence/location of unenhanced areas (central versus none or non-central) on contrast-enhanced images (Figure 1). As cystic or myxoid degeneration cannot be distinguished from necrosis on T2WI and contrast-enhanced images, we recorded the presence and location of well-demarcated unenhanced areas on contrast-enhanced images [12]. Majority of the above qualitative MR features were selected for the assessment because they were evaluated in the prior published reports [9-12; 15; 16]. Each reader also recorded the presence of pelvic fluid, peritoneal implants, and pelvic lymphadenopathy (i.e., short axis ≥0.8 cm).
Figure 1.
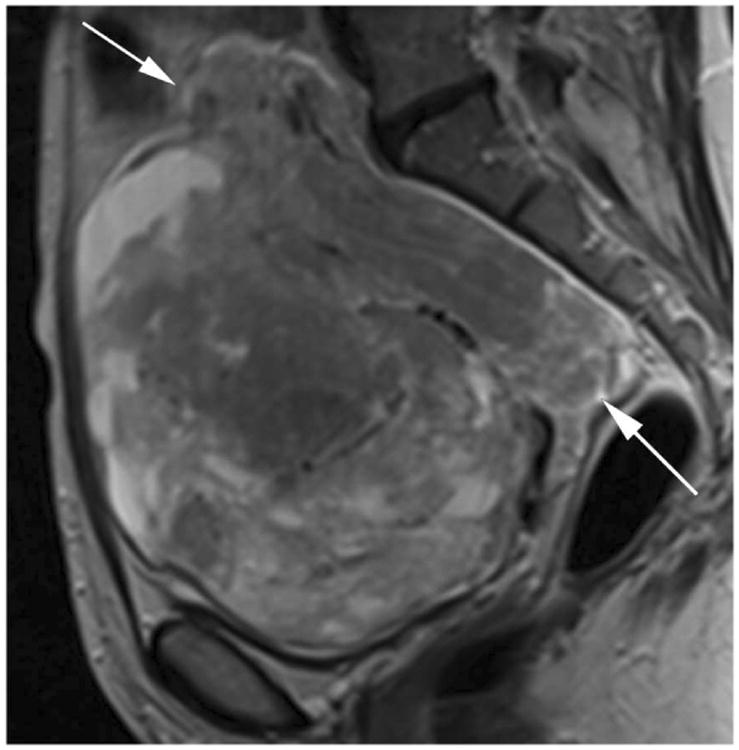
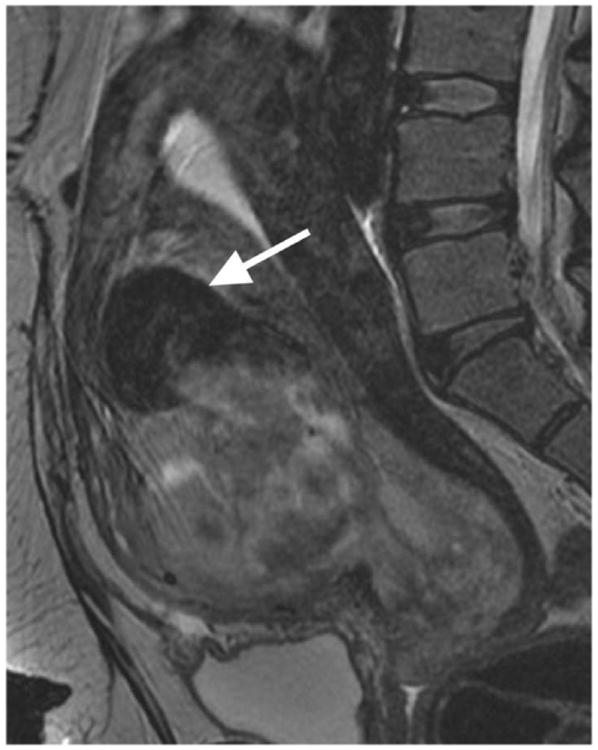
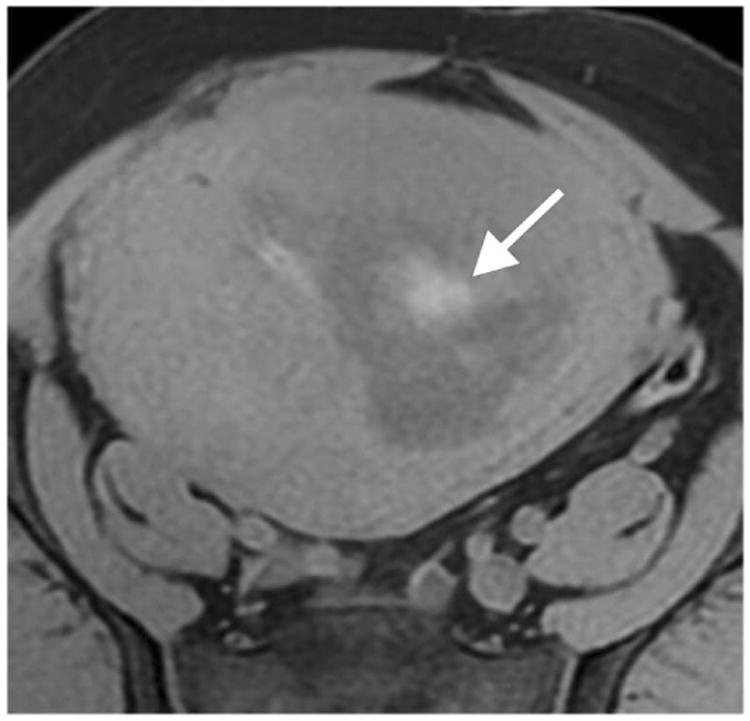
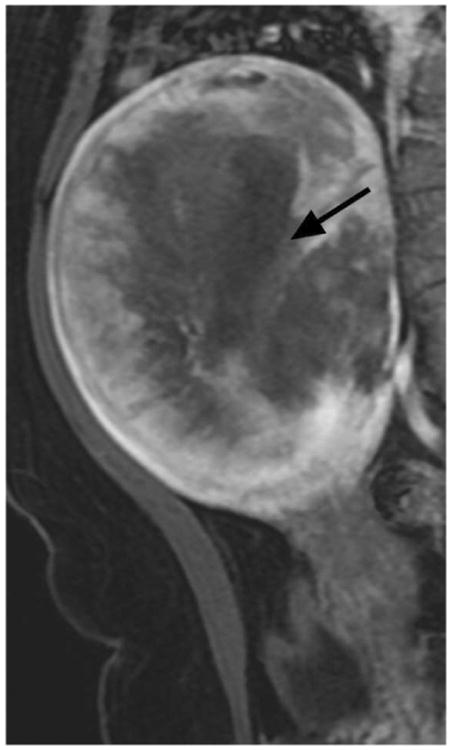
Illustrations of the four qualitative MR features that demonstrated the strongest statistical associations with LMS at histopathology. A. Sagittal T2-weighted image shows a large uterine mass with nodular superior and posterior borders (white arrows). B. Sagittal T2-weighted image demonstrates “T2 dark” area in the myometrial mass (white arrow). C. Noncontrast T1-weighted fat-saturated image illustrates the presence of intra-lesional haemorrhage (white arrow). D. Sagittal contrast-enhanced T1-weighted fat saturated image shows the presence of central unenhanced areas (black arrow).
Quantitative MR Texture Feature Analysis
Image pre-processing
Using Insight ToolKit (ITK) software, the same two radiologists in consensus manually contoured all lesions (one lesion per patient in a total of 24 patients (ALM=14, LMS=10). [26]. On all axial T2WI with visible tumour, they traced the outer edge of each mass to segment the entire lesion and generate regions of interest (ROIs) (duration of measurement: ≤5 minutes per mass). The ROIs were drawn in the median on 17 slices for ALM (interquartile range: 8-21) and 18 slices for LMS (interquartile range: 13-27) to cover the lesion. Any variations in the scanners and acquisition parameters led to the images having different intensity (gray-level) ranges. To ensure a comparable range of intensities (gray-levels) across the patients, all images were standardized through histogram matching using an in-house developed C++ wrapper around the HistogramMatchingImageFilter available in ITK [27].
Texture feature extraction
We employed in-house software implemented in MATLAB (MathWorks, Natick, MA) to extract a total of 21 texture features from each ROI. First, histogram-derived gray-level mean, standard deviation (SD), kurtosis, and skewness were computed from each T2-weighted intensity image, resulting in 4 texture features. Second, Gabor filters at two orientations (0°,90°) and a single bandwidth (g=1.4) were used to generate 2 Gabor edge images [28] (Supplementary Materials). Third, gray-level co-occurrence matrices (GLCM) were constructed from 1 T2-weighted intensity image and 2 Gabor edge images. Finally, Haralick texture features comprised of energy, contrast, homogeneity, correlation, and entropy were computed from GLCM, yielding an additional 5 intensity image-based (Figures 2 and 3) and 12 Gabor edge image-based texture features (Supplementary Materials) [29; 30].
Figure 2.
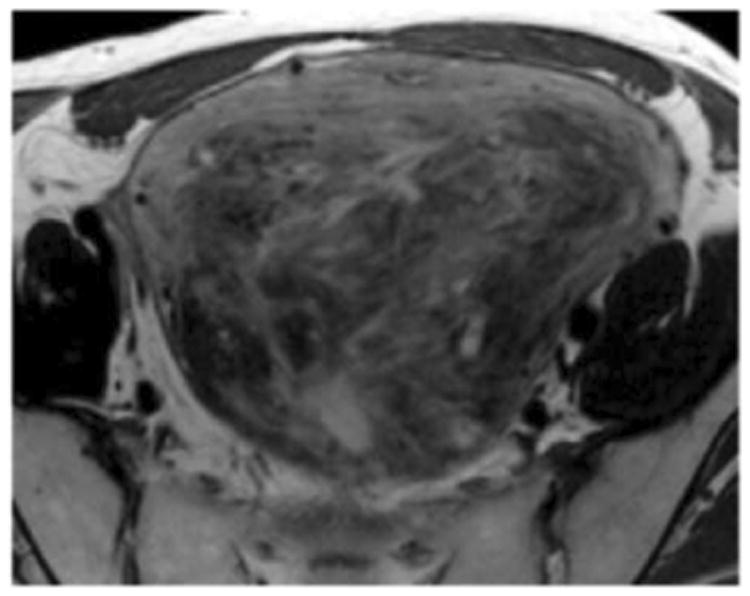
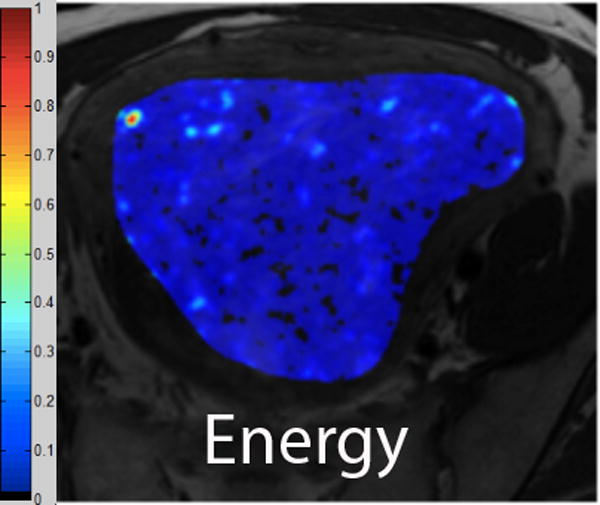
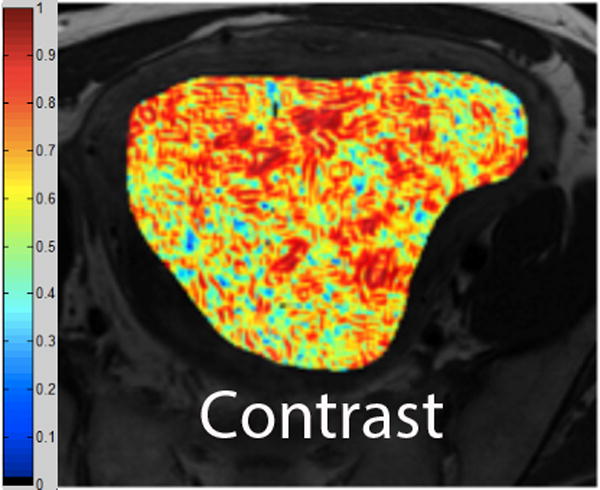
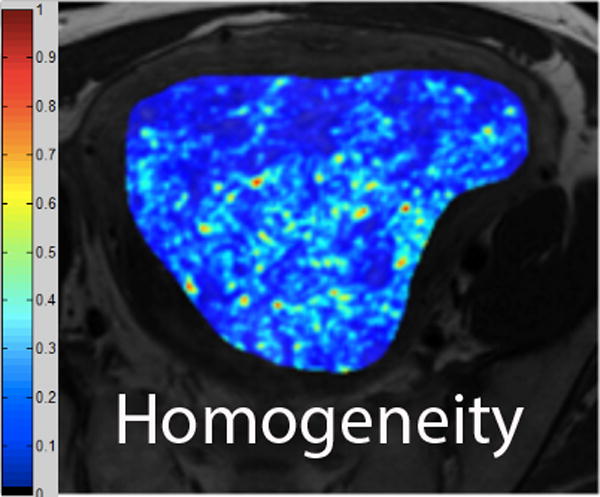
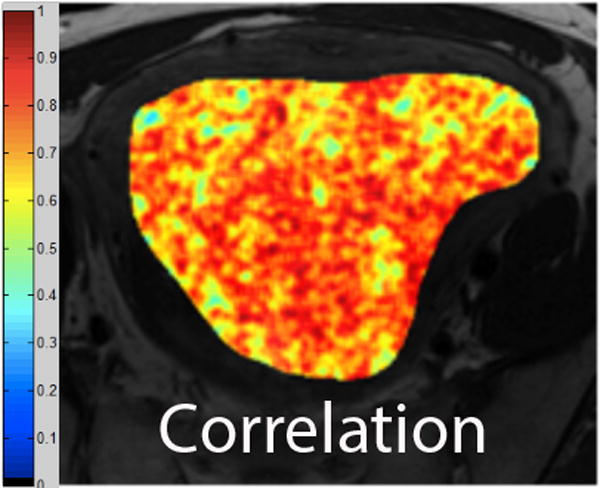
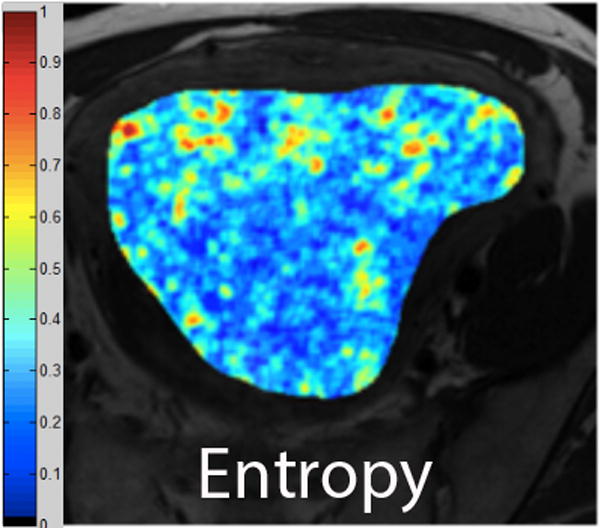
A. Axial T2-weighted image illustrates ALM. B - F. Illustration of the intensity-based texture features (energy, contrast, homogeneity, correlation, and entropy) overlaid on the axial T2-weighted image.
Figure 3.
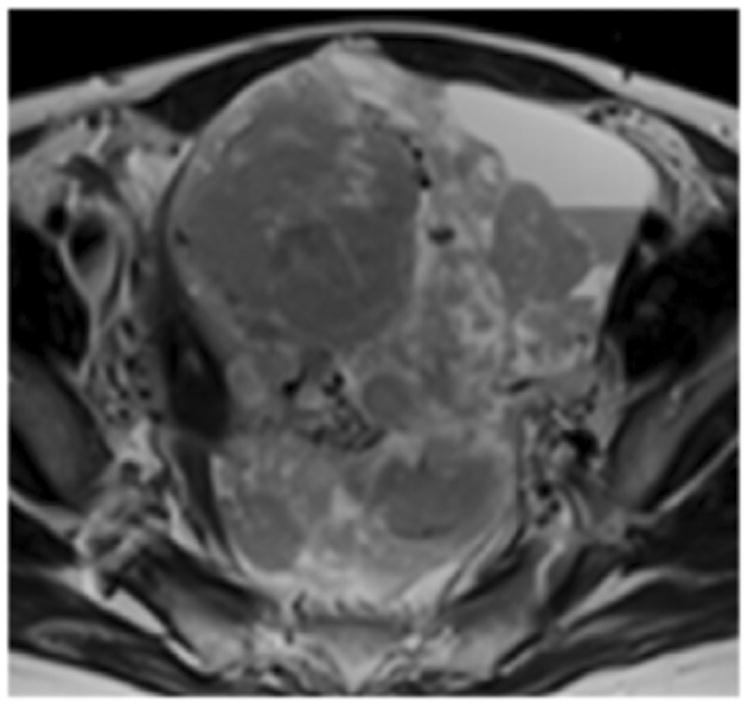
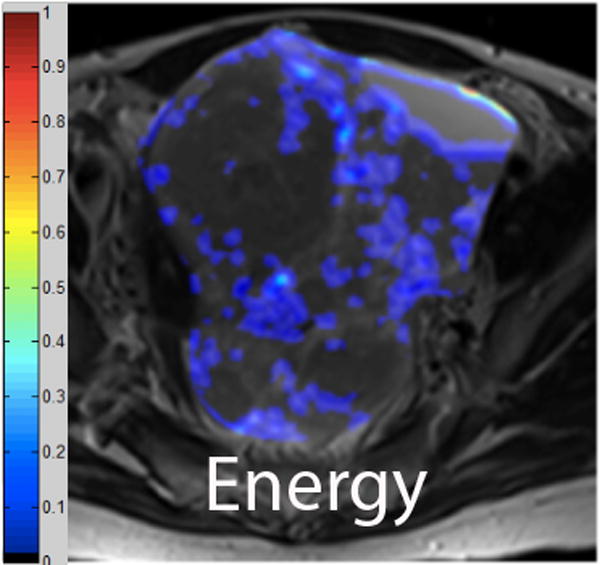
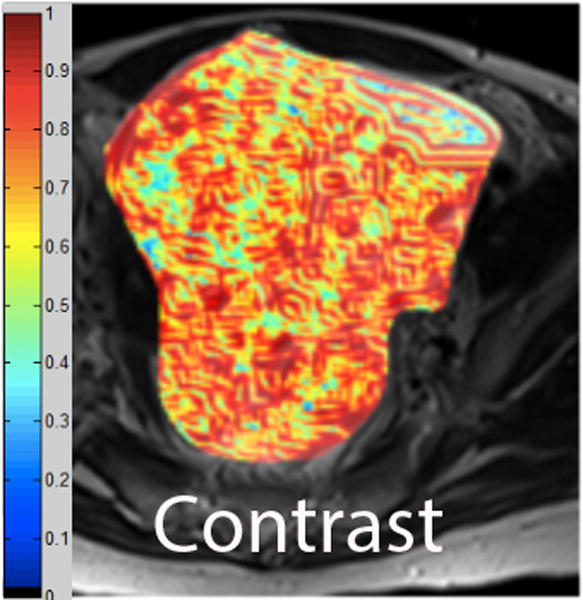
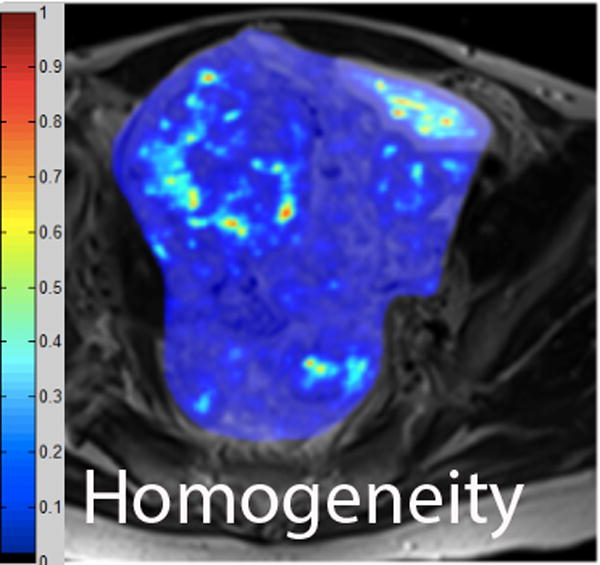
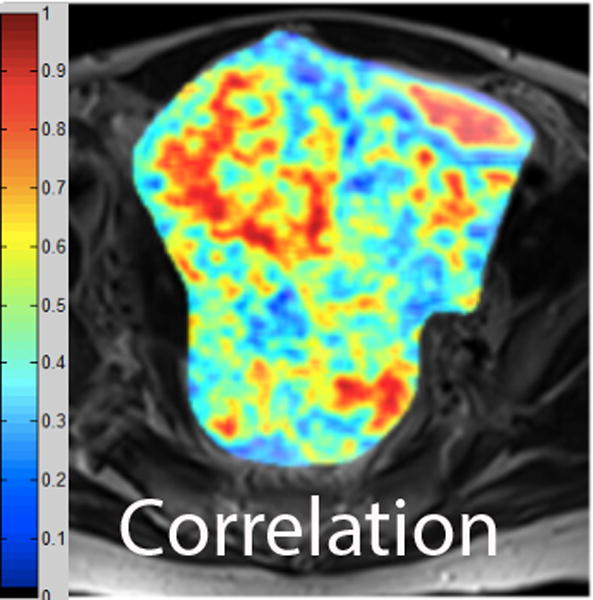
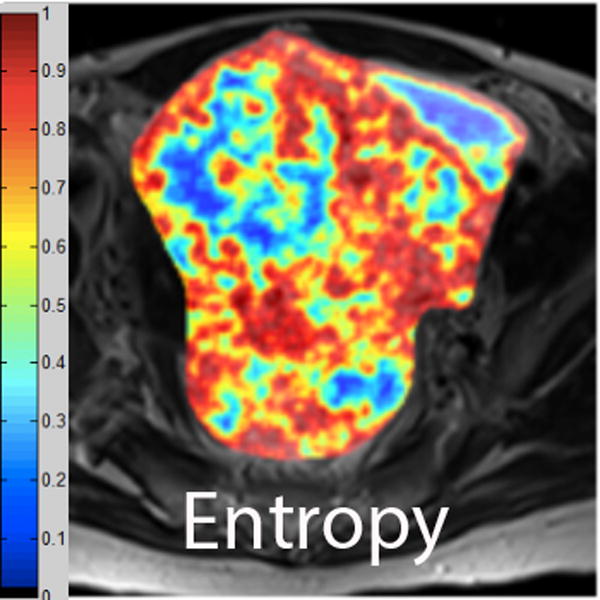
A. Axial T2-weighted image illustrates LMS. B - F. Illustration of the intensity-based texture features (energy, contrast, homogeneity, correlation, and entropy) overlaid on the axial T2-weighted image.
Texture feature selection and self-tuning spectral clustering
First, differences in texture features between LMS and ALM were assessed using the Wilcoxon signed-rank test. P-values were adjusted using Bonferroni correction to correct for the 21 comparisons.
Sixteen texture features that differed significantly between the two groups were selected for further analysis with self-tuning spectral clustering, a form of unsupervised clustering [31]. Making no assumptions regarding the form of data clusters, self-tuning spectral clustering separates the data into distinct groups using eigen decomposition of the affinity matrix. The self-tuning approach automatically identifies the ideal number of data clusters by analyzing the eigen vectors of the affinity matrix (Supplementary Materials).
Following the clustering, cluster labels from all ROIs belonging to the same lesion were pooled together and each lesion was assigned a cluster label using a majority-voting approach. For example, if a lesion had 20 ROIs with cluster label 1 and 5 ROIs with cluster label 2, the final lesion label was cluster 1.
We repeated the above process of unsupervised clustering with only intensity image-based texture features (6/16) and only Gabor edge image-based texture features (10/16) to compare the performance of various sets of texture features (intensity image-based, Gabor edge image-based or both).
Statistical Analysis
Continuous variables were summarized with means and ranges; categorical variables were described with frequencies and percentages. Relationships between clinical characteristics, pathologic findings, and LMS were assessed with the Wilcoxon rank-sum test for continuous variables and Fisher's exact test for categorical variables. The associations between qualitative MR features and LMS were evaluated with the Fisher's exact test. Four MRI features—nodular borders, haemorrhage, “T2 dark” areas, and central unenhanced areas—had the strongest statistical associations with LMS for both readers (i.e. lowest p-values) and were therefore included in further analysis. Multivariate logistic regression analysis was not possible since reliable parameter estimates could not be calculated because of the relatively small number of patients with LMS.
For each lesion, a qualitative MR feature score was determined by counting how many of the 4 most significant features (mentioned above) were present in the lesion. For each reader, diagnostic accuracy measures with exact 95% CI were calculated using the presence of ≥1, ≥2, ≥3, and 4 features in a lesion as different cut-offs for diagnosing LMS.
Inter-reader agreement was assessed with the Cohen's kappa (k) and interpreted as follows: 1) 0-0.20, slight agreement; 2) 0.21-0.40, fair agreement; 3) 0.41-0.60, moderate agreement; 4) 0.61-0.80, substantial agreement; and 5) 0.81-1.00 almost perfect agreement [32]. P values less than 0.05 were considered statistically significant. All statistical analyses were performed using SAS 9.4 (SAS Institute, Cary, NC).
Results
Patients
Patient and lesion characteristics are summarized in Table 1. Patients with ALM were younger than those with LMS (p=0.0068). Median tumour diameters at histopathology were similar (p=0.12) between patients with ALM (median: 9.25 cm, range: 2.0-20.4 cm) and LMS (median: 11.4 cm, range: 7.0-20.0 cm). Most common symptoms leading to MRI examinations were lower abdominal pain/pressure (17/41, 41.5%), dysmenorrhea/ menorrhagia (11/41, 27%), or both of the above (4/41, 10%).
Table 1. Patient and lesion characteristics.
| ALM (N=22) Median (Range or %) |
LMS (N=19) Median (Range or %) |
p-value | |
|---|---|---|---|
|
| |||
| Median patient age (years) | 40.1 (16.4-71.4) | 51.3 (34.6-91.6) | 0.0068 |
|
| |||
| Median histopathologic tumour size (cm) | 9.25 (2.0-20.4) | 11.4 (7.0-20.0) | 0.12 |
|
| |||
| Histology | 22/41 (53.7) | 19/41 (46.3) | NA |
|
| |||
| Histopathologic diagnosis of ALM: | NA | NA | |
| • Cellular leiomyomas | 4/22 (18.2) | ||
| • Leiomyoma with unusual features | 1/22 (4.5) | ||
| • “Atypical” leiomyomas | 2/22 (9.1) | ||
| • Intravenous leiomyomatosis | 1/22 (4.5) | ||
| • Leiomyoma with hydropic changes | 1/22 (4.5) | ||
| • Leiomyomas with edematous changes or various forms of degenerationa | 7/22 (32) | ||
| • Leiomyoma with histological features suggestive of Hereditary Leiomyomatosis and Renal Cell carcinoma Syndromea | 1/22 (4.5) | ||
| • Leiomyomasa | 5/22 (22.7) | ||
|
| |||
| Surgery type: | 0.0014 | ||
| Myomectomy | 10 (45.5) | 0 | |
| Hysterectomy | 12 (54.5) | 19 (100) | |
|
| |||
| Days between MRI and surgery | 31.5 (6.0-168.0) | 20.0 (1.0-131.0) | 0.0134 |
|
| |||
| MR scanner strength: | 0.42 | ||
| 1.5 Tesla | 17 (77.3) | 17 (89.5) | |
| 3.0 Tesla | 5 (22.7) | 2 (10.5) | |
Note: ALM atypical leiomyoma, LMS leiomyosarcoma, MRI magnetic resonance imaging, MR magnetic resonance
Included because interpreted as unusual/atypical myometrial mass in the official preoperative MRI report
Qualitative MR Imaging Features
As shown in Table 2, for both readers, the following seven qualitative MRI features were observed significantly more frequently in LMS than in ALM: 1) nodular borders (p≤0.0001), 2) intra-lesional haemorrhage (p<0.0001), 3) “T2 dark” area(s) (p<0.0001), 4) flow voids (p≤0.0041), 5) unenhanced area(s) (p≤0.0041), 6) heterogeneity on contrast-enhanced images (p=0.0041), and 7) central unenhanced area(s) (p<0.0001). For both readers, four of the above 7 features (presence of nodular borders, intra-lesional haemorrhage, “T2 dark” area(s), and central unenhanced area(s) demonstrated the strongest statistical association with LMS (p≤0.0001 each feature and reader).
Table 2. All qualitative MR features and their associations with LMS.
| Qualitative MR features | Reader 1 | Reader 2 | |||||
|---|---|---|---|---|---|---|---|
| ALM (N=22) N (%) | LMS (N=19) N (%) | p-value | ALM (N=22) N (%) | LMS (N=19) N (%) | p-value | ||
| Pelvic fluid | Absent | 14 (63.6) | 10 (52.6) | 0.54 | 16 (72.7) | 10 (52.6) | 0.21 |
| Present | 8 (36.4) | 9 (47.4) | 6 (27.3) | 9 (47.4) | |||
| Borders | Smooth | 20 (90.9) | 3 (15.8) | <0.0001 | 19 (86.4) | 5 (26.3) | 0.0001 |
| Nodular | 2 (9.1) | 16 (84.2) | 3 (13.6) | 14 (73.7) | |||
| Haemorrhage | Absent | 18 (81.8) | 1 (5.3) | <0.0001 | 21 (95.5) | 0 (0.0) | <0.0001 |
| Present | 4 (18.2) | 18 (94.7) | 1 (4.5) | 19 (100.0) | |||
| Signal intensity on T2WIa | Hypointense | 4 (18.2) | 1 (5.3) | 0.34 | 6 (27.3) | 1 (5.3) | 0.17 |
| Isointense | 11 (50.0) | 8 (42.1) | 10 (45.5) | 10 (52.6) | |||
| Hyperintense | 7 (31.8) | 10 (52.6) | 6 (27.3) | 8 (42.1) | |||
| Heterogeneity on T2WI | Homogenous | 6 (27.3) | 1 (5.3) | 0.10 | 5 (22.7) | 0 (0.0) | 0.05 |
| Heterogeneous | 16 (72.7) | 18 (94.7) | 17 (77.3) | 19 (100.0) | |||
| Cystic alteration(s) | Absent | 10 (45.5) | 3 (15.8) | 0.05 | 8 (36.4) | 2 (10.5) | 0.08 |
| Present | 12 (54.5) | 16 (84.2) | 14(63.6) | 17 (89.5) | |||
| Location of cystic alteration(s) | None | 10 (45.5) | 3 (15.8) | 0.32 | 8 (36.4) | 2 (10.5) | 0.17 |
| Peripheral | 6 (27.3) | 4 (21.1) | 6 (27.3) | 3 (15.8) | |||
| Central | 2 (9.1) | 6 (31.6) | 1 (4.5) | 5 (26.3) | |||
| Central + peripheral | 4 (18.2) | 6 (31.6) | 7 (31.8) | 9 (47.4) | |||
| Fluid-fluid level(s) | Absent | 21 (95.5) | 16 (84.2) | 0.32 | 21 (95.5) | 16 (84.2) | 0.32 |
| Present | 1 (4.5) | 3 (15.8) | 1 (4.5) | 3 (15.8) | |||
| “T2 dark” area(s) | Absent | 19 (86.4) | 3 (15.8) | <0.0001 | 19 (86.4) | 4 (21.1) | <0.0001 |
| Present | 3 (13.6) | 16 (84.2) | 3 (13.6) | 15 (78.9) | |||
| Flow voids | Absent | 8 (36.4) | 0 (0.0) | 0.0041 | 11 (50.0) | 0 (0.0) | 0.0002 |
| Present | 14 (63.6) | 19 (100.0) | 11 (50.0) | 19 (100.0) | |||
| Signal intensity on contrasted imagesβ | Hypointense | 4 (18.2) | 8 (42.1) | 0.28 | 5 (22.7) | 9 (47.4) | 0.14 |
| Isointense | 15 (68.2) | 10 (52.6) | 15 (68.2) | 10 (52.6) | |||
| Hyperintense | 3 (13.6) | 1 (5.3) | 2 (9.1) | 0 (0.0) | |||
| Heterogeneity on contrasted images | Homogenous | 8 (36.4) | 0 (0.0) | 0.0041 | 8 (36.4) | 0 (0.0) | 0.0041 |
| Heterogeneous | 14 (63.6) | 19 (100.0) | 14 (63.6) | 19 (100.0) | |||
| Unenhanced area(s) | Absent | 9 (40.9) | 0 (0.0) | 0.0017 | 8 (36.4) | 0 (0.0) | 0.0041 |
| Present | 13 (59.1) | 19 (100.0) | 14 (63.6) | 19 (100.0) | |||
| Location of unenhanced area(s) | None or Non-central | 16(72.7) | 1 (5.3) | <0.0001 | 15 (68.2) | 0 (0.0) | <0.0001 |
| Central | 6 (27.3) | 18 (94.7) | 7 (31.8) | 19 (10.0) | |||
Note: ALM atypical leiomyoma, LMS leiomyosarcoma, T2WI T2-weighted image
Relative to the outer myometrium
Relative to the myometrium
For both readers, pelvic fluid, lesional SI and heterogeneity on T2WI, intra-lesional cystic alterations and their location, intra-lesional fluid-fluid levels, and lesional SI on contrast-enhanced images did not differ significantly between LMS and ALM (p-value range: 0.05-0.54). No patients had peritoneal implants or lymphadenopathy.
Diagnostic accuracy measures for the four most significant MR features (lesion borders, haemorrhage, “T2 dark” area(s), and location of unenhanced area(s)) are summarized in Table 3. When the presence of ≥3 of the 4 most significant MR features was used to diagnose LMS, the highest combined sensitivities (R1/R2: 1.00[95%CI:0.82-1.00]/0.95[95%CI:0.74-1.00]) and specificities (R1/R2:0.95 [95%CI:0.77-1.00]/1.00[95%CI:0.85-1.00]) were observed (Table 4).
Table 3. Diagnostic accuracy measures for each of the four qualitative MR features that had the strongest statistical associations with LMS.
| Qualitative MR features | Reader | Sensitivity [95%CI; N] | Specificity [95%CI; N] | PPV [95%CI; N] | NPV [95%CI; N] | Accuracy [95% CI; N] |
|---|---|---|---|---|---|---|
| Borders | 1 | 0.84 [0.6-0.97;16/19] | 0.91 [0.71-0.99;20/22] | 0.89 [0.65-0.99;16/18] | 0.87 [0.66-0.97;20/23] | 0.88 [0.74-0.96;36/41] |
| 2 | 0.74 [0.49-0.91;14/19] | 0.86 [0.65-0.97;19/22] | 0.82 [0.57-0.96;14/17] | 0.79 [0.58-0.93;19/24] | 0.80 [0.65-0.91;33/41] | |
| Haemorrhage | 1 | 0.95 [0.74-1.00;18/19] | 0.82 [0.60-0.95;18/22] | 0.82 [0.60-0.95;18/22] | 0.95 [0.74-1.00;18/19] | 0.88 [0.74-0.96;36/41] |
| 2 | 1.00 [0.82-1.00;19/19] | 0.95 [0.77-1.00;21/22] | 0.95 [0.75-1.00;19/20] | 1.00 [0.84-1.00;21/21] | 0.98 [0.87-1.00;40/41] | |
| “T2 dark” area(s) | 1 | 0.84 [0.60-0.97;16/19] | 0.86 [0.65-0.97;19/22] | 0.84 [0.60-0.97;16/19] | 0.86 [0.65-0.97;19/22] | 0.85 [0.71-0.94;35/41] |
| 2 | 0.79 [0.54-0.94;15/19] | 0.86 [0.65-0.97;19/22] | 0.83 [0.59-0.96;15/18] | 0.83 [0.61-0.95;19/23] | 0.83 [0.68-0.93;34/41] | |
| Location of unenhanced area(s) | 1 | 0.95 [0.74-1.00;18/19] | 0.73 [0.50-0.89;16/22] | 0.75 [0.53-0.9;18/24] | 0.94 [0.71-1.00;16/17] | 0.83 [0.68-0.93;34/41] |
| 2 | 1.00 [0.82-1.00;19/19] | 0.68 [0.45-0.86;15/22] | 0.73 [0.52-0.88;19/26] | 1.00 [0.78-1.00;15/15] | 0.83 [0.68-0.93;34/41] |
Note: PPV positive predictive value, NPV negative predictive value, CI confidence interval
Table 4. Diagnostic accuracy measures for diagnosing LMS using different criterions to signify LMS.
| Number of MR features present in a lesion | Reader | Sensitivity [95%CI; N] | Specificity [95%CI; N] | PPV [95%CI; N] | NPV [95%CI; N] | Accuracy [95% CI; N] |
|---|---|---|---|---|---|---|
| ≥1 feature | 1 | 1.00 [0.82-1.00;19/19] | 0.55 [0.32-0.76;12/22] | 0.66 [0.46-0.82;19/29] | 1.00 [0.74-1.00;12/12] | 0.76 [0.60-0.88;31/41] |
| 2 | 1.00 [0.82-1.00;19/19] | 0.59 [0.36-0.79;13/22] | 0.68 [0.48-0.84;19/28] | 1.00 [0.75-1.00;13/13] | 0.78 [0.62-0.89;32/41] | |
| ≥2 features present | 1 | 1.00 [0.82-1.00;19/19] | 0.82 [0.60-0.95;18/22] | 0.83 [0.61-0.95;19/23] | 1.00 [0.81-1.00;18/18] | 0.90 [0.77-0.97;37/41] |
| 2 | 1.00 [0.82-1.00;19/19] | 0.77 [0.55-0.92;17/22] | 0.79 [0.58-0.93;19/24] | 1.00 [0.80-1.00;17/17] | 0.88 [0.74-0.96;36/41] | |
| ≥3 features present | 1 | 1.00 [0.82-1.00;19/19] | 0.95 [0.77-1.00;21/22] | 0.95 [0.75-1.00;19/20] | 1.00 [0.84-1.00;21/21] | 0.98 [0.87-1.00;40/41] |
| 2 | 0.95 [0.74-1.00;18/19] | 1.00 [0.85-1.00;22/22] | 1.00 [0.81-1.00;18/18] | 0.96 [0.78-1.00;22/23] | 0.98 [0.87-1.00;40/41] | |
| 4 features present | 1 | 0.58 [0.33-0.80;11/19] | 1.00 [0.85-1.00;22/22] | 1.00 [0.72-1.00;11/11] | 0.73 [0.54-0.88;22/30] | 0.80 [0.65-0.91;33/41] |
| 2 | 0.58 [0.33-0.80;11/19] | 1.00 [0.85-1.00;22/22] | 1.00 [0.72-1.00;11/11] | 0.73 [0.54-0.88;22/30] | 0.80 [0.65-0.91;33/41] |
Note: MR magnetic resonance, PPV positive predictive value, NPV negative predictive value, CI confidence interval
Inter-observer Agreement
Inter-reader agreement regarding qualitative MR features was substantial to almost perfect (Table 5). In particular, agreement levels for lesion borders, haemorrhage, “T2 dark” area(s), and location of unenhanced area(s) were almost perfect (Table 5).
Table 5. Inter-reader agreement with regard to the qualitative MR features.
| Qualitative MR features | N | Kappa | 95%CI | Interpretation |
|---|---|---|---|---|
| Borders | 41 | 0.85 | 0.69-1.00 | Almost perfect |
| Haemorrhage | 41 | 0.81 | 0.62-1.00 | Almost perfect |
| Signal intensity on T2WI | 41 | 0.80 | 0.64-0.96 | Substantial |
| Heterogeneity on T2WI | 41 | 0.81 | 0.55-1.00 | Almost perfect |
| Cystic alteration(s) on T2WI | 41 | 0.82 | 0.63-1.00 | Almost perfect |
| Location of cystic alteration(s) | 28 | 0.84 | 0.67-1.00 | Almost perfect |
| Fluid-fluid level(s) | 41 | 1.00 | 1.00-1.00 | Almost perfect |
| “T2 dark” area(s) on T2WI | 41 | 0.85 | 0.69-1.00 | Almost perfect |
| Flow voids on T2WI | 41 | 0.80 | 0.58-1.00 | Substantial |
| Signal intensity on contrasted images | 41 | 0.72 | 0.52-0.93 | Substantial |
| Heterogeneity on contrasted images | 41 | 0.84 | 0.64-1.00 | Almost perfect |
| Unenhanced area(s) | 41 | 0.93 | 0.78-1.00 | Almost perfect |
| Location of unenhanced area(s) | 41 | 0.90 | 0.76-1.00 | Almost perfect |
Note: MR magnetic resonance, CI confidence interval, T2WI T2-weighted image
Quantitative Texture Features
Comparison of texture feature values
Of the 21 extracted texture features, 16 (6 intensity image-based and 10 Gabor edge image-based) features differed significantly between LMS and ALM (p-values: <0.001-0.036) (Table 6).
Table 6. Comparison of texture feature values between LMS and ALM using a Wilcoxon signed-rank test with Bonferroni correction for multiple variables.
| Texture features | LMS Median (range) | ALM Median (range) | p-value |
|---|---|---|---|
| Gabor(0,1.4)Energy | 0.04 (0.01-0.14) | 0.08 (0.01-0.38) | <0.001 |
| Gabor(0,1.4)Contrast | 1.67 (0.37-6.06) | 0.76 (0.17-7.23) | <0.001 |
| Gabor(0,1.4)Homogeneity | 0.64 (0.48-0.82) | 0.76 (0.45-0.88) | <0.001 |
| Gabor(0,1.4)Correlation | 0.68 (0.19-1) | 0.57 (0.1-1) | 0.011 |
| Gabor(0,1.4)Entropy | 0.89 (0.41-0.96) | 0.91 (0-0.98) | 0.036 |
| Gabor(0,1.4) Intensity | 131.95 (92.32-163.91) | 129.85 (101.61-162.34) | 1.000 |
| Gabor(90,1.4)Energy | 0.09 (0.02-0.36) | 0.13 (0.01-0.56) | <0.001 |
| Gabor(90,1.4)Contrast | 1.59 (0.3-5.18) | 0.87 (0.03-3.39) | <0.001 |
| Gabor(90,1.4)Homogeneity | 0.68 (0.48-0.83) | 0.74 (0.03-0.88) | <0.001 |
| Gabor(90,1.4)Correlation | 0.62 (0.16-0.99) | 0.51 (0-0.98) | 0.335 |
| Gabor(90,1.4)Entropy | 0.63 (0.42-0.78) | 0.65 (0-0.82) | 0.029 |
| Gabor(90,1.4) Intensity | 131.71 (100.36-157.39) | 136.17 (112.79-163.18) | <0.001 |
| Energy | 0.08 (0.02-0.37) | 0.15 (0.01-0.49) | <0.001 |
| Contrast | 1.62 (0.29-4.62) | 0.7 (0.01-4.7) | <0.001 |
| Homogeneity | 0.67 (0.46-0.84) | 0.77 (0.02-0.89) | <0.001 |
| Correlation | 0.6 (0.12-0.96) | 0.47 (0-0.99) | 0.002 |
| Entropy | 0.65 (0.42-0.79) | 0.66 (0-0.81) | 0.092 |
| Intensity | 79.86 (34.27-119.88) | 83.48 (20.27-129.38) | 1.000 |
| SD | 16.05 (5.62-46.84) | 10.21 (4.58-34.24) | <0.001 |
| Kurtosis | 3.23 (1.64-16.8) | 4.01 (1.71-13.9) | <0.001 |
| Skewness | -0.15 (-2.53-2.05) | -0.32 (-2.11-2.86) | 1.000 |
Note: LMS leiomyosarcoma, ALM atypical leiomyoma
In comparison to ALM, LMS were associated with higher intensity image-based and Gabor edge image-based contrast, lower energy, and lower homogeneity (p<0.001 for each feature); furthermore, LMS had higher SD and lower kurtosis (p<0.001 for both features), indicative of less peaked and more variable distribution of intensities. Taken together, these findings all suggested greater textural heterogeneity of LMS.
Interestingly, LMS demonstrated lower Gabor edge image-based entropy compared to ALM (p-values: 0.029-0.036). Intensity-based entropy did not differ significantly between ALM and LMS (p=0.092).
Self-tuning spectral clustering
Self-tuning spectral clustering selected the ideal number of clusters by identifying the cluster groupings with the least cost. The cost measures for various data groupings were 1.04, 1.09, 1.03, and 1.07 for 2, 3, 4 and 5 clusters, respectively. Therefore, four clusters (1 ALM and 3 LMS clusters) were selected (Figure 4). Self-tuning spectral clustering grouped the lesions with accuracy of 0.75, sensitivity of 0.70 (95%CI:0.35-0.93, 7/10 LMS), and specificity of 0.79 (95%CI:0.39-0.95, 11/14 ALM).
Figure 4.
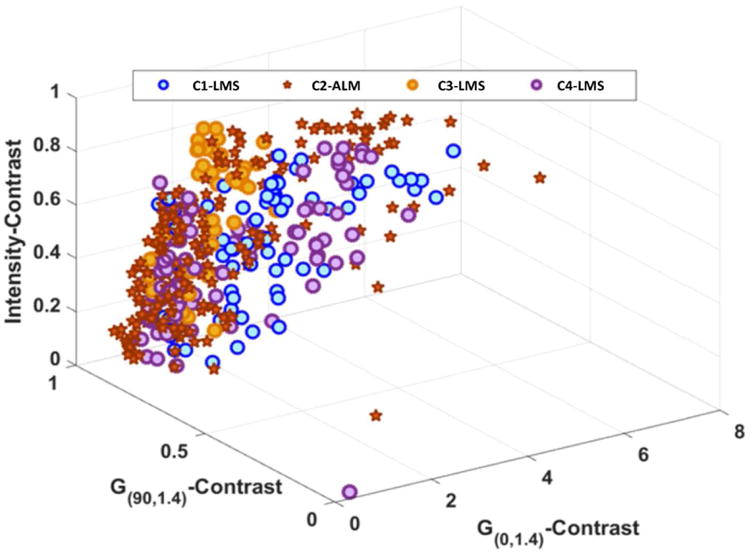
A plot demonstrating the results of self-tuning spectral clustering. To facilitate the ease of illustration, only three of 16 texture features with statistically significant difference between LMS and ALM were used to generate this figure. Self-tuning spectral clustering identified a total of four distinct data clusters (C1 though C4) that comprised of one ALM (star) grouping and 3 LMS (blue, orange, and purple circles) groupings.
When only intensity image-based texture features were analyzed, self-tuning spectral clustering identified 4 clusters (2 ALM and 2 LMS) and achieved accuracy of 0.71, sensitivity of 0.7 (95%CI:0.35-0.93, 7/10 LMS) and specificity of 0.71 (95%CI:0.42-0.92, 10/14 ALM). When only Gabor edge image-based texture features were included, self-tuning spectral clustering selected 4 clusters (2 ALM and 2 LMS) and categorized the lesions with accuracy of 0.58, sensitivity of 0.60 (95%CI:0.26-0.88, 6/10 LMS), and specificity of 0.57 (95%CI:0.29-0.82, 8/14 ALM).
Discussion
Accurate diagnosis of LMS is a clinical challenge. LM are much more common than LMS, and patients with these entities tend to present at similar ages and with similar clinical symptoms [33]. While rapid mass enlargement, particularly after menopause, may signify malignancy, it may also be observed with cellular or degenerating LM [33]. Furthermore, establishing the rate of tumour growth may not be possible when a large myometrial mass is discovered at the initial encounter. Serum markers such as LDH and LDH isozyme type 3 can be elevated not only with LMS but also with cellular and degenerated LM [11]. Similarly, CA-125 levels may overlap between LM and early-stage LMS [33; 34].
Our study first examined the ability of qualitative MRI features to differentiate LMS from atypical LM (ALM). The four qualitative MR features that had the strongest statistical associations with LMS—nodular borders, haemorrhage, “T2 dark” area(s), and central unenhanced area(s)—were reproducible between the two readers and accurately distinguished LMS from ALM. When the presence of ≥3 of these 4 features in a lesion was used as the criterion to diagnose LMS, the highest combined sensitivities (range: 95-100%) and specificities (range: 95-100%) were achieved. If externally validated, our results may help gynaecologic surgeons to better plan their surgical approaches and counsel women presenting for management of presumed leiomyomas.
Similarly to Sahdev et al., Schwartz et al. and Tanaka et al., we found that LMS appeared as large masses with ill-defined/nodular (rather than smooth) borders, heterogeneous iso-hyperintensity on T2WI, intralesional haemorrhage, and unenhanced areas on contrast-enhanced images [9; 10; 12]. Assuming that a combination of T1 and T2 hyperintensity and unenhanced areas signified malignancy, Tanaka et al. achieved moderate sensitivity (73%) and high specificity (100%) in differentiating benign and malignant smooth muscle tumours [12]. We attained higher sensitivity (95-100%) and similarly high specificity (95-100%) for distinguishing LMS from ALM by using the presence of ≥ 3 features to diagnose LMS.
Our findings contrast with those of Cornfield et al., who studied 17 ALM and 9 malignant mesenchymal tumours (4 LMS, 2 STUMP, 2 endometrial stromal sarcoma [ESS], 1 mixed ESS and smooth muscle tumour) and were unable to distinguish between these two groups of lesions using qualitative MR features [16]. Although they found the presence of ill-defined borders and reader “gestalt” (i.e., overall impression) to have the highest sensitivity and specificity, sensitivity was moderate at best (44-56%). However, their study neither evaluated the location of unenhanced areas nor examined MR features other than lesion hyperintensity on T2WI.
Our study found high inter-observer agreement; however, it was based on the comparison of two readers from the same institution with similar levels of sub-specialty training and a common exposure to a large volume of gynaecologic oncologic examinations at a tertiary care cancer centre. It is possible that different results would have been obtained with other readers.
The second part of our study evaluated texture analysis (TA), where the only user activity was manual lesion segmentation. In comparison to ALM, LMS were associated with higher contrast and SD but lower energy, homogeneity, and kurtosis. These results indicate that LMS were more texturally heterogeneous than were ALM. Although higher entropy is typically associated with more heterogeneous tumours, we found Gabor edge imaged-based entropy of LMS to be lower than that of ALM. Furthermore, intensity image-based entropy did not differ significantly between LMS and ALM. The small differences in entropy we found may be explained by the fact that we focused on ALM rather than typically homogenous, T2-hypointense classic LM.
We computed both intensity image-based and Gabor edge image-based texture features because we hypothesized that Gabor filters, with their superior edge detection properties, might be more sensitive to the inter-group differences in lesion borders, frequency of intralesional haemorrhage, and presence/location of necrosis. Using unsupervised clustering, we found that a combination of intensity-based and Gabor edge image-based texture features yielded the highest accuracy of 0.75, while Gabor edge image-based texture features alone had the lowest accuracy 0.58. Thus, while edge-based texture features alone were insufficient to accurately capture the textural differences between LMS and ALM, the addition of edge-based to intensity-based texture features improved lesion categorization.
Our study had several limitations. First, it was retrospective, and we only included patients with surgically resected tumours and preoperative MR imaging, introducing a selection bias. This was necessary to ensure accurate image-pathology correlation. Second, only LMS and ALM were evaluated that makes our conclusions less applicable to a broader patient population with various myometrial masses. This was intentional and justifiable given characteristic imaging features of typical LM and the limited data on the ability of MRI to distinguish LMS from ALM. Third, our cohort lacked STUMP. Forth, we were unable to retrospectively correlate qualitative MRI findings to histopathologic findings on a per-feature-basis secondary to the lack of histopathologic whole-tumour step-section tumour maps. Fifth, we could not perform multivariate logistic regression analysis for the selection of qualitative MR features because of the small sample size. Sixth, we were unable to assess the role of diffusion-weighted imaging (DWI) because few MRIs (13/41, 32%) included it. Furthermore, available studies with DWI could not be compared meaningfully due to differences in acquisition parameters and scanner manufactures. Seventh, the acquisition parameters were relatively heterogeneous between the scans since many studies were performed elsewhere. As uniform acquisition parameters are required for radiomics and machine learning methods, a number of patients were excluded from texture analysis. Only T2WI were used for TA because of their robustness and least variation in acquisition parameters. We anticipate that the performance of TA may improve with the inclusion of textural information from additional sequences such as DWI and contrast-enhanced images. Lastly, a larger sample size and a distinct validation set are required to determine the efficacy of supervised machine learning for differentiating LMS from ALM. While TA has the potential to assist in the differentiation of tumours in the daily clinical practice, this would require the development of user-friendly tools for robust automated lesion segmentation and efficient extraction of texture features.
In summary, we identified four qualitative MRI features that had the strongest statistical association with LMS and found that the presence of ≥3 of them could accurately distinguish LMS from ALM; in addition, we found texture analysis to be a feasible semi-automated approach for lesion categorization. Future studies are needed to externally validate our results and to further evaluate the ability of machine learning techniques to correctly classify LMS and ALM.
Supplementary Material
Key Points.
Four qualitative MR features demonstrated the strongest statistical association with LMS.
Combination of ≥3 these features could accurately differentiate LMS from ALM.
Texture analysis was a feasible semi-automated approach for lesion categorization.
Acknowledgments
The scientific guarantor of this publication is Yulia Lakhman MD. The authors of this manuscript declare no relationships with any companies, whose products or services may be related to the subject matter of the article. The authors state that this research was funded in part through the NIH/NCI Cancer Center Support Grant P30 CA008748. Two of the authors have significant statistical expertise. Institutional Review Board approval was obtained. Written informed consent was waived by the Institutional Review Board. No study subjects or cohorts have been previously reported. Methodology: retrospective, cross-sectional study, performed at one institution. Authors thank Ada Muellner M.S. and Joanne Chin M.F.A. for their editorial assistance with the manuscript.
Abbreviations and Acronyms
- ALM
atypical leiomyoma
- BW
bandwidth
- CI
Confidence interval
- DWI
Diffusion-weighted imaging
- FOV
field of view
- GLCM
gray-level co-occurrence matrices
- HIPAA
Health Insurance Portability and Accountability Act
- LM
uterine leiomyomas
- LMS
leiomyosarcoma
- MR
magnetic resonance
- MRI
Magnetic resonance imaging
- NPV
negative predictive value
- PPV
positive predictive value
- ROIs
regions of interest
- SI
signal-intensity
- ST
section thickness
- T2WI
T2-weighted image
- TA
texture analysis
References
- 1.Ryan GL, Syrop CH, Van Voorhis BJ. Role, epidemiology, and natural history of benign uterine mass lesions. Clin Obstet Gynecol. 2005;48:312–324. doi: 10.1097/01.grf.0000159538.27221.8c. [DOI] [PubMed] [Google Scholar]
- 2.Wallach EE, Vlahos NF. Uterine myomas: an overview of development, clinical features, and management. Obstet Gynecol. 2004;104:393–406. doi: 10.1097/01.AOG.0000136079.62513.39. [DOI] [PubMed] [Google Scholar]
- 3.Owen C, Armstrong AY. Clinical management of leiomyoma. Obstet Gynecol Clin North Am. 2015;42:67–85. doi: 10.1016/j.ogc.2014.09.009. [DOI] [PubMed] [Google Scholar]
- 4.Wu TI, Yen TC, Lai CH. Clinical presentation and diagnosis of uterine sarcoma, including imaging. Best Pract Res Clin Obstet Gynaecol. 2011;25:681–689. doi: 10.1016/j.bpobgyn.2011.07.002. [DOI] [PubMed] [Google Scholar]
- 5.D'Angelo E, Prat J. Uterine sarcomas: a review. Gynecol Oncol. 2010;116:131–139. doi: 10.1016/j.ygyno.2009.09.023. [DOI] [PubMed] [Google Scholar]
- 6.Santos P, Cunha TM. Uterine sarcomas: clinical presentation and MRI features. Diagn Interv Radiol. 2015;21:4–9. doi: 10.5152/dir.2014.14053. [DOI] [PMC free article] [PubMed] [Google Scholar]
- 7.Hricak H, Tscholakoff D, Heinrichs L, et al. Uterine leiomyomas: correlation of MR, histopathologic findings, and symptoms. Radiology. 1986;158:385–391. doi: 10.1148/radiology.158.2.3753623. [DOI] [PubMed] [Google Scholar]
- 8.Ueda H, Togashi K, Konishi I, et al. Unusual appearances of uterine leiomyomas: MR imaging findings and their histopathologic backgrounds. Radiographics. 1999;19 doi: 10.1148/radiographics.19.suppl_1.g99oc04s131. Spec No:S131-145. [DOI] [PubMed] [Google Scholar]
- 9.Schwartz LB, Zawin M, Carcangiu ML, Lange R, McCarthy S. Does pelvic magnetic resonance imaging differentiate among the histologic subtypes of uterine leiomyomata? Fertil Steril. 1998;70:580–587. doi: 10.1016/s0015-0282(98)00193-9. [DOI] [PubMed] [Google Scholar]
- 10.Sahdev A, Sohaib SA, Jacobs I, Shepherd JH, Oram DH, Reznek RH. MR imaging of uterine sarcomas. AJR Am J Roentgenol. 2001;177:1307–1311. doi: 10.2214/ajr.177.6.1771307. [DOI] [PubMed] [Google Scholar]
- 11.Goto A, Takeuchi S, Sugimura K, Maruo T. Usefulness of Gd-DTPA contrast-enhanced dynamic MRI and serum determination of LDH and its isozymes in the differential diagnosis of leiomyosarcoma from degenerated leiomyoma of the uterus. Int J Gynecol Cancer. 2002;12:354–361. doi: 10.1046/j.1525-1438.2002.01086.x. [DOI] [PubMed] [Google Scholar]
- 12.Tanaka YO, Nishida M, Tsunoda H, Okamoto Y, Yoshikawa H. Smooth muscle tumors of uncertain malignant potential and leiomyosarcomas of the uterus: MR findings. J Magn Reson Imaging. 2004;20:998–1007. doi: 10.1002/jmri.20207. [DOI] [PubMed] [Google Scholar]
- 13.Tamai K, Koyama T, Saga T, et al. The utility of diffusion-weighted MR imaging for differentiating uterine sarcomas from benign leiomyomas. Eur Radiol. 2008;18:723–730. doi: 10.1007/s00330-007-0787-7. [DOI] [PubMed] [Google Scholar]
- 14.Namimoto T, Yamashita Y, Awai K, et al. Combined use of T2-weighted and diffusion-weighted 3-T MR imaging for differentiating uterine sarcomas from benign leiomyomas. Eur Radiol. 2009;19:2756–2764. doi: 10.1007/s00330-009-1471-x. [DOI] [PubMed] [Google Scholar]
- 15.Thomassin-Naggara I, Dechoux S, Bonneau C, et al. How to differentiate benign from malignant myometrial tumours using MR imaging. Eur Radiol. 2013;23:2306–2314. doi: 10.1007/s00330-013-2819-9. [DOI] [PubMed] [Google Scholar]
- 16.Cornfeld D, Israel G, Martel M, Weinreb J, Schwartz P, McCarthy S. MRI appearance of mesenchymal tumors of the uterus. Eur J Radiol. 2010;74:241–249. doi: 10.1016/j.ejrad.2009.03.005. [DOI] [PubMed] [Google Scholar]
- 17.Tasaki A, Asatani MO, Umezu H, et al. Differential diagnosis of uterine smooth muscle tumors using diffusion-weighted imaging: correlations with the apparent diffusion coefficient and cell density. Abdom Imaging. 2015;40:1742–1752. doi: 10.1007/s00261-014-0324-5. [DOI] [PubMed] [Google Scholar]
- 18.Nagai T, Takai Y, Akahori T, et al. Highly improved accuracy of the revised PREoperative sarcoma score (rPRESS) in the decision of performing surgery for patients presenting with a uterine mass. Springerplus. 2015;4:520. doi: 10.1186/s40064-015-1318-7. [DOI] [PMC free article] [PubMed] [Google Scholar]
- 19.Raman SP, Chen Y, Schroeder JL, Huang P, Fishman EK. CT texture analysis of renal masses: pilot study using random forest classification for prediction of pathology. Acad Radiol. 2014;21:1587–1596. doi: 10.1016/j.acra.2014.07.023. [DOI] [PMC free article] [PubMed] [Google Scholar]
- 20.Raman SP, Schroeder JL, Huang P, et al. Preliminary data using computed tomography texture analysis for the classification of hypervascular liver lesions: generation of a predictive model on the basis of quantitative spatial frequency measurements--a work in progress. J Comput Assist Tomogr. 2015;39:383–395. doi: 10.1097/RCT.0000000000000217. [DOI] [PubMed] [Google Scholar]
- 21.Yan L, Liu Z, Wang G, et al. Angiomyolipoma with minimal fat: differentiation from clear cell renal cell carcinoma and papillary renal cell carcinoma by texture analysis on CT images. Acad Radiol. 2015;22:1115–1121. doi: 10.1016/j.acra.2015.04.004. [DOI] [PubMed] [Google Scholar]
- 22.Hodgdon T, McInnes MD, Schieda N, Flood TA, Lamb L, Thornhill RE. Can Quantitative CT Texture Analysis be Used to Differentiate Fat-poor Renal Angiomyolipoma from Renal Cell Carcinoma on Unenhanced CT Images? Radiology. 2015;276:787–796. doi: 10.1148/radiol.2015142215. [DOI] [PubMed] [Google Scholar]
- 23.Wibmer A, Hricak H, Gondo T, et al. Haralick texture analysis of prostate MRI: utility for differentiating non-cancerous prostate from prostate cancer and differentiating prostate cancers with different Gleason scores. Eur Radiol. 2015;25:2840–2850. doi: 10.1007/s00330-015-3701-8. [DOI] [PMC free article] [PubMed] [Google Scholar]
- 24.Bell SW, Kempson RL, Hendrickson MR. Problematic uterine smooth muscle neoplasms. A clinicopathologic study of 213 cases. Am J Surg Pathol. 1994;18:535–558. [PubMed] [Google Scholar]
- 25.Tavassoli FA, Devilee P International Agency for Research on C, World Health O. Pathology and genetics of tumours of the breast and female genital organs. IAPS Press; Lyon: 2003. [Google Scholar]
- 26.Yoo TS, Ackerman MJ, Lorensen WE, et al. Engineering and algorithm design for an image processing Api: a technical report on ITK--the Insight Toolkit. Stud Health Technol Inform. 2002;85:586–592. [PubMed] [Google Scholar]
- 27.Nyul LG, Udupa JK, Zhang X. New variants of a method of MRI scale standardization. IEEE Trans Med Imaging. 2000;19:143–150. doi: 10.1109/42.836373. [DOI] [PubMed] [Google Scholar]
- 28.Daugman JG. Uncertainty relation for resolution in space, spatial frequency, and orientation optimized by two-dimensional visual cortical filters. J Opt Soc Am A. 1985;2:1160–1169. doi: 10.1364/josaa.2.001160. [DOI] [PubMed] [Google Scholar]
- 29.Haralick RM, Shanmuga K, Dinstein I. Textural features for image classification. Ieee Transactions on Systems Man and Cybernetics. 1973;SMC3:610–621. [Google Scholar]
- 30.Conners RW, Trivedi MM, Harlow CA. Segmentation of a high-resolution urban scene using texture operators. Computer Vision Graphics and Image Processing. 1984;25:273–310. [Google Scholar]
- 31.Zelnik-Manor L, P P. Self-tuning spectral clustering. Advances in Neural Information Processing Systems. 2005;17:1601–1608. [Google Scholar]
- 32.Landis JR, Koch GG. The measurement of observer agreement for categorical data. Biometrics. 1977;33:159–174. [PubMed] [Google Scholar]
- 33.Brolmann H, Tanos V, Grimbizis G, et al. Options on fibroid morcellation: a literature review. Gynecol Surg. 2015;12:3–15. doi: 10.1007/s10397-015-0878-4. [DOI] [PMC free article] [PubMed] [Google Scholar]
- 34.Juang CM, Yen MS, Horng HC, Twu NF, Yu HC, Hsu WL. Potential role of preoperative serum CA125 for the differential diagnosis between uterine leiomyoma and uterine leiomyosarcoma. Eur J Gynaecol Oncol. 2006;27:370–374. [PubMed] [Google Scholar]
Associated Data
This section collects any data citations, data availability statements, or supplementary materials included in this article.


