

Abstract
Thermal injury to skin and subcutaneous tissue is common in both civilian and combat scenarios. Understanding the change in tissue morphologies and properties and the underlying mechanisms of thermal injury are of vital importance to clinical determination of the degree of burn and treatment approach. This review aims at summarizing the research involving experimental and numerical studies of skin and subcutaneous tissue subjected to thermal injury. The review consists of two parts. The first part deals with experimental studies including burn protocols and prevailing imaging approaches. The second part deals with existing numerical models for burn injuries of tissue and related computational simulations. Based on this review, we conclude that though there is literature contributing to the knowledge of the pathology and pathogenesis of tissue burn, there is scant quantitative information regarding changes in tissue properties including mechanical, thermal, electrical and optical properties as a result of burn injuries that are linked to altered tissue morphology.
Keywords: Review, soft tissue burns, thermal injury mechanisms, burn injury imaging, burning experiment protocols, thermal injury simulations
Introduction
Burns are one of the most common injuries in both civilian combat scenarios. In the United States, there are over 1 million burn injury victims every year that need medical attention, reported by Center for Disease Control (CDC) [1]. Severe burns can lead to disability or even mortality, due to subsequent complications and infection. Numerous treatment efforts, such as early excision and skin grafting, have emerged to reduce the mortality rate of burn victims, and to shorten their time of hospitalization.
Proper treatments largely rely on a prompt and accurate diagnosis of burn depth. To classify different burn depths as well as the related outcomes, three levels of burn injury are widely adopted. These are superficial (first degree), superficial partial and deep partial thickness/dermal (second degree), and full thickness burns (third degree or above), shown in Fig. 1. While first degree and superficial second degree burns usually heal within 3 weeks, for which conventional treatment may be sufficient, deep second and third degree burns that do not heal within 3 weeks have a high risk of developing hypertrophic scars, for which early surgical intervention is recommended [2]. The assessment of the burn depth, however, is problematic, due to the complexity of the dynamic changes that occur to the cellular and parenchymal elements of skin post-burn [3]. In many prior works it is reported that the clinical assessment of burn depth only has 50%–80% accuracy [4] [5] [6], even performed by experienced burn surgeons. Hence it is of vital importance to carry out studies that improve the understanding of burnt tissue so that early diagnosis of burn injuries could be facilitated.
Fig. 1.
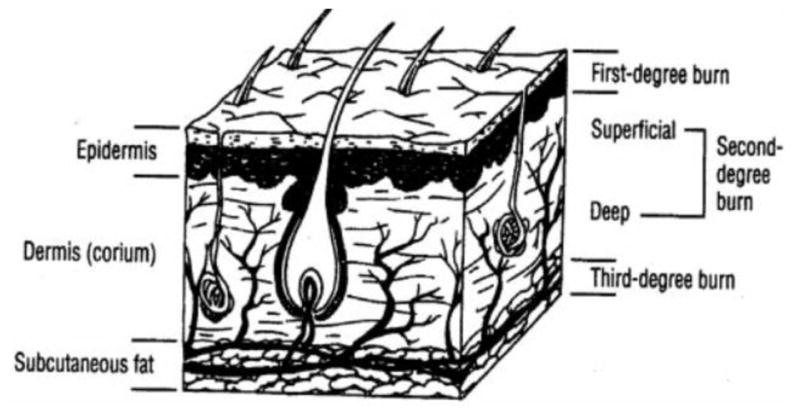
Diagram for skin anatomy showing different degrees of burns, adopted with permission from [12].
This review aims at summarizing research work involving experimental and numerical studies of skin and subcutaneous tissue subjected to thermal injury. It consists of two parts: part I reviews experimental studies while part II covers the numerical studies. Under part I there are three sections. In the first section we briefly introduce the structure of the skin and subcutaneous tissue and their properties in order to provide readers a general understanding. In the second section we summarize prevailing imaging technique used to determine burn depth and discuss relative advantages and disadvantages of these techniques, particularly with regard to the accuracy of determining burn depth using these techniques. In the third section we summarize burning protocols presented in literature, including burning apparatus, burning time and animals used. Under part II there are four sections. In the first section we introduce the well-known Arrhenius type damage mode, which is widely used in modeling and simulation of thermal burn processes in tissue. In the subsequent sections we present the governing equations for bioheat transfer processes for Fourier type, wave type and dual phase lag type models utilized for modeling burn injuries.
Part 1. Experimental studies
1.1 Structure and properties of skin
Basic knowledge of skin anatomy and physical properties helps in burn assessment and developing experimental and numerical burn models. In this section, we will provide a brief introduction to skin structure and summarize skin properties reported in the literature.
The skin of humans and other mammals is constructed of major two layers: epidermis and dermis (Fig. 1). The subcutaneous tissue (mainly fat), which is not a part of the skin, is often included in the diagram of skin structure for completeness, because it serves as a connection between skin and the underlying muscle and bone, and in burn degree characterization, the damage may reach the subcutaneous tissue. Each layer can be further divided into sub-layers based on morphological distinctions. The epidermis, which is the outmost layer of the skin, can be subdivided into four layers: stratum corneum, stratum lucidum, stratum granulosum, and stratum germinativum [7]. However, this layer is usually very thin and contributes little to the overall mechanical response of the skin [7] [8]. Similarly, it does not contribute significantly to the thermal response when skin is subjected to thermal insult. The dermis, which is the layer below the epidermis, is thicker and can be subdivided into mainly two regions: the papillary and the reticular regions. Both these regions are composed of connective tissues. The papillary region is closer to the epidermis, while the reticular region is deeper down, containing blood vessels, roots of hair, sweat glands, sensory receptors, and an extensive network of nerves [7]. The dermis also contains dense collagen and elastin networks, which govern the bulk mechanical properties of the skin [9]. Any changes in the collagen and elastin fibers in the dermis, i.e. aging [10] or scarring [11], will result in changes in mechanical properties of the skin.
The thickness of the skin varies with anatomic position, gender, age and other factors. For example, the thinnest epidermis is (~0.05 mm) over the eyelid while the thicker (up to 1 mm) one lies over the soles of the feet. The thickest dermis is on the back. The skin of the male is generally thicker than that of the female. Skin reaches its peak thickness in middle age and gradually gets thinner as people aging, thus infants, young children or old people usually have much thinner dermal layer compared to mid-aged adults [12]. Variations in skin thicknesses result in different extents of burn damage, which is confirmed in the numerical studies in [13] [14] [15].
Properties of healthy skin are helpful in understanding burn injuries or performing related modeling/simulation. Table 1–5 provides ranges of physical, mechanical, thermal, optical and electrical properties of healthy skin collected from the literature. It is worth noting that though these quantities are often referred as a range of ‘constants’, they are functions of tissue heterogeneity as well as location in the body and are influenced by activated bio mechanisms, especially in live tissues [7]. The literature on the properties of healthy skin tissues is extensive, and will not be reviewed here.
Table 1.
Some physical properties of healthy skin
Table 5.
Electrical properties of healthy skin
| Layer | Frequency (Hz) | Conductivity (S/m) | Relative permittivity |
|---|---|---|---|
| Stratum corneum | Direct Current (DC) | 1.25×10⁻⁵ [43] | |
| 2 | 104 [43] | ||
| 104 | 0.0001[16] | 1100[16] | |
| 105 | 0.001[16] | 1005[16] | |
| 106 | 0.02[16] | 450[16] | |
|
| |||
| Lower-lying layers | Direct Current (DC) | 0.227[43] | |
| 2 | 1.2×10⁶ [43] | ||
|
| |||
| Skin as a single layer (in vivo) | 108 | 0.33–0.53[16] | 48.7–65.7[16] |
| 5×10⁸ | 0.43–0.73[16] | 32.7–47.1[16] | |
| 109 | 0.48–1.0[16] | 30.2–43.5[16] | |
|
| |||
| Skin as a single layer (in vitro) | 9.4×10⁹ | 3.06[16] | 43.5[16] |
| 1.8×10¹⁰ | 8.39[16] | 35.5[16] | |
| 2.4×10¹⁰ | 17.1[16] | 23[16] | |
1.2 Imaging modalities for burn assessment
To clinically determine the degree of burn, quantitative assessment of burn depth is necessary. Various imaging techniques and apparatus have been developed to facilitate this purpose. These include biopsy and histology, laser-Doppler techniques, thermography, vital dyes, videomicroscopy, orthogonal polarization spectral imaging (OPSI), reflectance confocal microscopy (RCM), multispectral imaging (MSI), optical coherence tomography (OCT), near infrared spectroscopy (NIRS), terahertz imaging, ultrasound, laser speckle imaging (LSI), spatial frequency domain imaging (SFDI) and photoacoustic imaging. Sometimes more than one of these techniques are combined together to assess burn depth. In this section, we will review these imaging modalities and provide a comparative assessment.
Biopsy and histology
Punch biopsy of burnt tissue followed by histological analysis is often regarded as the ‘gold standard’ of burn depth assessment, providing reference for other diagnostic modalities [44] [45]. The general procedure of biopsy and histology is stated as follows: first, the tissue of interest is excised from the subject and fixed in reagent such as formalin, to prevent it from degradation. Then, after being cleaned, dehydrated and infiltrated, it is cut into very thin sections (50nm 4μm, depending on the type of microscopy used). After that, the tissue section is stained with a reagent such as Ehrlich’s Haematoxylin and Eosin (H&E), Periodic Acid Schiff (PAS) and Masson’s trichrome, etc. Finally, the specimen is placed under microscopy and analyzed. Biopsy reflects the patency of dermal vessels, the structural integrity of interstitial and cellular proteins [45] and the collagen stainability, providing clear and straightforward information about the burnt tissue.
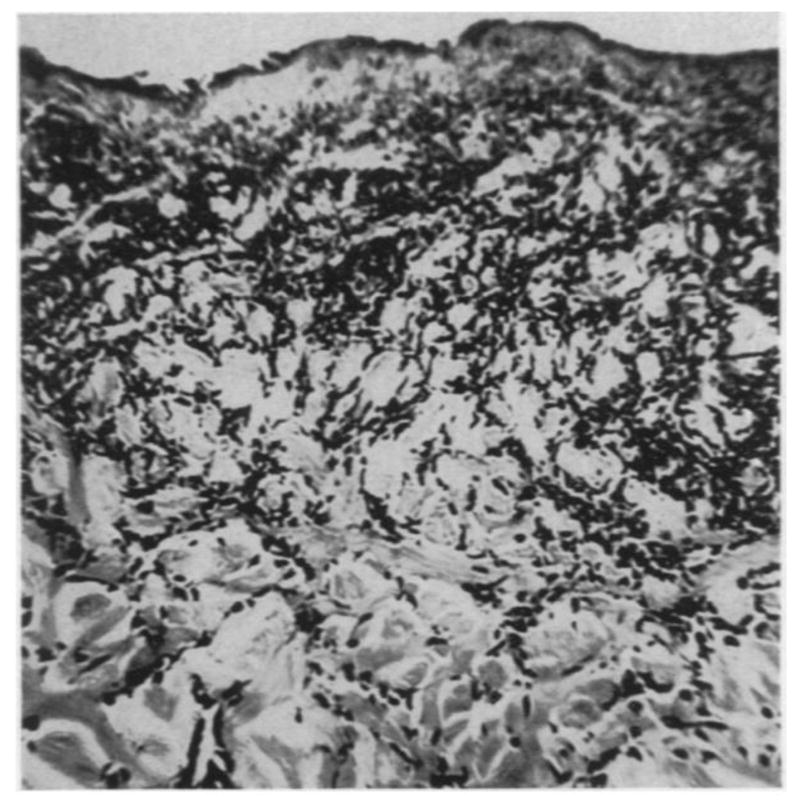
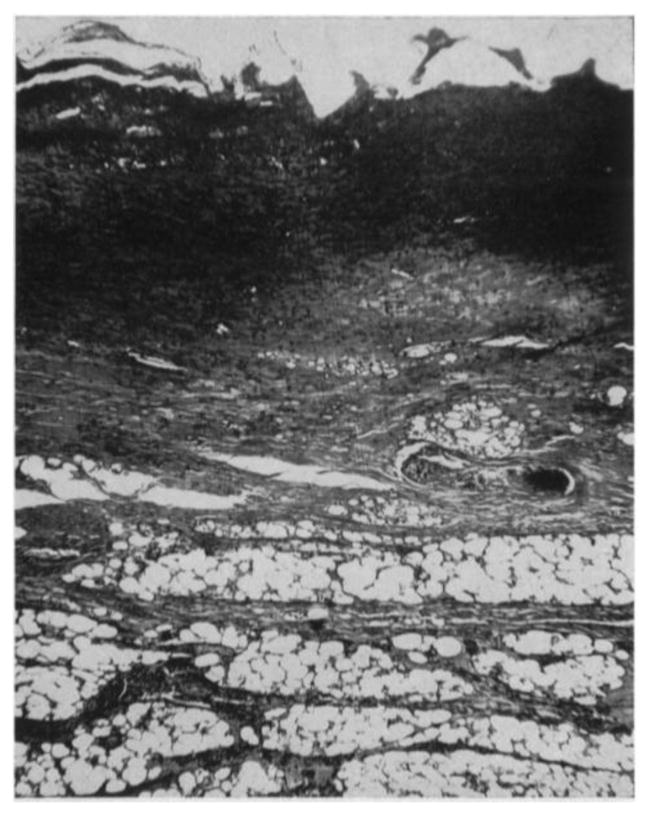
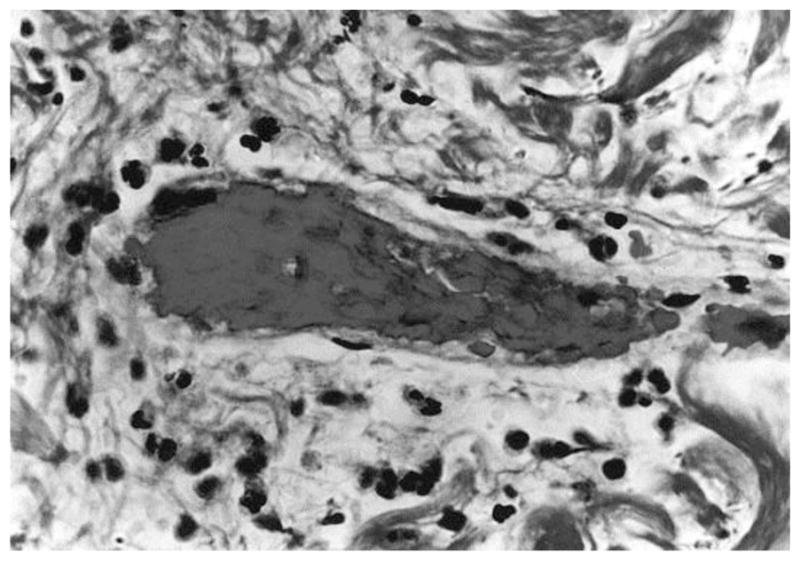
Many studies were performed to characterize the morphologies of tissue with different degrees of burn using biopsy and histology. Mortiz [46] showed images of porcine and human skin with first, second, third degree burns and extreme burns. He reported that in severe first degree burns, the epidermis is degenerative and loses secure attachment to the dermis, see Fig. 2. In porcine skin there is generalized pyknosis of nuclei, and in human skin there are focal and swollen nuclei. For the early second degree of burn, both porcine and human skin showed spontaneous detachment of the epidermis from the dermis, see Fig. 3. There is also vacuolar cytoplasmic disintegration in the basal cell layer, and uprooted tonofibrils from the detached basal cells. For third degree burns, 24 hours after the injury, porcine skin shows coagulation of epidermis and dermis, and the denatured collagen appears swollen, homogeneous and increasingly basophilic. However, sometimes coagulation does not occur, and the dermis is infiltrated by exudative cells, see Fig. 4. 72 hours after the injury porcine skin shows migrated exudative cells between the coagulated collagens, see Fig. 5. For extreme burns (2.5 minutes exposure to > 400°C air), the skin shows carbonized surface and intense basophilic coagulated dermis, see Fig. 6. Watts et al. [3] characterized burn degrees by measuring the level of micro vascular damage. They calculated the burn depth by measuring the level of blocked and patent vessels within the burnt specimen. Figs 7 and 8 show the histologic morphology of blocked vessel and patent vessel. Blocked vessels are filled with red blood cells, with destructed vessel walls and loose endothelial cell lining, while the patent vessels have intact vessel walls, and do not contain cellular debris or densely packed erythrocytes. By measuring the depth of the deepest blocked vessel and that of the most superficial patent vessel, the burnt depth is herein determined. For third degree or deeper burns, Chvapil et al. [47] reported that burn depth can be reflected by the change in collagen stainability due to denaturation, that denatured collagen becomes red under Masson’s trichrome stain, while normal collagen becomes blue-green. Similarly, Singer et al. [48] reported that thermal injury resulted in a change in the stainability of collagen on the H&E stain from red to blue. In sum, the structural integrity, the vascular patency and the extent of collagen stainability etc. can be the indicators of thermal injuries in the histology.
Fig. 2.

(×400) Histologic images of porcine (left) and human (right) skin of severe first degree burns, adopted with permission from [46].
Fig. 3.

(×400) Histologic images of porcine (left) and human (right) skin of early second degree burns, adopted with permission from [46].
Fig. 4.

(×400) Histologic images of third degree burnt porcine tissue 24 hours post-burn, with (left) and without (right) coagulated dermis, adopted with permission from [46].
Fig. 5.
(×400) Histologic images of third degree burnt porcine tissue, 72 hours post-burn, adopted with permission from [46].
Fig. 6.
(×85) Histologic images of extremely burnt porcine tissue, adopted with permission from [46]
Fig. 7.
(×1050) Histologic image of blocked vessel 48 hours post-burn, adopted with permission from [3].
Fig. 8.
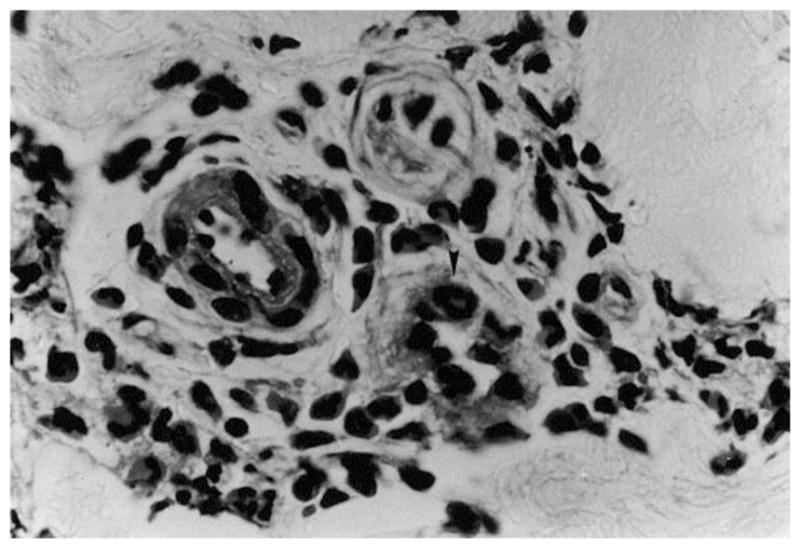
(×1050) Histologic image of patent vessel, adopted with permission from [3]
Though punch biopsy with histological analysis is a well-known and widely accepted method for burn depth assessment, it does have several drawbacks. First, its interpretation is subjective, thus requires experienced pathologists to analyze the results. Second, it only provides a snapshot of the tissue morphology at a certain time and thus lacks the ability to capture the progressive nature of burn wound conversion and loses accuracy at early burn assessment. Third and most importantly, its invasive nature limits its clinical application because it adds scarring and increases the risk of infection [3] [45].
In general, biopsy and histology provide an excellent method for studying burn injuries, but there is a need to develop non-invasive technique for clinical usage.
Laser-Doppler techniques
There are generally two types of laser Doppler techniques: laser Doppler flowmetry giving rise to laser Doppler imaging. They both work on the under the Doppler principle, which states that laser light waves reflected by moving objects such as red blood cells undergo a Doppler frequency shift. As a result, the amount of frequency shift of laser lights can be correlated with tissue perfusion, which is an indication of tissue blood flow [49]. Laser Doppler flowmetry, which is one of the oldest Doppler-based techniques, uses a fiber-optic probe in direct contact with the burn wound and assess microcirculation below it. This technique, though provides high accuracy in determining burn depth (>90%), is limited by its contact nature because of the increased risks of infection and patient discomfort. Laser Doppler imaging (LDI), which is more recent and advanced, exploits a non-contact scanning technique that is capable of measuring the entire burn wound surface. Its efficiency and high accuracy render it as one of the most helpful techniques to assess burn depth. In fact, LDI is the only technique that has been approved by the American Federal Drug Administration (FDA) for the clinical burn depth assessment [44].
The interpretation of laser Doppler image relies on the correlation between burn depth and microvascular blood flow, which is well-studied by many researchers [50] [51] [52]. After scanning, the LDI device usually provides a color image with standard six-color palette: dark blue, blue, green, yellow, pink and red (some machine may provide palette more than six colors, see Fig. 15, but the classification is similar). In this scale areas with high skin blood perfusion will appear red and yellow, whilst areas with low perfusion will appear blue(the exact value of the scale of perfusion depends on the machine specification). Normal skin or full-thickness burn will both appear blue, due to the fact that intact epidermis will reflect great amounts of the HeNe beam without altering the light frequency, or full thickness burn has damaged most vessels thus not much frequency shift happens. The distinction between normal skin and deep burn can, of course, be easily made by clinical appearance. Yellow, pink and red colors represent the more superficial burns, while green or blue represents deep partial-thickness burns [5][6]. Fig. 9 shows the images from LDI at various days post-burn, indicating a wound healing process with increasing tissue perfusion.
Fig. 15.

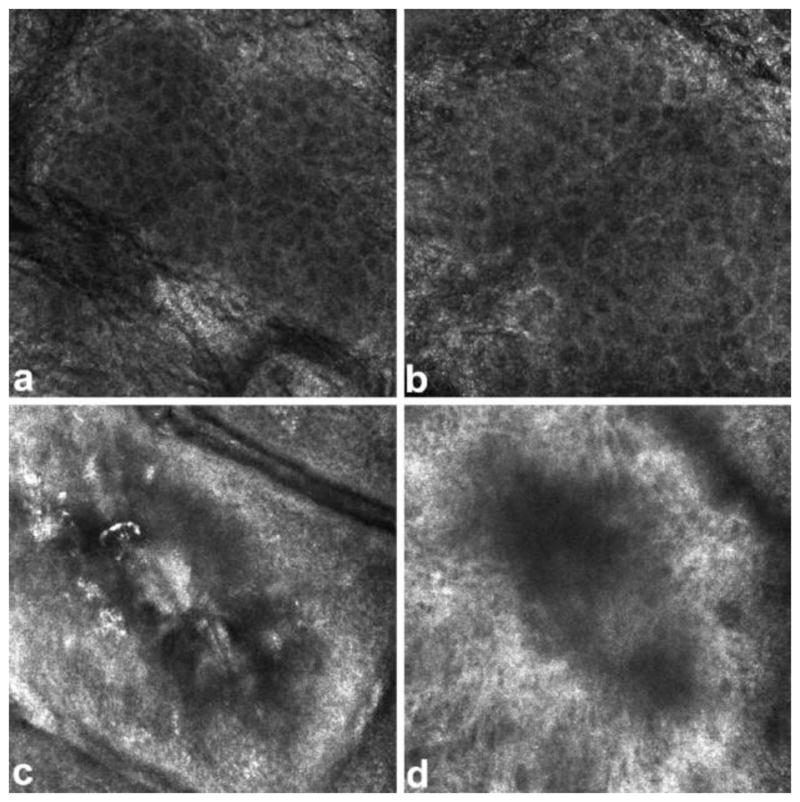
Comparison of images from LSI and LDI. (a) photograph of a hypertrophic from LSI CCD camera; (b) LSI image showing tissue perfusion on the same site; (c) Moor LDI total reflected light intensity map of the same site; (d) Moor LDI image showing perfusion of the same site. Figure is adopted with permission from [96].
Fig. 9.

Laser Doppler imaging at day 0, 1, 3, 5 and 8 post-burn, showing wound healing and increasing perfusion. The healed wound at day 21 post burn is also shown, adopted with permission from [5].
Many studies have demonstrated LDI’s high accuracy and efficiency. Niazi et al. [53] first reported that the LDI assessment correlated 100% with biopsy-histology, while clinical assessment correlated only 41%. Pape et al. [54] reported an accuracy of 97% with LDI in the assessment of burn depth in their auditing study. Hoeksema et al. [5] performed a series studies on assessing burn depth 0, 1, 3, 5 and 8 days post-burn and showed that LDI achieved accuracies of 54%, 79.5%, 95%, 97% and 100% compared with clinical assessment accuracies of 40.6%, 61.5%, 52.5%, 71.4% and 100%. This indicates that LDI can accurately assess burn depth at as early as 3 days post-burn. Similarly, Holland et al. [55] showed that LDI achieved accuracies of 90% at around 48 hours post-burn in assessing burn injuries on children (5 months to 15 year and 8 months old). Nguyen et al. [56] further investigated the accuracies of LDI within 48 hours post-burn and found that no statistically significant difference between results predicted from scans <48 hours and those from scans >48 hours. In general, LDI can accurately assess burn depth at as early as less than 48 hours post-burn.
Despite its high accuracy and efficiency at early burn injury assessment, LDI is not flawless. The accuracy of LDI is compromised when there is excessive patient movements (which is common in children), strong ambient light reflection from the burnt surface;, curvature of the scanned surface increasing beam scattering and presence of tissue abnormalities such as eschar, blisters, slough, or certain topical antimicrobials [6]. It is also reported that LDI appears less useful after 8 days post-burn [5]. In addition, the LDI apparatus is quite expensive (~$66,064 for a Moor LDI) and takes long time to set up before clinical evaluation. Also, deployment of such an apparatus on the battlefield is not practical.
Thermography
Thermography is based on the fact that the burn wound surface temperature can be indicative of burn depths. It inversely correlates temperature with burn depth since deeper wounds are colder than more superficial ones due to decreased vascular perfusion [44]. There are two kinds of thermography: static and active dynamic thermography (ADT). For static thermography, ΔT (the difference in temperature of burnt wound and unaffected area) is measured with infrared camera and the relationship between it and the burn depth is established through comparison with histology [57]. Though good correlation is found between ΔT and the burn depth, the classification of burn depth based on ΔT is subjective to hospitals/institutes. For ADT, the temperature response is assessed following a thermal pulse excitation: first the steady state temperature distribution on the tested surface is measured with an infrared camera; then external thermal excitation is applied, followed by measurements of temperature transients on the tested surface; finally, burn depth of skin can be quantitatively assessed by calculating the thermal time constant τ [58]. The application of ADT in burn assessment on pigs found τ to be significantly different (P < 0.05) between groups of burn wounds that healed before or after 3 weeks, and the results fully agreed with biopsy-histology. Compared to static thermography, ADT is not as sensitive as to environment and more quantitative.
Though thermography is fast, easy to use and cost-efficient, it can be confounded by effects of ambient heat loss such as evaporation. Additionally, accuracy is compromised if wounds begin to granulate, so thermography should be performed within 3 days post-burn for optimal results, which excludes the usage on patients received after 3 days post-burn [44] [59].
Vital dyes
Several vital dyes can be injected intravenously followed by illumination with light in a certain spectrum to make microvascular structure visible. Some of them are non-fluorescent such as Evans blue, patent blue V, and bromophenol blue, and some of them are fluorescent, such as sodium fluorescein and Indocyanine green (ICG). Non-fluorescent dyes have generally been proven not capable of distinguishing partial thickness burns from full thickness burns [44] [60]. One of the fluorescent dyes, ICG, is a non-toxic, protein-bound dye. After being injected intravenously, it stays within the vasculature for a few minutes and then will be quickly cleared by the liver [61]. Within the near-infrared spectrum, ICG fluoresces and shows the microvascular structure, which can then be detected, quantified, and digitally translated into color-mapped images similar to that of LDI, indicating relative perfusion for burn depth assessment [61]. It is reported that ICG fluorescence is relatively brighter in superficial burns, and much darker in deep burns, compared to the subject’s normal skin [62] [63]. In some studies the ICG videoangiography correlated with biopsy-histology and/or clinical outcome closed to 100%, while some others showed that ointments/dressings used for burn care or blood massively compromise the accuracy of ICG videoangiography, which shall be avoided by completely removing all topical substances from a wound at least 10 minutes before ICG examination [64].
ICG videoangiography is capable of distinguishing burn depth a few hours post-burn. It is also cost coefficient and easy to interpret. Its major disadvantage lies in the need for intravenous injection, which is inherently ‘invasive’. Though ICG is non-toxic, it inevitably has side effects such as headache, pruritus, urticaria, diaphoresis, and the ever-present risk of life-threatening anaphylactic reaction [61] [65]. Children less than 20 years of age, pregnant women, and patients with a history of allergic reactions are excluded for ICG examination [66].
Videomicroscopy
Videomicroscopy is a technique that makes use of the transcutaneous microscopy with the fiber-optic light source to visualize dermal capillary structure on the burnt site. Based on the integrity of microvascular structure, it assesses burn depth. McGill et al. [6] established different grades of capillary integrity correlated to burn depth. They defined grade 0 (intact capillary plexus) as corresponding to superficial partial thickness burn; grade 1 (minor capillary destruction), also corresponding to superficial partial thickness burn; grade 2 (large amounts of capillary destruction and hemoglobin deposition) corresponding to deep partial thickness burn; and grade 3 (complete destruction of capillary plexus with absent capillaries) corresponding to full thickness burn. Fig. 10 shows the videomicroscopy images of different grades. Based on this criterion, McGill et al. reported a strong correlation between videomicroscopy assessments with LDI and clinical outcomes. Mihara et al. [67] studied the critical time point of videomicroscopy in early burn assessment, and reported that 24 hours post-burn is the critical time point. Videomicroscopy achieved accuracy of only 57.1% when used within 24 hours while a much higher accuracy of 93.3% is achieved when used beyond 24 hours. Mihara et al. [68] also proposed a new classification based on the capillary pattern. They defined that ‘dots’, ‘dots and reticular’, ‘reticular’, ‘sparse’ and ‘avascular’ corresponded to capillaries “mainly composed of dot patterns”, “composed of dot and reticular patterns”, “mainly composed of reticular patterns”, “with apparent destruction of capillary plexus”, and “with no vascular pattern”, respectively. ‘Dots’, ‘dots and reticular’, and ‘reticular’ correspond to superficial partial thickness injury while ‘sparse’ corresponds to a deep partial thickness injury, and ‘avascular’ corresponds to a deep partial thickness injury. Fig. 11 shows the videomicroscopy images of different patterns. Base on this classification, they reported an accuracy of 92.9% in burn assessment, even for inexperience personnel.
Fig. 10.

Videomicroscopy images of different grades of burn depth, adopted from [67].
Fig. 11.

Videomicroscopy findings of capillary patterns corresponding to different burn depth. SDB refers to ‘superficial dermal burns’, while DDB refers to ‘deep dermal burns’, adopted with permission from [68].
Videomicroscopy has several advantages over LDI. It can accurately assess burn depth at as early as 24 hours post-burn, while LDI needs 48 hours; it is considerably less expensive than LDI, it is easier to operate and simpler to interpret; and it is not affected by patient movement, skin curvature or high ambient light reflection [6] [67] [68]. However, videomiscroscopy also has limitations. It requires direct contact of the probe with the burnt skin surface, increasing the risk of infection and patient discomfort and it can only visualize a small area under the probe, thus making assessing large burn areas difficult.
Orthogonal polarization spectral imaging (OPSI)
Orthogonal polarization spectral imaging (OPSI) is a specialized form of transcutaneous videomicroscopy that provides real-time imaging of the capillary network. It makes use of the cross polarization phenomenon. Light with wavelength around 548 nm (well absorbed by hemoglobin) polarized by a first filter is directed at the tissue, and reflected light is gathered through a second polarization filter orthogonal to the first one [61]. The portion of light reflected from the surface retains its polarization and is thus eliminated from the image, while the portion of light that reaches the deeper structure is either scattered then reflected, or absorbed by the hemoglobin. After being captured by a video camera, the reflected light forms an image of bright background with apparent dark patterns indicating the microvascular structures. OPSI provides images with resolution high enough to visualize red blood cells in healthy tissue, thus coagulated thrombosis in burnt tissue is also clearly visible, see Fig. 12. Milner et al. [69] reported that there is significant difference between the mean optical density in images of healthy tissue and burnt tissue. OPSI has also been validated for the measurement of various microcirculatory parameters, particularly the functional capillary density (FCD, defined as length of perfused vessels per observation area) as parameter of skin perfusion [70]. Combining the images of microvascular structure and the FCD parameter, one is able to determine the burn depth. Goertz et al. [70] defined that an FCD value of 100 cm/cm2 is the threshold for deep thickness burn: areas with FCD <100 are classified as badly perfused deep burnt areas, while those with FCD > 100 are classified as superficial burns. They reported congruence of 76.5% with the final treatment of burns. However, their results were not compared with histology, resulting in a specificity of only 45%.
Fig. 12.

Orthogonal polarization spectral images of A) normal skin, with visible dermal capillaries and individual red blood cells; (B) superficial thermal burn, a resemblance to the normal skin; (C) deep thermal burn, with visible larger coagulated thrombosis, adopted with permission from [69].
Though OSPI has excellent resolution of the microvascular structure, its disadvantages are also obvious. First, it requires direct contact, which increases the risk of infection and patient discomfort. Second, its high resolution also introduces confounding factors to the results: even small perturbations in pressure, either from interstitial hydrostatic forces or from the application of the OPSI probe itself, may cause substantial variation in perceived perfusion [61]. Third, it takes a long time to scan the burn surface and its optimal scan time post-burn is not established.
Reflectance confocal microscopy (RCM)
Reflectance confocal microscopy (RCM, also named reflectance-mode confocal microscopy or confocal-laser-scanning microscopy in the literature) is a recent technique that provides ‘optical biopsy’ for tissue without actually physically dissecting it. A RCM setup includes a laser source which generates near-infrared light, a detector, a beam splitter, a scanning and focusing optical lens and a skin contact device. Laser is emitted from the source, travels through the splitter and lens, and is focused on a small spot on the tissue. The reflection is gathered by the detector. A small pinhole-size spatial filter is placed in front of the detector to filtrate out the reflection from out-of focus planes. In this way, the RCM is able to visualize a plane of interest parallel to the tissue surface. The term ‘confocal’ comes from the fact that the light source point, the illuminated spot of the sample and the pinhole aperture all lie in optically conjugated focal planes [71]. By adjusting the focal points, RCM can reach any plane within a maximum depth of about 200–300 μm. If multiple planes are stacked together, 3D images can be reconstructed. RCM has resolution high enough to detect hair follicles, dermal vessels with erythrocytes inside and white blood cells, which are helpful in determining burn depth. Altintas et al. [72] assessed parameters such as cell size, thickness of layers and number of perfused dermal papillae in burnt tissue with RCM. They found significant difference of these parameters between burnt and normal tissue, see Fig. 13. It is shown that in vivo RCM can differentiate burn depth on a histological level.
Fig. 13.
RCM images of stratum granulosum layer of skin. (a) healthy tissue with cells appearing as dark nuclei (b) superficial burnt tissue with larger cells (c) superficial partial thickness burnt tissue with destroyed cell structure (d) deep partial thickness burnt tissue with cells appearing in a dark shadow Figure is adopted with permission from [72].
RCM, however, has several limitations. First, it requires contact of the probe with the burnt site, which increases the risk of infection and patient discomfort. Secondly, the sampling time is relatively long since the imaging field is small. Third, it is very expensive (~$130,000) [61]. Also, to the best of our knowledge, the accuracy of RCM in burn depth assessment has not yet been reported.
Multispectral imaging
Multispectral imaging (MSI) works under the principle that the optical properties (i.e. reflectivity, absorption and scatter coefficient) change under thermal injury due to the alteration in collagen and vessel structure. In 1987 Afromowitz et al. [73] developed a device called imaging burn depth indicator (IBDI), which measured the red-to-infrared and green-to-infrared diffuse reflectivity ratios of selected sites on burn wounds, and they showed that measurements of the optical reflectivity of burn wounds on the third day post-burn in the red, green, and near infrared bands were strongly correlated with time-to-healing. They further used a 3-layer Kubelka-Munk model of clean (debrided) burn wounds and showed that the back-scattering of red, green, and near infrared light from a wound is a function of the thickness of the denatured collagen layer at the wound surface (known as eschar), the volume fraction of blood in the tissue just below this denatured layer where patent vascular structures exist, and the oxygen saturation of the perfusing blood. They also applied the IBDI device to clinical usage and reported an accuracy of 79%-86% compared to that of 48%–71% from clinical assessment [74]. Eisenbeis et al. [4] also applied a similar technique with blue, green red and near infrared spectrum to clinical assessment of burn depth and claimed an improved reliability in their technique due to the improved burn depth classification algorithm, which adapted to different skin types. However they also pointed out that meaningful results can only be obtained 3–4 days post-burn and strong light source should be avoided during the examination. With the rapid advancement of technique, MSI has achieved higher accuracy within shorter time post-burn. King et al. [75] applied MSI to burn assessment on pigs in comparison with histology. They reported that MSI detects significant variations in the spectral profiles of healthy tissue, superficial partial thickness burns, and deep partial thickness burns. Specifically, the absorbance spectra of 515, 542, 629, and 669 nm were the most accurate in differentiating superficial from deep partial-thickness burns, while the absorbance spectra of 972 nm was the most accurate in indicating the debridement process. The assessment was performed immediately post-burn and 1 hour post-burn.
MSI is non-invasive, motion tolerant, ointment tolerant and requires no contact with the burn site. Though its validity in clinical applications remains to be seen, it holds great potential for a clinical device.
Optical coherence tomography (OCT)
Two types of extension of conventional OCT are applied in burn depth assessment. They are polarization-sensitive optical coherence tomography (PS-OCT) and spectroscopic OCT (SOCT). PS-OCT quantifies tissue damage by assessing the loss of collagen birefringence through the degree of polarization in reflected light, which can be detected as phase retardation [61]. Park et al. [76] first applied PS-OCT to in vivo burn assessment in rats. They reported good correlation between the degree of phase retardation as a function of depth and burn depth determined by histology. Jiao et al. [77] applied polarization-sensitive (PS) Mueller-matrix optical coherence tomography (OCT) to in situ/ex vivo burn assessment in rats. They reported that PS Mueller OCT provided complementary structural and functional information on biological samples, such as the amplitude of birefringence, the orientation of birefringence, and the diattenuation in addition to the polarization-independent intensity contrast. They also reported that polarization contrast is more sensitive to thermal denaturation of biological tissue than amplitude-based contrast. Kim et al. [78] performed in vivo burn assessment studies on human with PS-OCT. They imaged the burnt sites and their contralateral controls in 3D, and compared the difference in vascular structure as well as the accumulated phase retardation. They reported that superficial burns exhibited the same layered structure as the contralateral controls, but more visible vasculature and reduced birefringence while deep burns showed destruction of the layered structure with minimal vasculature, and much smaller birefringence compared to superficial burns. SOCT provides not only cross-sectional tomography but also the spectroscopic imaging of the tissue, by detecting and processing the interferometric OCT signals [79]. Maher et al. [80] applied POCT to assess burn depth in rats in vivo. They reported an overall accuracy of 91% in differentiating third degree burns from healthy tissue, and significant difference was found in the spectral data between burnt and healthy tissue. Similarly, Zhao et al. [81] performed burn experiment in rats in vivo and assessed the burn depth with POCT. They also reported significant difference in spectal data, as well as strong negative correlation between spectral data and histologic results. Compared to the work of Maher et al., they developed a depth-dependent analysis method and improved the accuracies of classifying superficial partial thickness and deep partial thickness burns.
OCT has been demonstrated to have potential for quantifying burn degree in clinical application. However, it is worth noting that OCT is expensive and can only penetrate 1–2mm depth, which may be a limitation to its application to thicker skins. Moreover, it has a small field of view.
Near Infrared spectroscopy (NIRS)
NIRS is sensitive to changes in both scattering and absorption properties of tissue [82]. By capturing changes in scattering properties in ways similar to other optical imaging technique such as OCT, NIRS is capable of detecting changes in tissue structure due to thermal injury. Additionally, it reflects the status of hemoglobin and water content within the burnt wound by measuring the amount of near-infrared light absorbed by hemoglobin and water, since de-oxy hemoglobin, oxy-hemoglobin and water share distinctly different peak absorption spectra. On the basis of oxygen saturation, total hemoglobin and tissue water content, NIRS is capable of differentiating burn depths. Sowa et al. [82] reported that NIRS had an accuracy of 86.7% in differentiating superficial and full thickness burn in porcine tissue within 1–3 hours post-burn. Cross et al. [83] [84] applied NIRS to clinical assessment of burn depth in adults. They reported that compared to normal skin, superficial burns showed an increase in oxygen saturation and total hemoglobin, while full-thickness burns showed a decrease. In that sense, NIRS is able to distinguish superficial and full-thickness burns.
Due to the ability of deeper penetration of near infrared lights, NIRS is able to detect changes deeper under the skin. Though it is demonstrated that hemodynamic parameters are capable of quantifying burn depth, there is also a distinct lack of standardization. The accuracy of NIRS in clinically assessing burn depth remains to be seen.
Terahertz imaging
Terahertz radiation usually refers to the part of the electromagnetic spectrum with frequencies between 100 GHz and 10 THz (wavelengths from 3 mm to 30 μm), which is known as the so-called “THz gap” [85]. Its high absorption by both bound and free water molecules renders it a sensitive tool for contrast imaging in soft tissue. Hence, terahertz reflectometry is able to capture the change in water contents in burnt tissue due to the formation of interstitial edema, thus characterizing the burn depth.
Terahertz imaging has been applied for burn assessment both ex vivo and in vivo. Taylor et al. [86] and Minttleman et al. [87] reported that for ex vivo porcine or chicken tissue, a lower reflectivity is present in burnt area compared to the unburnt tissue. On the contrary, Tewari et al. [88] reported an increase in reflectivity of burnt tissue in in vivo burn test of rats. This difference can be understood as that edema forms in live tissue but not in excised tissue. Arbab et al. [85] reported that the terahertz reflectivity is consistent with the water content in tissue as well as the density of skin (DOS) structures obtained from image processing analysis of histological sections. They then proposed that terahertz reflectivity and DOS should be combined to quantify burn depth.
It is worth noting that terahertz imaging is capable of detecting burn depth through certain ‘obstacles’ such as gauze and bandages, due to its high frequency [86] [89]. Thought terahertz imaging is shown to be capable of detecting burn tissue, it still lacks standardization for burn depth quantification. The accuracy of terahertz imaging in burn assessment remains to be seen.
Ultrasound
The ultrasound technique works under the pulse-echo principle -- a piezoelectric transducer generates pulses and the reflected signals are collected. After the signals are processed, structural information of the tissue can be reconstructed. The application of ultrasound in burn assessment was initially done by Goans et al. [90], who determined burn depth based on the pulse-echo reflection spectra. They reported that in normal porcine skin, the spectra showed two peaks of signals, indicating the epidermis-dermis and dermis-subcutaneous fat interface, while in burnt tissue additional peaks appeared between the interfaces, indicating burn injuries. They also reported nice correlation between the burn interface in histologic sections and the ultrasound spectra peaks, indicating that ultrasound technique can effectively determine burn depth. Kalus et al. [91] was the first to use ultrasound scanning B-mode images to assess burn depth in 2 patients. They accurately predicted the burns to be superficial on one patient and full thickness on the other. With advancing techniques, high frequency ultrasound (>20 MHz) is available for imaging histological details in the skin. Brink et al. [92] used 25MHz ultrasound to visualize burnt site images and compared them to histologic sections and found good correlations (Pearson correlation r=0.9). Lin et al. [93] used 50MHz ultrasound to measure ultrasonic signals backscattered from the burnt skin tissues and correlated burn depth with two ultrasonic parameters: integrated backscatter (IB) and Nakagami parameter (m) calculated from ultrasonic signals acquired from the burnt tissues. They reported that both IB and m decreased exponentially with increase in burn degree, indicating potential to assess burn degree quantitatively with high frequency ultrasound. While conventional ultrasound requires direct contact on burnt site, Iraniha et al. [94] developed a non-contact ultrasound which functioned via a probe that can be held 1 inch away from the skin. With this device, they achieved an overall accuracy of 96% in predicting burn wounds that would heal within 3 weeks in patients.
Ultrasound has been wildly used in clinical applications. Though its applicability for burn assessment remains to be seen, it holds great potential, especially when combined with other computational methods such as elastography which can detect tissue elasticity.
Laser speckle imaging (LSI)
Laser speckle is a random interference effect that generates a high-contrast grainy pattern on objects illuminated by laser light [95]. If the object contains moving particles such as red blood cells, the speckle pattern is altered, resulting in blurring of the image, the level of which correlates with the velocity of the moving particles. LSI is often compared with LDI, due to the fact that they are both laser-based techniques to measure blood perfusion. In fact, they are two different ways of looking at the same phenomenon. They create similar color-code maps of blood perfusion, see Fig. 15. Unlike LDI, which requires 10–20 minutes scanning time, LSI is capable of generating a map of velocities in real time by illuminating the whole region of interest. Moreover, LSI provides higher resolution images. Hence, LSI is gaining increasing attention for burn assessment in recent years.
Several studies are performed to compare LSI with LDI. Stewart et al. [96] showed that there is a strong correlation (r2=0.86) between the results from LSI and LDI in assessing scar perfusion and both of them also correlate significantly with clinical grading. Similarly, Millet et al. [97] showed a linear correlation between LSI and LDI in the measurement of blood perfusion. Lindahl et al. [98] used LSI to assess pediatric scald injuries and studied the effect of camera distance/angle and ambient light on the perfusion value generated by the LSI system. They reported that LSI results were not affected by those factors, and LSI is capable of predicting outcomes of burn injuries.
Though LSI shows promising results and obvious advantages over LDI, statistical evidence is needed to justify its accuracy relative to LDI. Besides, the LDI technique also has some theoretical and practical problems which are discussed in detail by Briers et al. [99]. Nonetheless, LSI is a promising technique for the assessment of burn wounds and deserves further developments.
Spatial frequency domain imaging (SFDI)
SFDI is a noncontact wide-field optical imaging technique developed at the Beckman Laser Institute and Medical Clinic in Irvine, California. It works under the principle that spatially modulated near-infrared light patterns of various spatial frequencies are projected over a large (over 100 cm2) area of a sample and the reflected diffusive lights are captured with a camera, then demodulated to extract information of change in optical properties [100]. Capable of investigating tissue structure about 1–5 mm below the skin surface, SFDI is able to measure spatially resolved concentrations of clinically relevant chromophores including oxy-hemoglobin, de-oxy hemoglobin, lipid, water, and tissue oxygen saturation as well as the quantitative wide-field reduced scattering coefficients at each wavelength [101]. The changes in the above mentioned parameters can be indicative of burn depth. Nguyen et al. [101] performed an in vivo burn study on rats and found that there are statistical difference between superficial partial thickness burns and deep partial thickness burns in water concentration, deoxygenated hemoglobin concentration and optical scattering properties. In particular, the differences in water concentration and optical scattering manifest themselves at as early as 10 minutes post-burn, while the difference in oxygenation does not occur until 50 minutes post-burn. Mazhar et al. [100] performed an in vivo burn study on pigs and showed that optical scattering parameters differentiated superficial burns from all burn types immediately after injury, and separated all 3 degrees of burns 24 hours post-burn. On the other hand, tissue oxygenation is less sensitive to burn degree and cannot differentiate deep partial from full thickness wounds in 72 hours post-burn.
SFDI is a recent, powerful technique for monitoring changes of properties in burnt tissue. Though no human tests have been reported with this technique and its clinical accuracy for burn assessment remains to be seen, it holds great potential for quantifying burn depth at an early stage.
Photoacoustic imaging
Photoacoustics is a blossoming field of science that exists at the intersection of optics and acoustics. It works under the principle that the deposition of laser energy into an optically absorbing medium can produce an acoustic signal for detection [102]. It provides high spatial resolution at deeper than 1mm below the skin, overcoming the imaging depth limitation of pure optical imaging techniques such as RCM or OCT, due to the fact that ultrasonic scattering is orders of magnitude weaker than optical scattering in tissue [103]. Hence, it is able to detect change in hemoglobin absorption, blood volume etc. due to thermal injury, differentiating burn depth. Sato et al. [104] performed an in vivo burn study on rats and successfully distinguished superficial dermal, deep dermal, and full-thickness burns based on the signal depth. Zhang et al. [105] performed an in vivo burn study on pigs and reported that they could clearly define the zone of hyperemia with photoacoustic technique. Ida et al. [106] compared the performance of photoacoustic imaging with that of LDI in burn assessment in rats in vivo. They reported that the burn depths indicated by photoacoustic imaging were highly correlative with biopsy-histology results, while the perfusion values measured by LDI were less correlative. They also reported a smaller error from photoacoustic imaging results than that of LDI results.
Photoacoustic techniques show good potential for the experimental assessment of burns but further animal tests or clinical studies are needed to prove its accuracy. Moreover, the narrow field of view may not be suitable for large area burns.
Combined techniques
There is a growing trend toward combining two or more of the imaging modalities for burn assessment. Ganapathy et al. [107] combined OCT with LSI to classify the degrees of burn. With OCT providing the cross sectional image and LSI the blood perfusion information, they were able to classify different degrees of burns 1 hour post- burn. Iftimia et al. [108] combined RCM with OCT to assess burn damage in in vitro human skin models and reported potential benefits of combining these methods. Ponticorve et. al [109] combined SFDI with LSI in assessing burn depth in vivo on pigs. With LSI characterizing the blood flow changes and SFDI providing the information about changes in tissue scattering properties, they were able to distinguish superficial partial and deep partial thickness burns at one hour after burn injury. Nam et al. [106] combined ultrasound with photoacoustic imaging to assess burn injury in vivo on rats. They reported that a combined ultrasound and photoacoustic image provided richer information for quantifying damages in skin structures.
Attention should be paid to the compatibility of equipment as well as the cost when trying to develop such combined techniques for burn assessment. However, there is no doubt that combined techniques will benefit the process of burn assessment, and it will be an exciting new field in future developments.
1.3 Experimental burn protocols
Burn protocol is an important component in experimental studies of burns, particularly because it helps recreate different level of burn severity in experiments, which facilitates the subsequent process of burn assessment. Burn protocols are usually subjective, depending on the specific experimental condition, and there is lack of any standardization. Nonetheless, various efforts have been made to develop standardized burn models. The burn time/temperature vs. burn depth relation is available in literature, mostly in the form of look-up tables. In this section, we summarize some of these burn protocols.
Burn depth is related to the temperature and time exposed to the heat source. Mortiz and Henriques [110] were the first to demonstrate on pigs and human that a classical inverse relation exists between the temperature and time required to produce a specific degree of burn, see Fig. 16. It is worth noting that the critical temperature for thermal damage is about 43 °C - below which no damage occurs no matter how long the tissue is exposed to the source [111] [112]. This inverse relation indicates that one can create different degrees of thermal injury by either varying the time of exposure or varying the temperature of the heat source. The actual burn depth created depends on the specific experimental condition, i.e. heat source type and animal species, and is usually confirmed with subsequent histology analysis.
Fig. 16.

Time-temperature threshold for thermal injury and second degree burn, replotted with permission from [110].
Heat source
A stable, safe and portable heat source with regular shape is very helpful in creating controlled burn injuries. Scalding is one of the common options for creating burn injuries for small animals [80] [113]—the animal is immersed in liquid boiled to a certain degree for a certain period of time. This method, however, is not suitable for larger animals such as pigs, because of the difficulty of immersing them in liquid. Cuttle et al. [114] built a customized burning device with a Schott Duran bottle. They removed the bottom of the bottle, replaced it with a plastic warp, and filled the bottle with sterile water. They heated the bottle of water in a microwave oven. This device, though portable, has potential safety hazard for high temperatures. Thus multiple researchers chose to heat up a piece of metal and then place it on the animal to create desire burns. The metals are usually aluminum [48] [115] [116], brass [93] [100] [101] [117], stainless steel [118] or iron [92]. The burning devices are usually heated up to desired temperatures via immersion in boiling water. However, Gaines et al. [117] pointed out that boiling water produces air bubbles, which creates non-uniform heating in the piece of metal. The uneven temperature distribution of the burning device will then create uneven burning in the animal, leaving confounding factors in the subsequent observation. Hence, Gaines et al. proposed heating up the piece of metal with boiling azeotropic mixture of deionized water and polyethylene glycol and reported a more uniform burning. Venter et al. [115] replaced the head of a soldering iron with the burning head so as to maintain the burning temperature. Their device, though convenient, requires customization of the circuit for safe operation. When applying the heat source to an animal, the pressure of application has a direct effect on the intensity and depth of burn [119]. Hence, it is also important to maintain consistent pressure while applying the heat source. It is common practice to use the burning head’s own weight as the pressure—simply placing the burning head on the animal without any additional force will keep the pressure consistent. For more delicate experiments, customized device with springs or pistons to control the pressure have been developed [109] [116] [117].
The above mentioned burning devices are developed generally for recreating burning scenarios encountered in civilian life which is characterized by low burning temperatures (100–200 °C) and longer exposure times (>1s). In combat scenarios, so-called ‘flash burn’ may occur which is characterized by high temperatures (>1000 °C) with short exposure time (<1s). Several studies have been made to characterize such effects. To create flash burns, Pearse et al. [120] ignited a small amount (124g) of magnesium with electric spark, generating approximate 3500 °C for about 0.338s. They confined the pigs inside a box with a small open area, which exposed the animal to the explosion. Dersken et al. [40] used high intensity carbon arc, a tungsten lamp that operated at 3000°C, and infrared radiation to create flash burns.
Animal model
Using the proper animal model for burn experiments is very important, since it determines whether the results translate to humans. Henriques et al. [110] performed some of the burning experiments on human subjects, which, due to obvious ethical reasons, is unlikely to be repeated. Pigs appear to be the de facto model due to the anatomical and functional similarity between porcine and human skins. Anatomically, both porcine and human skin have comparable dermal-epidermal thickness ratios; well-developed rete-ridges, dermal papillary bodies, abundant subcutaneous fat, sparse body hair and no panniculus carnosus (which can be found in small animals). Additionally, they contain blood vessels similar in size, orientation and distribution; and they have biochemically similar dermal collagen. Functionally, they share similar epidermal turnover time, immunohistochemical stainability, and wound healing process [121]. Though differences exists in adnexal structures as porcine skin contains no eccrine glands and the apocrine glands are distributed through the surface of the skin, the overall similarities between porcine and human skin make pigs the most favorable surrogate for human in burn experiments. Many studies on imaging modalities have been reported on pigs prior to their clinical trials [109] [114] [118] [117]. However, pigs are large and relatively expensive. Hence lab rats have also been used [48] [113] [115], after removal of their hair. Similarly, sometimes hamsters [122] or guinea pigs [47] have also been used in burn experiments. It is worth mentioning that the usage of small mammals is mainly based on the fact that they are low-cost and easy to handle. The anatomical structures and functions of their skin, however, differ from that of human in various ways, i.e. small mammals has much more hair and thinner epidermis compared to human, and their wound healing process is different than that of human [121]. Some researchers chose rats particularly because of their thin skin, since the penetration depth of imaging modalities such as OCT is limited [80] [81]. Nonetheless the results obtained from burn experiments on small mammals should only be comparable within the same species, and extreme caution should be paid when translating those results to humans.
The time/temperature vs. burn depth relation varies between different species. Table 7 gives the information about time/temperature vs. burn depth with respect to pigs and rats. Note that those are ranges of data collected from prior works. For an accurate determination of burn depth, subsequent biopsy and histologic analysis are needed.
Table 7.
General look-up table for time/temperature vs. burn depth
| Species Time (s) | Pigs | Rats | |||||
|---|---|---|---|---|---|---|---|
| 10 | 20 | 30 | 40 | 10 | 20 | 30 | |
| Temperature (°C) | |||||||
| 50 | None[48] | None[48] | None[48] | ||||
| 60 | * DP[48] | DP[48] | DP[48] | ||||
| 70 | DP[48] | DP[48] | DD[48] | ||||
| 80 | DD[118] | DP[48] | DD[48] | DD[48] | |||
| 90(or about 90) | DP[114] | DD[114] | DD[48] | DD[48] | F[48] | ||
| 100 | DP[109] | DD[109] | F[109] | F[109] | DD[48] | F[48] | F[48] |
| 200 | F[116] | ||||||
‘S’ denotes superficial (first degree burns), ‘DP’ denotes deep partial burns (second degree), ‘DD’ denotes deep dermal burns (second degree), ‘F’ denotes full thickness burns (third degree).
Part 2: Numerical studies
Numerical studies play an important role in developing a deeper understanding of thermal damages in tissue. In this part, we are summarizing the numerical models of burn injuries in literature.
2.1 Damage model
The Arrhenius type damage equation developed by Henriques [123] is widely used by many researchers to calculate damage distribution in skin:
| (1) |
In this equation Ω, is the damage integral, A is the frequency factor, ΔE is the activation energy controlling the development of the tissue injury, and R is the universal gas constant. T is the transient temperature distribution, which can be calculated from the governing equation of bioheat transfer process that we are present in the next section. By integrating equation (1) over time, one can obtain the accumulated damage. It is reported that an Ω value of 0.53, 1.0 and 104 corresponds to first, second and third degree burns, respectively [124].
The values of A and ΔE depend on the temperature and the specific tissue. Thus, they are determined by empirically fitting the equation to experimental data. Several researchers have provided the values of A and ΔE, and their results are collected by Ng et al. [125], which is presented in Table 8. Ng et al. also performed studies to determine the effect of A and ΔE on predicted burn damage. They found out that the predicted burn damages using different sets of parameters were not much different in low temperature regimes, while significant differences existed in high temperature regimes. Orgill et al. [124] compared the prediction from the damage model with experimental histology results and found good correlation between them. It has been demonstrated that the Arrhenius type damage model can provide reasonable estimation of burn damage.
Table 8.
Values of activation energy and frequency factors, collected by Ng et al. [125], adopted with permission.
| Injury model | Temperature range (°C) | Activation energy ΔE (J/kmol) | Frequency factor A (1/s) |
|---|---|---|---|
| Henriques[123] | All T | 6.27×10⁸ | 3.1×1098 |
|
| |||
| Fugitt[126] | T ≤ 55 | 6.27×10⁸ | 3.1×1098 |
| T > 55 | 2.96×10⁸ | 5.0×1045 | |
|
| |||
| Stoll et al.[39] | T≤ 50 | 7.82×10⁸ | 2.185×10124 |
| T> 50 | 3.27×10⁸ | 1.823×1051 | |
|
| |||
| Takata[127] | T≤ 50 | 4.18×10⁸ | 4.322×1064 |
| T> 50 | 6.69×10⁸ | 9.389×10104 | |
|
| |||
| Wu[128] | T≤ 50 | 6.27×10⁸ | 3.1×1098 |
| T> 50 | 6.27×10⁸ ~ 5.10×10⁵ × (T–53) | 3.1×1098 | |
2.2. Bioheat transfer model
A bioheat transfer equation is needed to predict the temperature profile in the tissue based on applied heating. In general, there are three types of equations presented in literature: the Fourier type equation, wave type equation and dual phase lag type equation. In this section, we summarize these models for simulating burning process in skin.
Fourier type heat transfer equation
Fourier’s law provides a linear relationship between the heat flux (q) and the gradient of temperature (T):
| (2) |
where k is the thermal conductivity. The general governing equation for bioheat transfer process is simply an energy balance relation expressing the First law of Thermodyanmics:
| (3) |
where ρ and C are the density and specific heat of the skin tissue, respectively. Wb, ρb,Cb,Tb are the perfusion rate, density, specific heat and temperature of blood, respectively. Qmet is the metabolic heat generated in the tissue, and Qext is heat from the external heat source. Substituting (2) into (3), Pennes’ bioheat equation [129] is obtained:
| (4) |
Pennes’ bioheat equation with variations (neglecting some of the terms) has been widely used in simulation of burn process in the skin. Orgill et al. [124] and Diller [130] neglected the blood perfusion as well as the heat terms in their simulation. Diller et al. [131] took into account the blood perfusion and determined the damage contours of skin subject to a round plate heating surface. Jiang et al. [13] used a similar model to study how the different thicknesses of each layer affected the level of burn injuries. They reported that the epidermis and dermis thicknesses significantly affect the temperature and burn injury distributions – the thicker the epidermis and dermis, the less the thermal damage. Consistent results are also reported by Aliouat Bellia et al. [132]. Ng et al. [125] performed a parametric and sensitivity analysis on how different thermal properties of skin affected the level of burn injuries. They reported that the thermal conductivity of the epidermis and dermis, convective heat transfer coefficient and initial tissue temperature have a substantial influence on assessing the burn injury threshold. The effect of blood perfusion rate, on the other hand, did not have much influence on the extent of burn injuries. This result confirms the opinion of Lipkin et al. [33], that the time taken for the skin to react by increasing the blood flow is about 20 s, thus blood perfusion may be neglected in computation for short exposure time.
Several efforts have been made to use the numerical results from Pennes’ bioheat equation as guidelines to predict clinical outcomes of thermal injuries. Johnson et al. [133] simulated skin subjected to scalding using Pennes’ bioheat equation with boundary conditions that took care of the extended exposure to heat source due to clothing, and compared the numerical results to experimental results. They reported that the delay of removal of hot clothing can indeed lead to significant increase of burn injuries from scalding, and the prediction of thermal damage from this model is consistent with experimental findings. Abraham [134] et al. proposed a simple approximating function, which depends on temperature and exposure time to the heat source, and used it to predict the extent of burn injuries. They reported a R2 value of 0.967 between the results from the simple approximating function and the ones from Pennes’ bioheat equation, indicating that the simplified function is helpful in clinical practice since it allows medical practitioners to determine burn injuries accurately and quickly. Later Bourdon et al. [135] provided a more simplified look-up table that categorizes and predicts the outcome of the burn injuries of scalding from different temperature and cooling time. These results are significant as they bridge the gap between numerical simulation and clinical practice.
Despite the popularity of the Fourier type model, there are doubts about is completeness. In the Fourier’s law, it is assumed that any temperature disturbance or thermal wave will travel instantaneously (velocity = ∞) through the medium, which is not true in reality, especially during the short duration of an initial transient, or when the thermal propagation speed of thermal wave is low [136]. It is also reported that Pennes’ equation fails to describe some thermal wave effects of changing power on bioheat transfer in tissue [137]. Hence, some researchers have proposed the wave type model, which will be discussed next.
Wave type heat transfer equation
It is reported that inhomogeneous materials such as tissue exhibits a comparatively long thermal relaxation/lag time (10−3–103 s, compared to 10−8–10−14 in homogeneous engineering materials [136]), often denoted by τ, which physically represents the time needed to establish steady thermal conduction within a material volume element as soon as a temperature gradient has been imposed upon it [138]. To describe this phenomena, Fourier’s thermal conduction law can be replace by the Cattaneo-Vernott flux law (or Maxwell–Cattaneo flux law), namely
| (5) |
This equation can be viewed as a first order Taylor expansion of
| (6) |
where x is the position vector and t is the time.
Substitute (5) into (3), we then obtain the wave type (hyperbolic) governing equation of bioheat transfer:
| (7) |
Of course, when τ = 0, equation (7) reduces to Pennes’ equation.
Several studies have been conducted to simulate burn injuries using the wave type model. Liu et al. [139] compared the wave type model with Pennes’ model in 1D case when the tissue was subjected to instantaneous heating. They reported that for high flux heating with extremely short duration (i.e. flash fire) the wave type model may provide more realistic predictions of burn evaluation as it accounts for thermal wave propagation. Dai et al. [138] developed a triple-layer 3D model with embedded countercurrent vasculature for skin subjected to radiation heating. They reported that the wave type model predicted a lower temperature distribution than Pennes’ model with expected delay in temperature rise. Similarly, Lin et al. [140] and Özen et al. [141] reported a lower increase in temperature using the wave type model. They also reported that the blood perfusion had some cooling effect when burn time is long.
Although the wave type model has explained some interesting phenomena, its validity can be questionable [136] as it does not take into account the temperature dependence of τ. Though it includes the wave model that captures the microscale response in time, it does not include the microscale response in space, which may result in unphysical solutions. Thus a more complicated model -- the dual phase lag model, has been developed.
Dual phase lag type heat transfer equation
Similar to equation (6), if we introduce another ‘lag term’ in the temperature gradient, we then obtain the dual phase lag (DPL) equation:
| (8) |
where τt denotes the lag in time, while τT denotes the lag in space. Their physical meaning can be interpreted as “thermal inertia” and “microstructural interaction”, respectively [142]. If τT = 0, the DPL model reduces to the wave type model. And if τt=τT=0, the Fourier type model is recovered.
By exploiting the first and second order Taylor expansions, the DPL model can be developed into several pertinent models [143].
If we apply first order Taylor expansion for both sides of equation (8), we obtain
| (9) |
Substitute (9) into (3), we obtain the Type 1 DPL model, given as
| (10) |
If we apply first order Taylor expansion to the left hand side of (8) and second order Taylor expansion to the right hand side, we obtain
| (11) |
Substituting (11) into (3), we obtain the Type 2 DPL model, given as
| (12) |
If we apply second order Taylor expansion to both sides of equation (8), we obtain
| (13) |
Substituting (11) into (3), we obtain the Type 3 DPL model, given as
| (12) |
There is a growing trend to apply the DPL to simulate the process of burning on skin. Xu et al. [143] applied all three types of DPL models to simulate burn injuries in skin and compared the result to Pennes’ model as well as the wave type model. They reported that the three DPL models behaved similarly, while substantial difference existed between the DPL, wave-type and Fourier models for the same exposure temperature. The difference in temperature distribution resulted in significant difference in burn damage. For example, the thermal wave model generated the largest value of thermal damage at the end of heating for the epidermis-dermis interface, while the DPL model gave the smallest damage distribution along the depth of skin. Liu et al. [144] applied type 1 DPL model in an 1D case and reported that the DPL model can be reduced to the Fourier model when τt=τT, even when the effect of blood perfusion is taken into account, as long as the thermal effect of metabolic heat generation can be neglected.
Conclusion
Burn depth assessment is of vital importance in clinical practice. Accurate determination of the burn depth at early stages will facilitate treatments such as skin excision or grafting, which enhance the rate of recovery, shorten hospital stay and reduce cost of care. Clinical assessments are shown to have an accuracy of only 50%–80%. Various imaging techniques have been developed to improve the accuracy of burn assessment. While each existing imaging modality has its own advantages and disadvantages, newer and more powerful techniques are emerging rapidly to provide clearer images and easier ways to assess burn depth. On the other hand, numerical analysis aids understanding the underlying physics of burn injuries. The models developed till date only account for the thermal physics and a heuristic understanding of tissue damage based on thermal profiles. A major knowledge gap exists in quantitative characterization and modeling of changes in intrinsic tissue properties including mechanical, electrical, thermal and optical properties, as a result of the burning process. Future diagnostic and therapeutic procedures may benefit significantly from a detailed understanding of such properties. Physically realistic tissue damage laws may be derived that would provide improved predictive capabilities. It is anticipated that predictive modeling would augment imaging modalities to provide more accurate, noninvasive diagnosis of burn injuries and treatment modalities.
Fig. 14.

True-color image (left) and false-color image (right) from MSI, adopted with permission from [4]. Blue color indicates deep partial thickness; green indicates deep-dermal thickness and red indicates full-thickness burns.
Table 2.1.
Young’s modulus and ultimate strength of healthy skin
| Species | Experimental method | Anatomic site | Young’s modulus (MPa) | Ultimate strength (MPa) |
|---|---|---|---|---|
| Human | Uniaxial tension | Thorax/neck | 11[16] | |
| Abdomen/back/arm/foot | 9.5[16] | |||
| Leg/hand | (ivv*) 4.6–20 [17][18] | 7.3[16] | ||
| Face/head/external genitals | 3.7[16] | |||
|
| ||||
| torsion | Dorsal forearm | (ivv) 0.42–0.85 [17] | ||
| Ventral forearm | (ivv) 1.12 [17] | |||
|
| ||||
| suction | Various sites | (ivv) 0.13–0.26[17][19] | ||
| Volar forearm | (ivv) 0.129±88[20] | |||
|
| ||||
| indentation | Volar Forearm | (ivv) 0.0045–0.008[21] | ||
| Thigh | 0.00199[17][22] | |||
| Forearm | 0.00109–0.00151[17][22] | |||
(e) indicates ex vivo test, (ivv) indicates in vivo test, and (ivtr) indicates in vitro test
Table 2.2.
Hyperelastic models and their parameters for healthy skin
| Species | Experiment method | Anatomic site | Material model with free energy function | Model Parameters |
|---|---|---|---|---|
| Human | Uniaxial tension | Various sites | Veronda-Westmann | (e*) C1 = 0.00124±8.78×10⁻⁵ C2 = 1.07±0.148 [23] |
|
| ||||
| Suction | Volar forearm | Extended Mooney Rivlin W = C10(I1−3)+C11(I1−3)(I1−3) | (ivv) C10 = (9.4±3.6) kPa C11 = (82±60) kPa [24] |
|
| Volar forearm | Neo-Hookean W = C1(I1−3) | (ivv) C1,ul = 0.11kPa ** C1,rd = 160kPa [25] |
||
|
| ||||
| Uniaxial tension | Posterior upper arm (straight) | Ogden | (ivv) μ = 9.6kPa α = 35.993 [26] |
|
| Posterior upper arm (bent) | (ivv) μ = 9.6kPa α = 35.993[26] |
|||
| Anterior upper forearm | (ivv) μ = 39.8kPa α = 33.452[26] |
|||
| Anterior lower forearm | (ivv) μ = 2.6kPa α = 35.883[26] |
|||
|
| ||||
| Bi-axial tension | Medial forearm | Ogden | (ivv) μ = 10Pa α = 26 [27] |
|
|
| ||||
| Uniaxial compression | Abdominal | Ogden | (ivtr) μ = 0.1MPa α = 9 |
|
|
| ||||
| Murine | Uniaxial tension | Along the spline | Veronda-Westmann | (e) C1 = 0.000278±0.000118 C2 = 10.2±2.71 [23] |
(e) indicates ex vivo test, (ivv) indicates in vivo test, and (ivtr) indicates in vitro test
In [25] the skin is divided into two layers: upper layer (epidermis + papillary dermis) and the reticular dermis. C is obtained for each layer.
Table 3.
Thermal conductivity, heat capacity, and thermal inertia of healthy skin
| Species | Layer | Thermal conductivity k (W/(m·K)) | Heat capacity C (J/(kg·K)) | Thermal inertia k ρ C (W2·s/(m4·K2))×105 |
|---|---|---|---|---|
| Human | Epidermis | (e*) 0.21 ([28][29]) | ||
| Dermis | (e) 0.29[28] | |||
| Subcutaneous fat | (e) 0.20[28][30] (e) 0.21 [28][31][32] (e) 0.22[28][33] (ivv) 0.21–0.37[28][34] (ivv) 0.23–0.27[16] (ivv) 0.37(upper 2mm) (ivv) 0.54 (cool) |
(e)4.55±0.5[33] | ||
| Skin as a single layer | (ivv) 2.81 (warm)[28][35] (ivv) 0.33–3.14[28][36] (ivv) 0.31[28][37] (ivv) 0.38[28][33] (ivv) 0.29[28] (ivv) 0.50–0.75 (23–25°C)[7] (ivv)0.385–0.393[16] |
(ivv)12.25–25.39[28] (ivv)19.43[28] (ivv)15.76[28][33][38] (ivv)13.13–31.69[28][39] (ivv) 15.76–70.03 [7] (ivv) 15.1±0.9 [40] (e) 9.63 (dry)–13.13(moist)[33] |
||
| Porcine | Epidermis | (ivtr)0.21[41] | (e)3600[41] | |
| Dermis | (ivtr)0.37[41] | (e)3224[41] | ||
| Subcutaneous fat | (ivtr)0.16[41] | (e)2303[41] | ||
| Skin as a single layer | (e) 3349[7] |
(e) indicates ex vivo test, (ivv) indicates in vivo test, and (ivtr) indicates in vitro test
The values reported in literature have been converted to SI units in the table.
Table 4.
Optical absorption and scatter coefficients of healthy human skin [16]
| Layer | Wave length λ (nm) | Absorption coefficient κa (mm−1) | Scatter coefficient κs (mm−1) | Attenuation coefficient κ = κa + κs (mm−1) |
|---|---|---|---|---|
| Skin as one unity | 630 | 0.18 | 39.4 | |
|
| ||||
| Stratum corneum (in vivo*) | 248 | 86.6 | ||
| 265 | 114 | |||
| 280 | 126 | |||
| 302 | 56.4 | |||
| 365 | 22.4 | |||
| 546 | 11.6 | |||
|
| ||||
| Epidermis | 270 | 70–122 | 15–25 | |
| 400 | 6–48 | 5–9.5 | ||
| 600 | 2.5–24 | 2.5–7.0 | ||
|
| ||||
| Epidermis (in vivo) | 248 | 110 | ||
| 265 | 126 | |||
| 280 | 120 | |||
| 302 | 42.3 | |||
| 365 | 23.9 | |||
| 546 | 10.5 | |||
|
| ||||
| Dermis | 633 | 0.27 | 18.7 | 19.0 |
For more detailed summary of optical properties of skin measured in vitro and ex vivo, refer to [42].
Table 6.
Comparison between different imaging modalities for burn assessment
| Imaging Modalities | Invasive | Contact | Cost | Critical post-burn assessment time | Accuracy of clinical trials (in ideal scenarios) | Limitation |
|---|---|---|---|---|---|---|
| Biopsy and histology | Yes | Low | Immediate | ~100% | Diagnosis subjected to observer; can’t monitor burn depth change over time | |
| LDI | No | No | High | ~48 hours | ~100% | Non-tolerant to patient movement, strong ambient light, body curvature or existence of tissue abnormalities and topical substance |
| Thermography | No | No | Low | Within 3 days | ~90% | Non-tolerant to ambient heat disturbance; Time sensitive |
| Vital dyes | Yes | No | Low | A few hours | ~100% | Side effects of the vital dyes; Non-tolerant to topical substance |
| Videomicroscopy | No | Yes | Low | ~24 hours | 90–100% | Small observation area |
| OPSI | No | Yes | Low | N/A | >75% | Over-sensitive to small change; Small observation area; Long scan time |
| RCM | No | Yes | High | Immediate | N/A | Long sampling time; Small observation area |
| MSI | No | No | Depends on customized device | Immediate | 79%–86% | Difficult to interpret results; Lack of standardization in quantifying burn depth |
| OCT | No | No | High | N/A | N/A | Limited penetration depth; small observation area |
| NIRS | No | No | Depends on customized device | Within 1–3 hours | N/A | Lack of standardization in quantifying burn depth |
| Terahertz imaging | No | No | Depends on customized device | As early as 1 hour | N/A | Lack of standardization in quantifying burn depth |
| Ultrasound | No | Yes (conventional) No (non-contact) |
Low | Immediate | >90% | Lack of standardization in quantifying burn depth |
| LSI | No | No | High | As early as 0–24 hours | Comparable to LDI | Unresolved theoretical and practical problems |
| SFDI | No | No | Depends on customized device | From 10 minutes to 72 hours, depending on test subject and parameters | N/A | Lack of standardization in quantifying burn depth |
| Photoacoustic imaging | No | No | Depends on customized device | Immediate | N/A | Small observation area; Lack of standardization in quantifying burn depth |
Highligths.
A summary of properties of skin and subcutaneous tissue is provided.
Prevailing imaging modalities for burn assessment are reviewed and compared.
Burning experiment protocols are summarized.
Models for simulation of burn injury process are reviewed.
Acknowledgments
The authors thank Dr. Rahul for the helpful discussions and gratefully acknowledge the support of this work through National Institute of Health (NIH) grants R01EB010037, R01EB009362, R01EB005807, R01EB014305, R01HL119248, and R44OD018334.
Footnotes
Conflicts of interest: none
Publisher's Disclaimer: This is a PDF file of an unedited manuscript that has been accepted for publication. As a service to our customers we are providing this early version of the manuscript. The manuscript will undergo copyediting, typesetting, and review of the resulting proof before it is published in its final citable form. Please note that during the production process errors may be discovered which could affect the content, and all legal disclaimers that apply to the journal pertain.
References
- 1.American Burn Associations. Burn Incidence Fact Sheet. 2016. [Google Scholar]
- 2.Deitch EA, Wheelahan TM, Rose MP, Clothier J, Cotter J. Hypertrophic burn scars: analysis of variables. J Trauma. 1983;23(10):895–898. [PubMed] [Google Scholar]
- 3.Watts AMI, Tyler MPH, Perry ME, Roberts AHN, McGrouther DA. Burn depth and its histological measurement. Burns. 2001;27(2):154–160. doi: 10.1016/s0305-4179(00)00079-6. [DOI] [PubMed] [Google Scholar]
- 4.Eisenbeiß W, Marotz J, Schrade JP. Reflection-optical multispectral imaging method for objective determination of burn depth. Burns. 1999;25(8):697–704. doi: 10.1016/s0305-4179(99)00078-9. [DOI] [PubMed] [Google Scholar]
- 5.Hoeksema H, Van de Sijpe K, Tondu T, Hamdi M, Van Landuyt K, Blondeel P, Monstrey S. Accuracy of early burn depth assessment by laser Doppler imaging on different days post burn. Burns. 2009;35(1):36–45. doi: 10.1016/j.burns.2008.08.011. [DOI] [PubMed] [Google Scholar]
- 6.McGill DJ, Sørensen K, MacKay IR, Taggart I, Watson SB. Assessment of burn depth: A prospective, blinded comparison of laser Doppler imaging and videomicroscopy. Burns. 2007;33(7):833–842. doi: 10.1016/j.burns.2006.10.404. [DOI] [PubMed] [Google Scholar]
- 7.Stoll AM. Heat transfer in biotechnology. 1967:65–141. [Google Scholar]
- 8.Silver FH, Freeman JW, DeVore D. Viscoelastic properties of human skin and processed dermis. Skin Research and Technology. 2001;7(1):18–23. doi: 10.1034/j.1600-0846.2001.007001018.x. [DOI] [PubMed] [Google Scholar]
- 9.Reihsner R, Balogh B, Menzel EJ. Two-dimensional elastic properties of human skin in terms of an incremental model at the in vivo configuration. Med Eng Phys. 1995;17(4):304–313. doi: 10.1016/1350-4533(95)90856-7. [DOI] [PubMed] [Google Scholar]
- 10.Lavker RM, Zheng PS, Dong G. Aged skin: a study by light, transmission electron, and scanning electron microscopy. J Invest Dermatol. 1987;88(3 Suppl):44s–51s. doi: 10.1111/1523-1747.ep12468934. [DOI] [PubMed] [Google Scholar]
- 11.Clark Ja, Cheng JCY, Leung KS. Mechanical properties of normal skin and hypertrophic scars. Burns. 1996;22(6):443–446. doi: 10.1016/0305-4179(96)00038-1. [DOI] [PubMed] [Google Scholar]
- 12.Church D, Elsayed S, Reid O, Winston B, Lindsay R. Burn wound infections. Clinical Microbiology Reviews. 2006;19(2):403–434. doi: 10.1128/CMR.19.2.403-434.2006. [DOI] [PMC free article] [PubMed] [Google Scholar]
- 13.Jiang SC, Ma N, Li HJ, Zhang XX. Effects of thermal properties and geometrical dimensions on skin burn injuries. Burns. 2002;28(8):713–717. doi: 10.1016/s0305-4179(02)00104-3. [DOI] [PubMed] [Google Scholar]
- 14.Abraham JP, Plourde B, Vallez L, Stark J, Diller KR. Estimating the time and temperature relationship for causation of deep-partial thickness skin burns. Burns. 2015;41(8):1741–1747. doi: 10.1016/j.burns.2015.06.002. [DOI] [PubMed] [Google Scholar]
- 15.Abraham JP, Nelson-Cheeseman BB, Sparrow E, Wentz JE, Gorman JM, Wolf SE. Comprehensive method to predict and quantify scald burns from beverage spills. Int J Hyperth. 2016;32(8) doi: 10.1080/02656736.2016.1211752. [DOI] [PubMed] [Google Scholar]
- 16.Cameron J. Physical Properties of Tissue. A Comprehensive Reference Book, edited by Francis A. Duck. Med Phys. 1991;18(4):834. [Google Scholar]
- 17.Hendriks F. Mechanical Behaviour of Human Skin in Vivo. Bio-medical Eng. 1969;4:322–327. [Google Scholar]
- 18.Manschot JF, Brakkee aJ. The measurement and modelling of the mechanical properties of human skin in vivo--I. The measurement. J Biomech. 1986;19(7):511–515. doi: 10.1016/0021-9290(86)90124-7. [DOI] [PubMed] [Google Scholar]
- 19.Barel AO, Courage W, Clarys P. Suction method for measurement of skin mechanical properties: the Cutometer. In: Serup J, Jemec GBE, Grove GL, editors. Hand-book of Non-Invasive Methods and the skin. CRC Press; 1995. [Google Scholar]
- 20.Diridollou S, Patat F, Gens F, Vaillant L, Black D, Lagarde JM, Gall Y, Berson M. In vivo model of the mechanical properties of the human skin under suction. Skin Res Technol. 2000;6(4):214–221. doi: 10.1034/j.1600-0846.2000.006004214.x. [DOI] [PubMed] [Google Scholar]
- 21.Pailler-Mattei C, Bec S, Zahouani H. In vivo measurements of the elastic mechanical properties of human skin by indentation tests. Med Eng Phys. 2008;30(5):599–606. doi: 10.1016/j.medengphy.2007.06.011. [DOI] [PubMed] [Google Scholar]
- 22.Bader DL, Bowker P. Mechanical characteristics of skin and underlying tissues in vivo. Biomaterials. 1983;4(4):305–308. doi: 10.1016/0142-9612(83)90033-9. [DOI] [PubMed] [Google Scholar]
- 23.Groves RB, Coulman SA, Birchall JC, Evans SL. An anisotropic, hyperelastic model for skin: Experimental measurements, finite element modelling and identification of parameters for human and murine skin. J Mech Behav Biomed Mater. 2013;18:167–180. doi: 10.1016/j.jmbbm.2012.10.021. [DOI] [PubMed] [Google Scholar]
- 24.Hendriks FM, Brokken D, van Eemeren JTWM, Oomens CWJ, Baaijens FPT, Horsten JBaM. A numerical-experimental method to characterize the non-linear mechanical behaviour of human skin. Skin Res Technol. 2003;9(3):274–283. doi: 10.1034/j.1600-0846.2003.00019.x. [DOI] [PubMed] [Google Scholar]
- 25.Hendriks FM, Brokken D, Oomens CWJ, Bader DL, Baaijens FPT. The relative contributions of different skin layers to the mechanical behavior of human skin in vivo using suction experiments. Med Eng Phys. 2006;28(3):259–266. doi: 10.1016/j.medengphy.2005.07.001. [DOI] [PubMed] [Google Scholar]
- 26.Flynn C, Taberner A, Nielsen P. Mechanical characterisation of in vivo human skin using a 3D force-sensitive micro-robot and finite element analysis. Biomech Model Mechanobiol. 2011;10(1):27–38. doi: 10.1007/s10237-010-0216-8. [DOI] [PubMed] [Google Scholar]
- 27.Evans SL, Holt Ca. Measuring the mechanical properties of human skin in vivo using digital image correlation and finite element modelling. J Strain Anal Eng Des. 2009;44(5):337–345. [Google Scholar]
- 28.S. I. of T. Cohen, Myron L (Medical Engineering Laboratory. Measurement of the Thermal Properties of Human Skin. A Review. The Journal of Investigative Dermatology. 1977;69(3):333–338. doi: 10.1111/1523-1747.ep12507965. [DOI] [PubMed] [Google Scholar]
- 29.Lefevre J. Studies on the thermal conductivity of skin in-vivo and the variations induced by changes in the surrounding temperature. Jour Phys. 1901 [Google Scholar]
- 30.Hatfield HS. An apparatus for measuring thermal conductivity of animal tissue. J Phyisol. 1953;120:35–36. [PubMed] [Google Scholar]
- 31.Hatfield HS, Pugh LGC. Thermal Conductivity of Human Fat and Muscle. Nature. 1951;168:918–919. doi: 10.1038/168918a0. [DOI] [PubMed] [Google Scholar]
- 32.Hardy JD, Soderstrom GF. Heat loss from the nude body and peripheral blood flow at temperatures of 22°C to 35°C. J Nutr. 1938;16(5):493–510. [Google Scholar]
- 33.Lipkin M, Hardy JD. Measurement of Some Thermal Properties of Human Tissues. J Appl Physiol. 1954;7(2):212–217. doi: 10.1152/jappl.1954.7.2.212. [DOI] [PubMed] [Google Scholar]
- 34.Daniels F, Baker PT. Relationship between body fat and shivering in air at between body shivering in air at 15 C fat and. J Appl Physiol. 1961;16(3):421–425. doi: 10.1152/jappl.1961.16.3.421. [DOI] [PubMed] [Google Scholar]
- 35.Buttner R. The influence of blood circulation on the transport of heat in the skin. Strahlentherapie. 1936;55:333. [Google Scholar]
- 36.Weaver JA, Stoll AM. Mathematical Model of Skin Exposed to Thermal Radiation. Nav AIR Dev Cent Warm PA Aerosp Med Res DEPT. 1967;NADC-M [PubMed] [Google Scholar]
- 37.Reader S. The effective thermal conductivity of normal and rheumatic tissue in response to cooling. Clin Sci. 1979;11(1):1–12. [PubMed] [Google Scholar]
- 38.Buettner K. Effects of extreme heat and cold on human skin. II. Surface temperature, pain and heat conductivity in experiments with radiant heat. J Appl Physiol. 1951;3(12):703–713. doi: 10.1152/jappl.1951.3.12.703. [DOI] [PubMed] [Google Scholar]
- 39.Stoll AM, Greene LC. Relationship between pain and tissue damage due to thermal radiation. J Appl Physiol. 1959;14(3):373–382. doi: 10.1152/jappl.1959.14.3.373. [DOI] [PubMed] [Google Scholar]
- 40.Derksen WL, Murtha TD, Monahan TI. thermal conductivity and diathermancy of human skin for sources of intense thermal radiation employed in flash burn studies. 1957 doi: 10.1152/jappl.1957.11.2.205. [DOI] [PubMed]
- 41.Henriques JF, Moritz A. Studies of thermal injury: I. The conduction of heat to and through skin and the temperatures attained therein. A theoretical and an experimental investigation. Am J Pathol. 1947;23(4):695–720. [PMC free article] [PubMed] [Google Scholar]
- 42.BASHKATOV AN, GENINA EA, TUCHIN VV. Optical Properties of Skin, Subcutaneous, and Muscle Tissues: a Review. J Innov Opt Health Sci. 2011;4(1):9–38. [Google Scholar]
- 43.Miklavcic D, Pavselj N, Hart FX. Electric properties of tissues. Wiley Encycl Biomed Eng. 2006;209(922834401):1–12. [Google Scholar]
- 44.Monstrey S, Hoeksema H, Verbelen J, Pirayesh A, Blondeel P. Assessment of burn depth and burn wound healing potential. Burns. 2008;34(6):761–769. doi: 10.1016/j.burns.2008.01.009. [DOI] [PubMed] [Google Scholar]
- 45.Devgan L, Bhat S, Aylward S, Spence RJ. Modalities for the assessment of burn wound depth. J Burns Wounds. 2006;5:e2. [PMC free article] [PubMed] [Google Scholar]
- 46.Moritz AR. Studies of Thermal Injury III. The pathology and pathogenesis of cutaneous burns an experimental study. Am J Pathol. 1947;23(6):915–941. [PMC free article] [PubMed] [Google Scholar]
- 47.Chvapil M, Speer DP, Owen JA, Chvapil TA, CM, SDP, OJA, CTA Identification of the depth of burn injury by collagen stainability. Plast Reconstr Surg. 1984;73(3):438–441. doi: 10.1097/00006534-198403000-00018. [DOI] [PubMed] [Google Scholar]
- 48.Singer AJ, Berruti L, Thode HC, McClain Sa. Standardized burn model using a multiparametric histologic analysis of burn depth. Acad Emerg Med. 2000;7(1):1–6. doi: 10.1111/j.1553-2712.2000.tb01881.x. [DOI] [PubMed] [Google Scholar]
- 49.Forrester KR, Tulip J, Leonard C, Stewart C, Bray RC. A Laser Speckle Imaging Technique for Measuring Tissue Perfusion. IEEE Trans Biomed Eng. 2004;51(11):2074–2084. doi: 10.1109/TBME.2004.834259. [DOI] [PubMed] [Google Scholar]
- 50.Jackson DM. The diagnosis of the depth of burning. Br J Surg. 1953;40(164):588–596. doi: 10.1002/bjs.18004016413. [DOI] [PubMed] [Google Scholar]
- 51.Zawacki BE. Reversal of capillary stasis and prevention of necrosis in burns. Ann Surg. 1974;180(1):98–102. doi: 10.1097/00000658-197407000-00015. [DOI] [PMC free article] [PubMed] [Google Scholar]
- 52.Boykin JV, Eriksson E, Pittman RN. In vivo microcirculation of a scald burn and the progression of postburn dermal ischemia. Plast Reconstr Surg. 1980;66(2):191–198. doi: 10.1097/00006534-198008000-00002. [DOI] [PubMed] [Google Scholar]
- 53.Niazi ZBM, Essex TJH, Papini R, Scott D, McLean NR, Black MJM. New laser doppler scanner, a valuable adjunct in burn depth assessment. Burns. 1993;19(6):485–489. doi: 10.1016/0305-4179(93)90004-r. [DOI] [PubMed] [Google Scholar]
- 54.Pape SA, Skouras CA, Byrne PO. An audit of the use of laser Doppler imaging (LDI) in the assessment of burns of intermediate depth. Burns. 2001;27(3):233–239. doi: 10.1016/s0305-4179(00)00118-2. [DOI] [PubMed] [Google Scholar]
- 55.Holland AJ, Martin HC, Cass D. Laser Doppler imaging prediction of burn wound outcome in children. Burns. 2002;28(1):11–17. doi: 10.1016/s0305-4179(01)00064-x. [DOI] [PubMed] [Google Scholar]
- 56.Nguyen K, Ward D, Lam L, Holland AJA. Laser Doppler Imaging prediction of burn wound outcome in children: Is it possible before 48 h? Burns. 2010;36(6):793–798. doi: 10.1016/j.burns.2009.11.016. [DOI] [PubMed] [Google Scholar]
- 57.Renkielska A, Nowakowski A, Kaczmarek M, Dobke MK, Grudziński J, Karmolinski A, Stojek W. Static thermography revisited - An adjunct method for determining the depth of the burn injury. Burns. 2005;31(6):768–775. doi: 10.1016/j.burns.2005.04.006. [DOI] [PubMed] [Google Scholar]
- 58.Renkielska A, Nowakowski A, Kaczmarek M, Ruminski J. Burn depths evaluation based on active dynamic IR thermal imaging-A preliminary study. Burns. 2006;32(7):867–875. doi: 10.1016/j.burns.2006.01.024. [DOI] [PubMed] [Google Scholar]
- 59.Liddington MI, Shakespeare PG. Timing of the thermographic assessment of burns. Burns. 1996;22(1):26–28. doi: 10.1016/0305-4179(95)00076-3. [DOI] [PubMed] [Google Scholar]
- 60.Atiyeh BS, Gunn SW, Hayek SN. State of the art in burn treatment. World Journal of Surgery. 2005;29(2):131–148. doi: 10.1007/s00268-004-1082-2. [DOI] [PubMed] [Google Scholar]
- 61.Kaiser M, Yafi A, Cinat M, Choi B, Durkin AJ. Noninvasive assessment of burn wound severity using optical technology: A review of current and future modalities. Burns. 2011;37(3):377–386. doi: 10.1016/j.burns.2010.11.012. [DOI] [PMC free article] [PubMed] [Google Scholar]
- 62.Still JM, Law EJ, Klavuhn KG, Island TC, Holtz JZ. Diagnosis of burn depth using laser-induced indocyanine green fluorescence: a preliminary clinical trial. Burns. 2001;27(4):364–71. doi: 10.1016/s0305-4179(00)00140-6. [DOI] [PubMed] [Google Scholar]
- 63.Sheridan RL, Schomaker KT, Lucchina LC, Hurley J, Yin LM, Tompkins RG, Jerath M, Torri A, Greaves KW, Bua DP. Burn depth estimation by use of indocyanine green fluorescence: initial human trial. J Burn Care Rehabil. 1995;16(6):602–604. doi: 10.1097/00004630-199511000-00007. [DOI] [PubMed] [Google Scholar]
- 64.Haslik W, Kamolz LP, Andel H, Winter W, Meissl G, Frey M. The influence of dressings and ointments on the qualitative and quantitative evaluation of burn wounds by ICG video-angiography: An experimental setup. Burns. 2004;30(3):232–235. doi: 10.1016/j.burns.2003.10.016. [DOI] [PubMed] [Google Scholar]
- 65.Benya R, Quintana J, Brundage B. Adverse reactions to indocyanine green: a case report and a review of the literature. 1989;17:231–233. doi: 10.1002/ccd.1810170410. [DOI] [PubMed] [Google Scholar]
- 66.Kamolz LP, Andel H, Haslik W, Donner A, Winter W, Meissl G, Frey M. Indocyanine green video angiographies help to identify burns requiring operation. Burns. 2003;29(8):785–791. doi: 10.1016/s0305-4179(03)00200-6. [DOI] [PubMed] [Google Scholar]
- 67.Mihara K, Shindo H, Ohtani M, Nagasaki K, Nakashima R, Katoh N, Kishimoto S. Early depth assessment of local burns by videomicroscopy: 24 h after injury is a critical time point. Burns. 2011;37(6):986–993. doi: 10.1016/j.burns.2011.03.007. [DOI] [PubMed] [Google Scholar]
- 68.Mihara K, Shindo H, Mihara H, Ohtani M, Nagasaki K, Katoh N. Early depth assessment of local burns by videomicroscopy: A novel proposed classification. Burns. 2012;38(3):371–377. doi: 10.1016/j.burns.2011.08.020. [DOI] [PubMed] [Google Scholar]
- 69.Milner SM, Bhat S, Gulati S, Gherardini G, Smith CE, Bick RJ. Observations on the microcirculation of the human burn wound using orthogonal polarization spectral imaging. Burns. 2005;31(3):316–319. doi: 10.1016/j.burns.2004.10.014. [DOI] [PubMed] [Google Scholar]
- 70.Goertz O, Ring A, Kohlinger A, Daigeler A, Andree C, Steinau HU, Langer S. Orthogonal polarization spectral imaging, A Tool for Assessing Burn Depths? Ann Plast Surg. 2010;64(21):217–221. doi: 10.1097/SAP.0b013e3181a1473b. [DOI] [PubMed] [Google Scholar]
- 71.Calzavara-Pinton P, Longo C, Venturini M, Sala R, Pellacani G. Reflectance Confocal Micrscopy for In Vivo Skin Imaging. Photochem Photobiol. 2008;84(6):1421–1430. doi: 10.1111/j.1751-1097.2008.00443.x. [DOI] [PubMed] [Google Scholar]
- 72.Altintas MA, Altintas AA, Knobloch K, Guggenheim M, Zweifel CJ, Vogt PM. Differentiation of superficial-partial vs. deep-partial thickness burn injuries in vivo by confocal-laser-scanning microscopy. Burns. 2009;35(1):80–86. doi: 10.1016/j.burns.2008.05.003. [DOI] [PubMed] [Google Scholar]
- 73.Afromowitz MA, Van Liew GS, Heimbach DM. Clinical Evaluation of Burn Injuries Using an Optical Reflectance Technique. IEEE Trans Biomed Eng. 1987;BME-34(2):114–127. doi: 10.1109/tbme.1987.326036. [DOI] [PubMed] [Google Scholar]
- 74.Afromowitz MA, Callis JB, Heimbach DM, DeSoto La, Norton MK. Multispectral imaging of burn wounds: a new clinical instrument for evaluating burn depth. IEEE Trans Biomed Eng. 1988;35(10):842–50. doi: 10.1109/10.7291. [DOI] [PubMed] [Google Scholar]
- 75.King DR, Li W, Squiers JJ, Mohan R, Sellke E, Mo W, Zhang X, Fan W, Dimaio JM, Thatcher JE. Surgical wound debridement sequentially characterized in a porcine burn model with multispectral imaging. Burns. 2015;41(7):1478–1487. doi: 10.1016/j.burns.2015.05.009. [DOI] [PubMed] [Google Scholar]
- 76.Park BH, Saxer C, Srinivas SM, Nelson JS, de Boer JF. In vivo burn depth determination by high-speed fiber-based polarization sensitive optical coherence tomography. J Biomed Opt. 2001;6(4):474–479. doi: 10.1117/1.1413208. [DOI] [PubMed] [Google Scholar]
- 77.Jiao S, Yu W, Stoica G, Wang L. Contrast Mechanisms in Polarization-Sensitive Mueller-Matrix Optical Coherence Tomography and Apllication in Burn Imaging. Appl Opt. 2003;42(25):5191. doi: 10.1364/ao.42.005191. [DOI] [PubMed] [Google Scholar]
- 78.Kim KH, Pierce MC, Maguluri G, Park BH, Yoon SJ, Lydon M, Sheridan R, de Boer JF. In vivo imaging of human burn injuries with polarization-sensitive optical coherence tomography. J Biomed Opt. 2012;17(6):66012. doi: 10.1117/1.JBO.17.6.066012. [DOI] [PubMed] [Google Scholar]
- 79.Morgner U, Drexler W, Kärtner FX, Pitris XDL, Ippen CEP, Fujimoto JG, Li XD, Pitris C. Spectroscopic optical coherence tomography. Opt Lett. 2000;25(2):111. doi: 10.1364/ol.25.000111. [DOI] [PubMed] [Google Scholar]
- 80.Maher JR, Jaedicke V, Medina M, Levinson H, Selim MA, Brown WJ, Wax A. In vivo analysis of burns in a mouse model using spectroscopic optical coherence tomography. Opt Lett. 2014;39(19):5594–5597. doi: 10.1364/OL.39.005594. [DOI] [PMC free article] [PubMed] [Google Scholar]
- 81.Zhao Y, Maher JR, Kim J, Selim MA, ALevinson H, Wax A. Evaluation of burn severity in vivo in a mouse model using spectroscopic optical coherence tomography. Biomed Opt Express. 2015;6(9):3339–3345. doi: 10.1364/BOE.6.003339. [DOI] [PMC free article] [PubMed] [Google Scholar]
- 82.Sowa MG, Leonardi L, Payette JR, Cross KM, Gomez M, Fish JS. Classification of burn injuries using near-infrared spectroscopy. J Biomed Opt. 2006;11(5):54002-1-54002–6. doi: 10.1117/1.2362722. [DOI] [PubMed] [Google Scholar]
- 83.Cross KM, Hastings MA, Payette JR, Gomez M, Schattka BJ, Sowa MG, Leonardi L, Fish JS. Near infrared point and imaging spectroscopy for burn depth assessment. Int Congr Ser. 2005;1281:137–142. [Google Scholar]
- 84.Cross KM, Leonardi L, Payette JR, Gomez M, Levasseur MA, Schattka BJ, Sowa MG, Fish JS. Clinical utilization of near-infrared spectroscopy devices for burn depth assessment. Wound Repair Regen. 2007;15(3):332–340. doi: 10.1111/j.1524-475X.2007.00235.x. [DOI] [PubMed] [Google Scholar]
- 85.Arbab MH, Winebrenner DP, Dickey TC, Chen A, Klein MB, Mourad PD. Terahertz spectroscopy for the assessment of burn injuries in vivo. J Biomed Opt. 2013;18(7):77004. doi: 10.1117/1.JBO.18.7.077004. [DOI] [PubMed] [Google Scholar]
- 86.Taylor ZD, Singh RS, Culjat MO, Suen JY, Grundfest WS, Lee H, Brown ER. Reflective terahertz imaging of porcine skin burns. Opt Lett. 2008;33(11):1258–1260. doi: 10.1364/ol.33.001258. [DOI] [PubMed] [Google Scholar]
- 87.Mittleman DM, Gupta M, Neelamani R, Baraniuk RG, Rudd JV, Koch M. Recent advances in terahertz imaging. Appl Phys B Lasers Opt. 1999;68(6):1085–1094. [Google Scholar]
- 88.Tewari P, Kealey CP, Bennett DB, Bajwa N, Barnett KS, Singh RS, Culjat MO, Stojadinovic A, Grundfest WS, Taylor ZD. In vivo terahertz imaging of rat skin burns. J Biomed Opt. 2012;17(4):0405031–0405033. doi: 10.1117/1.JBO.17.4.040503. [DOI] [PubMed] [Google Scholar]
- 89.Dougherty JP, Jubic GD, Kiser JWL. Terahertz imaging of burned tissue. Proc SPIE. 2007;6472:64720N–64720N9. [Google Scholar]
- 90.Goans RE, Cantrell JHJ, Meyers FB. Ultrasonic pulse-echo determination of thermal injury in deep dermal burns. Med Phys. 1977;4(3):259–263. doi: 10.1118/1.594376. [DOI] [PubMed] [Google Scholar]
- 91.Kalus A, Aindow J, Caulfield M. APPLICATION OF ULTRASOUND IN ASSESSING BURN DEPTH. Lancet. 1979;313(8109):188–189. doi: 10.1016/s0140-6736(79)90583-x. [DOI] [PubMed] [Google Scholar]
- 92.Brink J, Sheets P, Dines K, Etchison M, Hanke C, Sadove A. Quantitative assessment of burn injury in porcine skin with high-frequency ultrasonic imaging. Invest Radiol. 1986;21(8):645–651. doi: 10.1097/00004424-198608000-00008. [DOI] [PubMed] [Google Scholar]
- 93.Lin YH, Huang CC, Wang SH. Quantitative assessments of burn degree by high-frequency ultrasonic backscattering and statistical model. Phys Med Biol. 2011;56(3):757–73. doi: 10.1088/0031-9155/56/3/014. [DOI] [PubMed] [Google Scholar]
- 94.Iraniha S, Cinat ME, VanderKam VM, Boyko A, Lee D, Jones J, Achauer BM. Determination of burn depth with noncontact ultrasonography. J Burn Care Rehabil. 2000;21(4):333–338. doi: 10.1067/mbc.2000.106391. [DOI] [PubMed] [Google Scholar]
- 95.Briers JD. Laser Doppler, speckle and related techniques for blood perfusion mapping and imaging. Physiol Meas. 2001;22(4):R35–R66. doi: 10.1088/0967-3334/22/4/201. [DOI] [PubMed] [Google Scholar]
- 96.Stewart CJ, Frank R, Forrester KR, Tulip J, Lindsay R, Bray RC. A comparison of two laser-based methods for determination of burn scar perfusion: Laser Doppler versus laser speckle imaging. Burns. 2005;31(6):744–752. doi: 10.1016/j.burns.2005.04.004. [DOI] [PubMed] [Google Scholar]
- 97.Millet C, Roustit M, Blaise S, Cracowski JL. Comparison between laser speckle contrast imaging and laser Doppler imaging to assess skin blood flow in humans. Microvasc Res. 2011;82(2):147–151. doi: 10.1016/j.mvr.2011.06.006. [DOI] [PubMed] [Google Scholar]
- 98.Lindahl F, Tesselaar E, Sjöberg F. Assessing paediatric scald injuries using laser speckle contrast imaging. Burns. 2013;39(4):662–666. doi: 10.1016/j.burns.2012.09.018. [DOI] [PubMed] [Google Scholar]
- 99.Briers D, Duncan DD, Hirst E, Kirkpatrick SJ, Larsson M, Steenbergen W, Stromberg T, Thompson OB. Laser speckle contrast imaging: theoretical and practical limitations. J Biomed Opt. 2013;18(6):66018-1-66018–9. doi: 10.1117/1.JBO.18.6.066018. [DOI] [PubMed] [Google Scholar]
- 100.Mazhar A, Saggese S, Pollins AC, Cardwell NL, Nanney L, Cuccia DJ. Noncontact imaging of burn depth and extent in a porcine model using spatial frequency domain imaging. J Biomed Opt. 2014;19(8):86019. doi: 10.1117/1.JBO.19.8.086019. [DOI] [PMC free article] [PubMed] [Google Scholar]
- 101.Nguyen JQ, Crouzet C, Mai T, Riola K, Uchitel D, Liaw LH, Bernal N, Ponticorvo A, Choi B, Durkin AJ. Spatial frequency domain imaging of burn wounds in a preclinical model of graded burn severity. J Biomed Opt. 2013;18(6):66010. doi: 10.1117/1.JBO.18.6.066010. [DOI] [PMC free article] [PubMed] [Google Scholar]
- 102.TALBERT RJ. PHOTOACOUSTIC DISCRIMINATION OF VIABLE AND THERMALLY COAGULATED BLOOD FOR BURN INJURY IMAGING. University of Missouri; Columbia: 2007. [DOI] [PubMed] [Google Scholar]
- 103.Zhang HF, Maslov K, Stoica G, Wang LV. Functional photoacoustic microscopy for high-resolution and noninvasive in vivo imaging. Nat Biotechnol. 2006;24(7):848–851. doi: 10.1038/nbt1220. [DOI] [PubMed] [Google Scholar]
- 104.Sato S, Yamazaki M, Saitoh D, Tsuda H, Okada Y, Obara M, Ashida H. Photoacoustic diagnosis of burns in rats. J Trauma. 2005;59(6):1450–1456. doi: 10.1097/01.ta.0000197389.94466.04. [DOI] [PubMed] [Google Scholar]
- 105.Zhang HF, Maslov K, Stoica G, Wang LV. Imaging acute thermal burns by photoacoustic microscopy. J Biomed Opt. 2006;11(5):54033–54035. doi: 10.1117/1.2355667. [DOI] [PubMed] [Google Scholar]
- 106.Ida T, Iwazaki H, Kawaguchi Y, Kawauchi S, Ohkura T, Iwaya K, Tsuda H, Saitoh D, Sato S, Iwai T. Burn depth assessments by photoacoustic imaging and laser Doppler imaging. Wound Repair Regen. 2015:349–355. doi: 10.1111/wrr.12374. [DOI] [PubMed] [Google Scholar]
- 107.Nam SY, Chung E, Suggs LJ, Emelianov SY. Combined Ultrasound and Photoacoustic Imaging to Noninvasively Assess Burn Injury and Selectively Monitor a Regenerative Tissue-Engineered Construct. Tissue Eng Part C Methods. 2015;21(6):557–566. doi: 10.1089/ten.tec.2014.0306. [DOI] [PMC free article] [PubMed] [Google Scholar]
- 108.Iftimia N, Ferguson RD, Mujat M, Patel AH, Zhang EZ, Fox W, Rajadhyaksha M. Combined reflectance confocal microscopy/optical coherence tomography imaging for skin burn assessment. Biomed Opt Express. 2013;4(5):680–695. doi: 10.1364/BOE.4.000680. [DOI] [PMC free article] [PubMed] [Google Scholar]
- 109.Ponticorvo A, Burmeister DM, Yang B, Choi B, Christy RJ, Durkin AJ. Quantitative assessment of graded burn wounds in a porcine model using spatial frequency domain imaging (SFDI) and laser speckle imaging (LSI) Biomed Opt Express. 2014;5(10):3467–81. doi: 10.1364/BOE.5.003467. [DOI] [PMC free article] [PubMed] [Google Scholar]
- 110.Moritz AR, Henriques FC. Studies of Thermal Injury II. The relative importance of time and surface temperature in the causation of cutaneous burns. Am J Pathol. 1947;23:695–720. [PMC free article] [PubMed] [Google Scholar]
- 111.Dewhirst MW, Viglianti BL, Lora-Michiels M, Hanson M, Hoopes PJ. Basic principles of thermal dosimetry and thermal thresholds for tissue damage from hyperthermia. Int J Hyperth. 2003;19(3):267–294. doi: 10.1080/0265673031000119006. [DOI] [PubMed] [Google Scholar]
- 112.Viglianti BL, Dewhirst MW, Abraham JP, Gorman JM, Sparrow EM. Rationalization of thermal injury quantification methods: Application to skin burns. Burns. 2014;40(5):896–902. doi: 10.1016/j.burns.2013.12.005. [DOI] [PubMed] [Google Scholar]
- 113.Bailey BN, Lewis SR, Blocker JTG. standarization of experimental burns in the laboratory rat. Tex Rep Biol Med. 1962;20(20):20–29. [Google Scholar]
- 114.Cuttle L, Kempf M, Phillips GE, Mill J, Hayes MT, Fraser JF, Wang XQ, Kimble RM. A porcine deep dermal partial thickness burn model with hypertrophic scarring. Burns. 2006;32(7):806–820. doi: 10.1016/j.burns.2006.02.023. [DOI] [PubMed] [Google Scholar]
- 115.Venter NG, Monte-Alto-Costa A, Marques RG. A new model for the standardization of experimental burn wounds. Burns. 2015;41(3):542–547. doi: 10.1016/j.burns.2014.08.002. [DOI] [PubMed] [Google Scholar]
- 116.Branski LK, Mittermayr R, Herndon DN, Norbury WB, Masters OE, Hofmann M, Traber DL, Redl H, Jeschke MG. A porcine model of full-thickness burn, excision and skin autografting. Burns. 2008;34(8):1119–1127. doi: 10.1016/j.burns.2008.03.013. [DOI] [PMC free article] [PubMed] [Google Scholar]
- 117.Gaines C, Poranki D, Du W, Clark RAF, Van Dyke M. Development of a porcine deep partial thickness burn model. Burns. 2013;39(2):311–319. doi: 10.1016/j.burns.2012.06.011. [DOI] [PubMed] [Google Scholar]
- 118.Sheu SY, Wang WL, Fu YT, Lin SC, Lei YC, Liao JH, Tang NY, Kuo TF, Yao CH. The pig as an experimental model for mid-dermal burns research. Burns. 2014;40(8):1679–1688. doi: 10.1016/j.burns.2014.04.023. [DOI] [PubMed] [Google Scholar]
- 119.Singer AJ, Taira BR, Anderson R, McClain SA, Rosenberg L. Does pressure matter in creating burns in a porcine model? J Burn Care Res. 2010;31(4):646–651. doi: 10.1097/BCR.0b013e3181e4ca73. [DOI] [PubMed] [Google Scholar]
- 120.Pearse HE, Payne JT, Hogg L. The Experimental Study of Flash Burns. Ann Surg. 1949;130(4):774–87. [PMC free article] [PubMed] [Google Scholar]
- 121.Sullivan TP, Eaglstein WH, Davis SC, Mertz P. The pig as a model for human wound healing. Wound repair Regen. 2001;9(2):66–76. doi: 10.1046/j.1524-475x.2001.00066.x. [DOI] [PubMed] [Google Scholar]
- 122.Ross D, Diller K. An experimental investigation of burn injury in living tissue. J Heat Transfer. 1976 May;:292–296. [Google Scholar]
- 123.Henriques FC. Studies of thermal injury; the predictability and the significance of thermally induced rate processes leading to irreversible epidermal injury. Arch Pathol. 1947;43(5):489–502. [PubMed] [Google Scholar]
- 124.Orgill DP, Solari MG, Barlow MS, O’Connor NE. A finite-element model predicts thermal damage in cutaneous contact burns. J Burn Care Rehabil. 1998;19(3):203–209. doi: 10.1097/00004630-199805000-00003. [DOI] [PubMed] [Google Scholar]
- 125.Ng EYK, Chua LT. Prediction of skin burn injury. Part 2: Parametric and sensitivity analysis. Proc Inst Mech Eng H. 2002;216(3):171–183. doi: 10.1243/0954411021536388. [DOI] [PubMed] [Google Scholar]
- 126.Fugitt CE. A rate process of thermal injury. Armed Forces Special Weapons Project. 1955:AFSWP-606. [Google Scholar]
- 127.Takata A. Development of criterion for skin burns. Aerosp Med. 1974;45(6):634–637. [Google Scholar]
- 128.Wu YC. A Modified Criterion for Predicting Thermal Injury. National Bureau of Standards; Washington: 1982. [Google Scholar]
- 129.Pennes H. Analysis of tissue and arterial blood temperatures in the resting human forearm. J Appl Physiol. 1948;1(2):93–122. doi: 10.1152/jappl.1948.1.2.93. [DOI] [PubMed] [Google Scholar]
- 130.Diller KR. Modeling of bioheat transfer processes at high and low temperatures. Adv Heat Transf. 1992;22:157–357. [Google Scholar]
- 131.Diller KR, Hayes LJ. A finite element model of burn injury in blood-perfused skin. J Biomech Eng. 1983;105(3):300–307. doi: 10.1115/1.3138423. [DOI] [PubMed] [Google Scholar]
- 132.Aliouat Bellia S, Saidane A, Hamou A, Benzohra M, Saiter JM. Transmission line matrix modelling of thermal injuries to skin. Burns. 2008;34(5):688–697. doi: 10.1016/j.burns.2007.09.003. [DOI] [PubMed] [Google Scholar]
- 133.Johnson NN, Abraham JP, Helgeson ZI, Minkowycz WJ, Sparrow EM. An Archive of Skin-Layer Thicknesses and Properties and Calculations of Scald Burns With Comparisons to Experimental Observations. J Therm Sci Eng Appl. 2011;3(1):11003. [Google Scholar]
- 134.Abraham JP, Hennessey MP, Minkowycz WJ. A simple algebraic model to predict burn depth and injury. Int Commun Heat Mass Transf. 2011;38(9):1169–1171. [Google Scholar]
- 135.Bourdon RT, Nelson-Cheeseman BB, Abraham JP. Prediction, Identification, and Initial Treatment Guide for Scald Injuries. Austin J Emerg Crit Care Med. 2016;3(1):1–7. [Google Scholar]
- 136.Xu F, Seffen KA, Lu TJ. Non-Fourier analysis of skin biothermomechanics. Int J Heat Mass Transf. 2008;51(9–10):2237–2259. [Google Scholar]
- 137.Liu J, Lu W. Dual reciprocity boundary element method for solving thermal wave model of bioheat transfer. Hang tian yi xue yu yi xue gong cheng= Sp Med Med Eng. 1997;10(6):391–395. [PubMed] [Google Scholar]
- 138.Dai W, Wang H, Jordan PM, Mickens RE, Bejan A. A mathematical model for skin burn injury induced by radiation heating. Int J Heat Mass Transf. 2008;51(23–24):5497–5510. [Google Scholar]
- 139.Liu J, Chen X, Xu LX. New thermal wave aspects on bum evaluation of skin subjected to instantaneous heating. IEEE Trans Biomed Eng. 1999;46(4):420–428. doi: 10.1109/10.752939. [DOI] [PubMed] [Google Scholar]
- 140.Lin CT, Liu KC. Analysis of thermal response in a tissue based on thermal wave model,” 3CA 2010 – 2010. Int Symp Comput Commun Control Autom. 2010;2(6):25–28. [Google Scholar]
- 141.Özen Ş, Helhel S, Çerezci O. Heat analysis of biological tissue exposed to microwave by using thermal wave model of bio-heat transfer (TWMBT) Burns. 2008;34(1):45–49. doi: 10.1016/j.burns.2007.01.009. [DOI] [PubMed] [Google Scholar]
- 142.Tzou DY. Macro- to Microscale Heat Transfer: The Lagging Behavior. 2. 2014. [Google Scholar]
- 143.Xu F, Lu T, Seffen KA. Dual-Phase-Lag model of skin bioheat transfer. Biomed. Eng. Informatics New Dev. Futur. - Proc. 1st Int. Conf. Biomed. Eng. Informatics, BMEI; 2008; 2008. pp. 505–511. [Google Scholar]
- 144.Liu KC, Wang YN, Chen YS. Investigation on the bio-heat transfer with the dual-phase-lag effect. Int J Therm Sci. 2012;58:29–35. [Google Scholar]