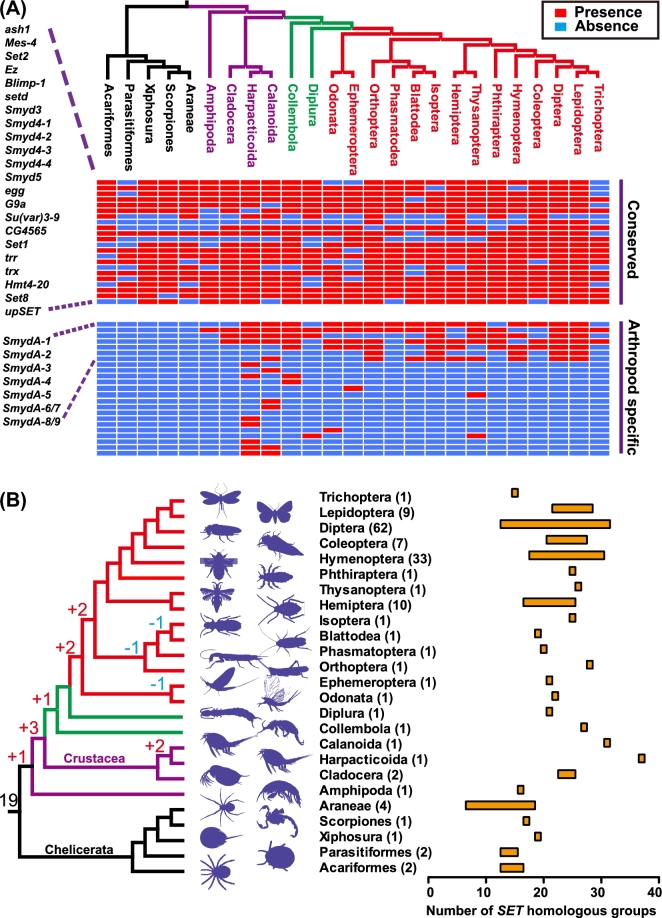
Figure 2:
Diversification of arthropod-specific SET genes. (A) Distribution pattern of SET genes in arthropod orders. One representative is elected for each order. Red color indicates the presence of SET genes, and blue color indicates the absence of SET genes. (B) Inference of ancestral sets of SET homologous groups along the evolution of insects. The gains and losses of SET homologous groups are indicated in the internal nodes of the phylogenetic tree. The number in parentheses indicates the number of species in each order. The bars indicate the number ranges of SET homologous groups in each order.

