Abstract
In the last twenty years, new imaging techniques to assess atrial function and to predict the risk of recurrence of atrial fibrillation after treatment have been developed. The present review deals with the role of these techniques in the detection of structural and functional changes of the atrium and diagnosis of atrial remodeling, particularly atrial fibrosis. Echocardiography allows the detection of anatomical, functional changes and deformation of the atrial wall during the phases of the cardiac cycle. For this, adequate acquisition of atrial images is necessary using speckle tracking imaging and interpretation of the resulting strain and strain rate curves. This allows to predict new-onset atrial fibrillation and recurrences. Its main limitations are inter-observer variability, the existence of different software manufacturers, and the fact that the software used were originally developed for the evaluation of the ventricular function and are now applied to the atria. Cardiac magnetic resonance, using contrast enhancement with gadolinium, plays a key role in the visualization and quantification of atrial fibrosis. This is the established method for in vivo visualization of myocardial fibrotic tissue. The non-invasive evaluation of atrial fibrosis is associated with the risk of recurrence of atrial fibrillation and with electro-anatomical endocardial mapping. We discuss the limitations of these techniques, derived from the difficulty of demonstrating the correlation between fibrosis imaging and histology, and poor intra- and inter-observer reproducibility. The sources of discordance are described, mainly due to image acquisition and processing, and the challenges ahead in an attempt to eliminate differences between operators.
Keywords: Atrial fibrillation, Atrial fibrosis, Cardiac magnetic resonance imaging, Speckle tracking echocardiography, Strain
1. Introduction
Atrial fibrillation (AF) is the most common arrhythmia in the world, occurring in more than 2% of the general population. AF is the main cause of cardioembolic stroke and its frequency is expected to increase due to population aging, since its prevalence increases with age.[1],[2] The pathophysiology of arrhythmia is not fully understood, but animal and human experimental models have shown multiple pathways of disease that may favor the formation and propagation of an abnormal impulse. In the last 20 years, new imaging techniques have emerged to evaluate atrial function and to predict the risk of AF recurrence after treatment. Echocardiography and cardiac magnetic resonance imaging (CMRI) have been adapted specifically for the management of patients with this arrhythmia. The present review summarizes the role of cardiac imaging in the diagnosis of atrial remodeling, especially atrial fibrosis, by comparing imaging techniques that can detect changes in atrial structure and function.
The atrial myopathy hypothesis proposes that atrial fibrosis increases the risk of thromboembolism independently of atrial rhythm,[3] and can be visualized and quantified with delayed contrast enhancement (DCE) in CMRI, but may manifest as atrial growth, decreased atrial systolic function, and the daily burden of AF, all of which have been associated with stroke.[4]
Several studies have shown that prolonged AF episodes are accompanied by tachycardia-inducing atrial myopathy.[5],[6] In patients with AF and concomitant predisposing conditions, histopathological atrial myopathy is characterized by the following findings: fibroblast activation, increased connective tissue and varying degrees of interstitial fibrosis, with more or less marked loss of sarcomeres, accumulation of glycogen in the atrial cardiomyocytes,[7] atrial fat infiltration, inflammatory infiltrates, myocyte hypertrophy, necrosis and amyloidosis.[8] These changes are believed to be the product of a complex interaction between external stressors such as aging, cardiac structural disease, stretching of the atrial wall (as occurs in hypertensive patients, possibly in diabetics, patients with heart failure or mitral valvulopathy), electrical alterations, endothelial dysfunction, atrial inflammation, neurohormonal alterations,[4] and genetic predisposition. Increased expression of the angiotensin converting enzyme and increased amounts of extracellular signal-regulated kinases (Erk1/Erk2) in atrial tissue have been demonstrated in humans with AF.[9] All this, but also the AF itself, induces a slow but progressive process of structural remodeling in the atrium.[10] Structural remodeling results in an electrical dissociation between muscle bundles, with heterogeneous local conduction, favoring reentry and perpetuation of the arrhythmia.[11] In many patients, structural remodeling occurs before AF and functional and structural changes in the atrial myocardium and blood stasis cause a pro-thrombotic environment.[12] Finally, the term atrial fibrotic cardiomyopathy describes a specific, primary form of bi-atrial pathology, characterized by extensive fibrosis as the underlying substrate of atrial arrhythmia and thromboembolism.[13],[14]
2. Echocardiography
2.1. Atrial function
The left atrium (LA) acts as a reservoir, receiving blood from the pulmonary veins during left ventricular (LV) systole; as a conduit, passively transferring blood to the LV during early diastole; and it has a pump function, actively driving blood to the LV in late diastole.[15] In normal subjects, the reservoir, conduit and pump phases of LA contribute 40%, 35%, and 25% to stroke volume, respectively. Tissue Doppler imaging (TDI) was the first echocardiographic technique to assess atrial function; however it is limited by low reproducibility, is angle dependent and there are artifacts in the signal. TDI is largely independent of translational effects due to the adjacent myocardial segments. Speckle tracking echocardiography (STE) using two-dimensional echocardiography (2DE) may overcome these limitations.[15]–[17] STE is a non-Doppler method that allows objective quantification of atrial deformation derived from standard 2DE images, and the strain (ε) and longitudinal strain rate (SR) of LA segments can be analyzed by evaluation of the deformation of an object in relation to its original length.
2.2. Acquisition and interpretation of STE images
The acquisition of images should be standardized using the zoom, defining the optimal frame rate and a standardized reference point (Figure 1). Thus, if the reference point is the R wave[18] or the P waveform of the ECG,[19] the values of ε can vary by as much as 50%. The use of the P wave as a reference point is not applicable to patients with atrial arrhythmia. The longitudinal deformation of LA is an excellent parameter for assessing its function under different conditions, as has recently been noted by a committee of experts,[14] especially in the reservoir phase of LA, when peak elongation or maximum compliance of LA occurs, which is represented by a positive increased value of ε or SR in normal subjects but decreased in AF patients with atrial fibrosis. 2DE STE is an angle-independent technique that allows analyzing ε and SR in 94% of normal subjects.[20] With this definition, ε is a dimensionless relationship and is expressed as a percentage, while SR represents the rate at which myocardial deformation (expressed as S−1) occurs. In sinus rhythm, STE can identify a positive peak ε corresponding to the reservoir phase during LV systole (Figure 2, yellow arrow), directly related to LA compliance, and a negative peak related with atrial contraction or atrial pump function (Figure 2, pink arrow). SR during diastole of LV identifies two negative peaks, the first corresponds to the early passive filling of LV (Figure 3, red arrow) and the second to the LA pump function (Figure 3, green arrow). In AF, effective atrial contraction is interrupted. As a consequence a loss of atrial pump function occurs, and one of the two negative peaks of SR curves disappears (Figure 4, blue arrow). In addition, the reduction of atrial compliance due to atrial fibrosis causes a worsening of the reservoir function that is detected even before atrial dilatation occurs, and reduced ε is observed during this phase (Figure 5, orange arrow).
Figure 1. Two-dimensional transthoracic echocardiography with speckle tracking imaging.
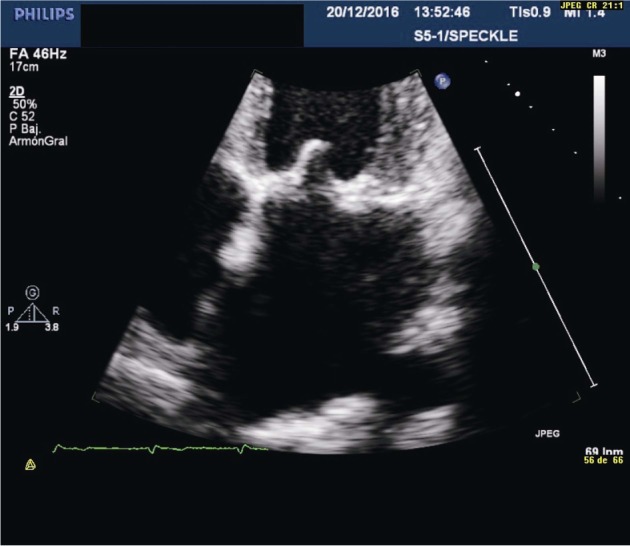
Figure 2. Transthoracic echocardiography in the four-chamber view showing global left atrial longitudinal strain in a normal subject.
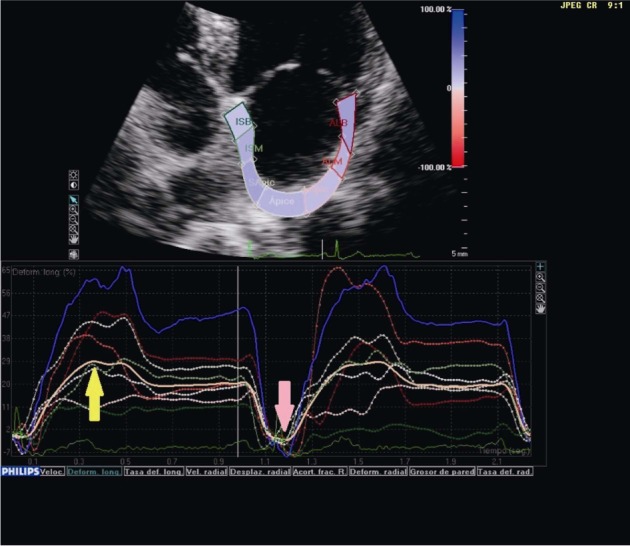
In sinus rhythm, a positive peak of strain corresponding to the reservoir phase (yellow arrow) and a negative one related to atrial contraction or pump function (pink arrow) are identified.
Figure 3. Transthoracic echocardiography in the four-chamber view showing global left atrial longitudinal strain in a normal subject.
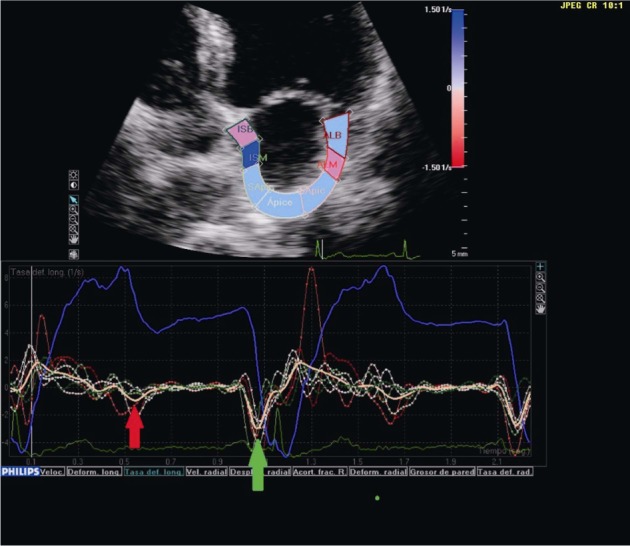
The strain rate during diastole of the left ventricle identifies two negative peaks; the first corresponds to early passive filling (red arrow) and the second to the pump function of the left atrium (green arrow).
Figure 4. Transthoracic echocardiography in the four-chamber view showing global left atrial longitudinal strain rate.
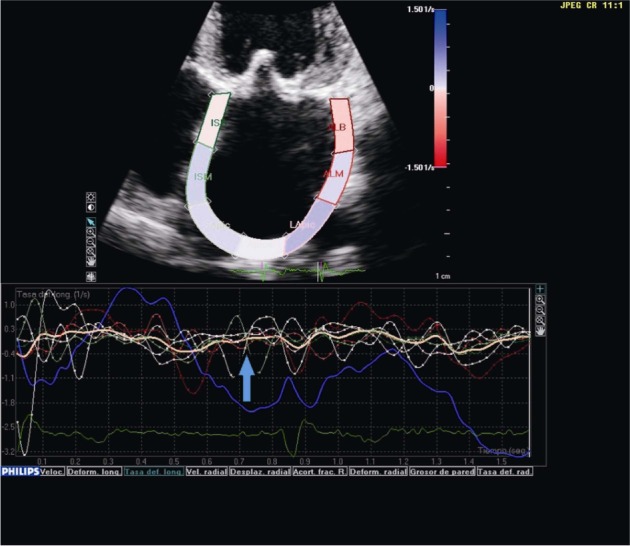
In the presence of atrial fibrillation, one of the two negative peaks of the strain rate curve disappears (blue arrow).
Figure 5. Transthoracic echocardiography in the four-chamber view showing global left atrial longitudinal strain in a patient with permanent atrial fibrillation.
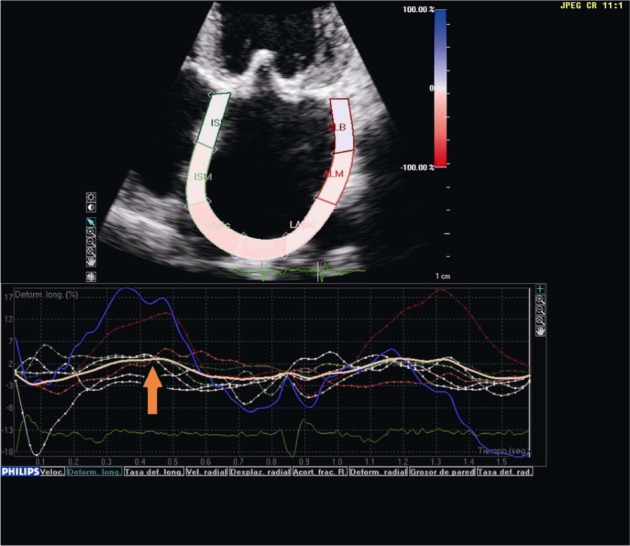
The reduction of atrial compliance causes a deterioration of the reservoir function, with a reduction of strain (orange arrow).
2.3. Clinical applications
The heterogeneity of atrial ε is a reflection of atrial wall fibrosis, as suggested by the greater temporal and spatial dispersion of the local ε and SR curve in patients with AF compared to those in sinus rhythm (Figures 2–5).[2],[16],[21] This electrical dispersion, due to disruption of conduction pathways and greater electromechanical atrial coupling, with greater inter- and intra-atrial delay measured with TDI, and greater P wave dispersion, are known to be electrophysiological characteristics of tendency of the atrium to fibrillation.[15] In a study of 61 patients with paroxysmal AF who underwent radiofrequency ablation (RFA) and 2DE with STE on the day prior to that procedure, LA volumes were calculated; the authors determined longitudinal peak ε during the LA contraction phase in 18 segments and the duration of the contraction measured from the peak of the ECG P wave to the maximum atrial systolic shortening. The standard deviation of the contraction duration in the 18 segments was defined as mechanical dispersion of LA. The conclusions of the study were that LA mechanical dispersion was more pronounced and the deformation was lower in patients with paroxysmal AF than in those who maintained sinus rhythm after RFA and in healthy controls, although ε was reduced in the two groups undergoing RFA compared to the healthy subjects. The structure and function of LV was normal and LA was normal or slightly increased in patients undergoing RFA. LA mechanical dispersion was a potent predictor of AF recurrence after RFA.[22] Another similar study involving 100 patients undergoing catheter ablation for AF sought to determine predictive factors of AF recurrence. Half the sample was in sinus rhythm at the time of performing transthoracic echocardiography (TTE) while the other half presented AF. The patients with most recurrence of AF were those with lower global and total lateral basal LA ε and higher maximum LA volume index compared to those in sinus rhythm. The independent predictors of AF recurrence in both groups were lower total lateral basal LA ε, and greater maximum LA volume index in the AF group at the time of TTE.[23]
Kuppahally et al.,[24] in 65 patients referred for TTE due to symptomatic AF, demonstrated an inverse correlation on univariate analysis between the greater extension of enhancement in LA with DCE-CMRI and lower ε during the reservoir phase in the midseptal and midlateral LA. Multivariate analysis showed that the relationship between higher degree of fibrosis and lower midlateral SR in LA was independent of other variables studied. After dividing the patient sample according to the duration of AF, in paroxysmal and persistent, the amount of atrial fibrosis and the concordant ε reduction was significantly higher in patients with chronic AF than in those with paroxysmal AF. The midseptal area is probably not the area to be measured by the ε of LA when compared to the midlateral, since this region is thinner and because of the presence of the oval fossa or septal aneurysms.[14]
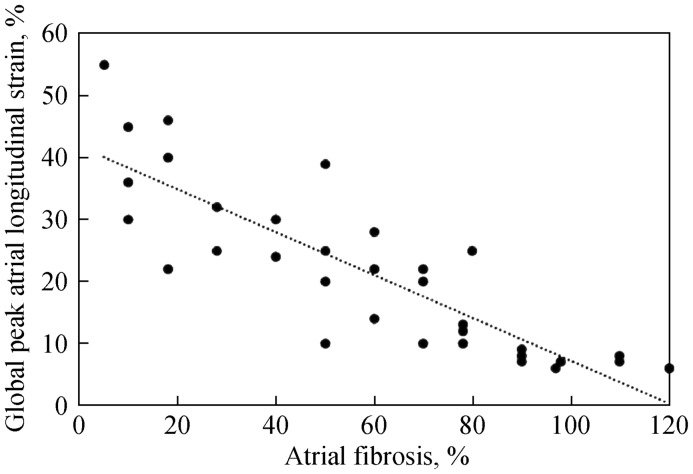
Recently, analysis of LA with STE in patients with severe mitral regurgitation who underwent surgery of this valve showed a greater reduction of the peak of atrial longitudinal ε according to the greater the degree of fibrosis of the LA wall. Fibrosis in this case was determined histologically by intraoperative LA biopsy (Figure 6). In addition, statistical analysis showed a close negative relationship between the peak of global atrial longitudinal ε measured with STE and atrial fibrosis, but this fibrosis showed poor correlation with other parameters of atrial function such as left atrial volume index, atrial ejection fraction and E/e' ratio. In addition, among all these parameters, overall longitudinal atrial peak ε showed the best diagnostic accuracy to detect LA fibrosis, with an area under the curve of 0.89.[17] This study demonstrated that new atrial function parameters based on STE are more sensitive than traditional echocardiographic parameters of LA size and function for the detection of atrial fibrosis. It is well known that AF patients undergoing cardioversion who maintain sinus rhythm have smaller LA than those who show a recurrence of AF.[25] However, it is also known that structural changes are late markers of disease. Consequently, today we attempt to detect functional remodeling before anatomical alterations. The detection of reduced ε and SR, and atrial fibrosis, mainly during the reservoir phase of the cardiac cycle, may play a relevant role in the management of patients with AF. Thus, for example, Di Salvo, et al.[26] have proven that ε and SR in the reservoir phase constitute a sensitive marker of arrhythmia recurrence in patients with isolated AF undergoing electrical cardioversion, along with a decrease in atrial appendage flow velocity on transesophageal echocardiography. However, multivariate analysis showed that ε and SR had independent predictive value for recurrence of arrhythmia.[26] Other investigators also prospectively assessed the ability of LA 2DE and STE to predict new non-valvular AF in a prospective study of 580 patients followed for 28 months. Thirty-two had AF; these patients had lower LA active ejection fraction, lower SR during LA contraction and increased LA volume. Multivariate analysis showed that the independent predictors of new AF were reduced active ejection fraction of the LA assessed by STE and the peak of SR in the maximum LA contraction. All this suggests a strong relationship between functional remodeling of LA and AF rather than between LA size and AF.[21]
Figure 6. Correlation between global peak atrial longitudinal strain and left atrial fibrosis.
In the clinical management of patients with AF and given the close relationship between morphology and function, reduced atrial deformation during the atrial reservoir phase of the cardiac cycle may be a non-invasive and early marker of the amount of fibrosis in the atrial wall. In addition, ε during the reservoir phase of peri-procedural LA promises to be a predictor of successful ablation of AF,[22],[23] allowing patient stratification based on the likelihood of maintaining sinus rhythm after the procedure. This same risk stratification of AF in the general population could allow a closer follow-up of the possibility of arrhythmias, as well as preventive antiarrhythmic treatment and anticoagulation.[21]
2.4. Limitations
Variability between the different authors regarding cut-off values of global LA ε determined by STE mean that there is no recommended cut-off value for use in research or routine practice.[17],[21]–[23],[26] In addition, different manufacturers employ different STE algorithms, and STE software was originally developed for ventricular function assessment and used to study atrial function without further validation studies. Differences in these techniques probably result in variable values of ε and SR in normal subjects and in patients. The thinness of the atrial wall is a challenge for the correct assessment of deformity by STE. Standardization of STE among manufacturers is necessary to correctly assess and compare LA function using STE.[27]
3. Cardiac MRI
As previously indicated, histological studies have shown proliferation of myofibroblasts and varying levels of collagen deposition in the atrial myocardium of patients with AF.[3],[28] Fibrosis of LA tissue is associated with anisotropy, reduction in myocardial voltage and decreased effective refractory period, all of which are considered a substrate that perpetuates AF.[29] Atrial fibrosis can be visualized and quantified with DCE-CMRI, which plays a major role in the diagnosis of many cardiac diseases. DCE is strongly related to high CHADS2 scores and history of stroke.[30] However, the costs, experience and advanced techniques involved could limit its use to a few specialized centers.
3.1. DCE-CMRI techniques for the detection of atrial fibrosis
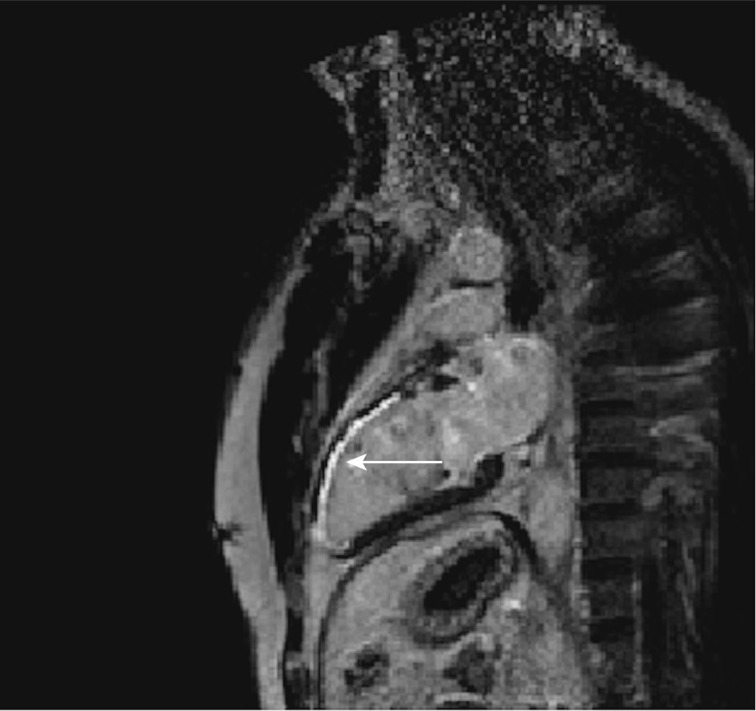
DCE allows visualization of the alteration in gadolinium washout in relation to the normal surrounding tissue, which reflects increased fibrosis or tissue remodeling of the myocardium. The damaged myocardium appears as a hyperintense area, while the normal area is hypointense or nulled (Figure 7). This is the established method for in vivo visualization of myocardial fibrotic tissue in the ventricles.[31] The two main steps to analyze atrial fibrosis in CMRI are segmentation of the anatomical structures of the atrial myocardium and the detection of areas of fibrosis within the atrial wall. Atrial segmentation is performed manually, consuming an important part of the analysis time. This segmentation comprises precise 2D slices of the walls of the endocardium and epicardium to delimit the region of interest to the LA wall alone, avoiding blood and other anatomical structures such as the aortic ring. The inclusion of fat structures or external tissues in the myocardial segmentation may lead to their misclassification as fibrosis scars. In addition, leaving part of the myocardium out of the segmentation, areas of fibrosis are not detected. When the atrial myocardium is adequately delimited, fibrotic tissue is detected visually, automatically or semi-automatically, by threshold techniques. These consist of applying a cut-off value to the image to distinguish the viable myocardium from that which is non-viable, based on signal strength intensity. Visual assessment is based on image inspection and manually plotting a non-viable myocardial contour. The gold standard is DCE-CMRI to evaluate ventricular scars in the absence of histological validation,[32] and is currently used as a reference technique to test the difference between semi-automatic and automatic algorithms. CMRI resolution is not as accurate at detecting scar in the thin atrial wall. However, several authors have published work using this approach.[33],[34] Despite the subjectivity and non-reproducibility of DCE-CMRI results in visual evaluation, it has been used in large studies to evaluate and locate LA scar after ablation.[33]
Figure 7. Typical contrast-enhanced image obtained by cardiac magnetic resonance imaging in a patient.
Hyper-enhancement is present (arrow) in coronary-perfusion territory-left anterior descending coronary artery, with a range of transmural involvement.
3.2. Clinical applications
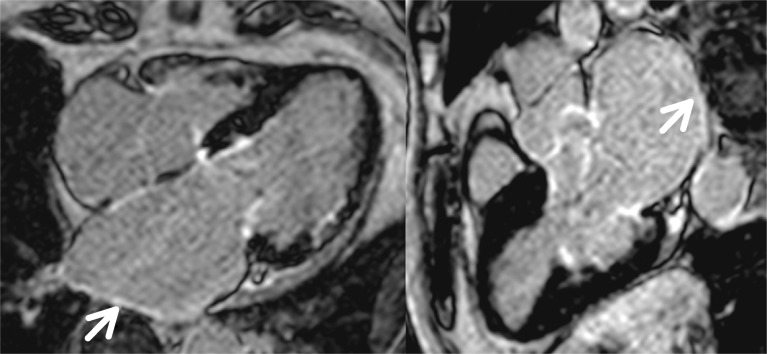
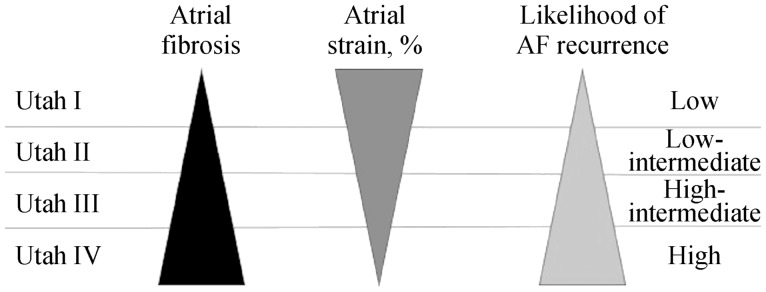
The first studies that used CMRI for atrial assessment focused on the measurement of volumes in patients with permanent or persistent AF, before and after electrical cardioversion,[35] comparing these volumes with those found using multidetector tomography of 320 slices and TTE. Over time it was also used in the atria to detect fibrosis, just as had previously been done for the ventricles, although in the atria some of the difficulties are the thinness of the wall (1–2 mm), the limited resolution and the unpredictable shape of the LA wall. Fibrotic changes are visible as thin areas of late enhancement along the atrial wall (Figure 8). The main clinical application is the evaluation of non-invasive atrial fibrosis and to predict the risk of AF recurrence after RFA. A large amount of fibrosis, and thus DCE in the ablation zone, represents a more complete isolation of the focus of AF and fewer recurrences of the arrhythmia.[33] It has also been shown that the amount of pre-ablation fibrosis is strongly related to the recurrence of AF after isolation of the pulmonary veins, as well as to a higher degree of DCE, and therefore fibrosis around the pulmonary veins before ablation, increased risk of recurrence after it.[36] A better understanding of the impact of fibrosis on atrial electrical activity would allow the identification of new ablation targets in persistent AF, with several studies investigating the relationship between DCE-CMRI and endocardial mapping,[33],[36] all of which reported a strong spatial agreement between the DCE-CMRI and the low-voltage regions in the electro-anatomical maps. These data have been confirmed by Mahnkopf, et al.,[37] who evaluated LA fibrosis prior to catheter ablation by DCE-CMRI in patients with isolated AF compared to others with comorbidities, establishing a classification known as that of Utah (Table 1), which is based on the degree of atrial fibrosis as a marker of structural remodeling. It is classified in four stages as the degree of atrial fibrosis increases. The distribution of Utah degrees from I to IV was similar in patients with and without isolated AF, but the most important finding was that success in AF ablation decreased as Utah grade increased, and therefore atrial fibrosis. These findings show how the Utah classification, integrated with LA ε determined by 2DE STE, could help in clinical practice by providing an approach better adapted to the arrhythmia of the patient and to know a priori the degree of success in suppressing AF, regardless of associated or non-associated comorbidity (Figure 9).
Figure 8. Ischemic cardiomyopathy and atrial fibrillation.
Left atrial dilation with late contrast uptake, visible as thin areas along the left atrial wall, in relation to atrial fibrosis (arrow).
Table 1. Classification Utah, which divides patients into four groups according to degree of fibrosis.
| Utah grade | LA wall DCE | Successful ablation (%) | AF recurrence (%) |
| Utah I | ≤ 5% | 100% | 0 |
| Utah II | 5% to ≤ 20% | 81.8% | 28% |
| Utah III | 20% to ≤ 35% | 62.5% | 35% |
| Utah IV | > 35% | 0 | 56% |
AF: atrial fibrillation; DCE: delayed contrast enhancement; LA: left atrial.
Figure 9. The black triangle represents the degree of atrial fibrosis according to the Utah classification.
The left triangle represents the degree of atrial fibrosis according to the Utah classification. The middle triangle represents atrial longitudinal strain and the right one represents the frequency of atrial fibrillation.
The relationship between atrial fibrosis and DCE-CMRI and high-density atrial mapping ECG in patients with persistent AF has also been studied. The authors categorized atrial tissue as dense areas of DCE, patchy areas of DCE and areas without DCE (normal areas), and found an inverse relation between atrial fibrosis and more complex fragmentation of the atrial ECG in the unequal and normal areas of DCE, and more organized in the dense areas of DCE. These results could have an impact on the ablation strategy.[38] Regarding the potential role of post-ablation DCE-CMRI, some authors indicate that it is still not accurate enough to reliably assess the distribution of lesions after ablation.[39]
In a study of 344 patients before undergoing pulmonary vein ablation for AF, DCE-CMRI were performed in an attempt to predict how many of these patients manifested paroxysmal AF in the context of sinus node disease, and therefore would probably require pacemaker implantation for sinus pauses or symptomatic sinus bradycardia, since the underlying process is believed to be atrial fibrosis. Mean patient age was 65 ± 12 years and mean left atrial fibrosis was 16.7% ± 11.1%. Patients were grouped according to Utah classification. At follow-up, 22 of them (with a mean atrial fibrosis of 23.9%) required pacemaker implantation. Both univariate and multivariate analyzes identified the stage of LA fibrosis (OR = 2.2) as an independent predictor of pacemaker implantation with an area under the curve of 0.704. The conclusion was that the existence of significant atrial fibrosis in these patients, determined using DCE-CMRI, is associated with significant sinus node dysfunction, requiring pacemaker implantation.[40]
Ravanelli, et al.,[41] presented the results of a new tool for 3D segmentation of LA, allowing quantification and visualization of LA fibrosis, based on DCE-CMRI. This allows stratifying patients with AF who would be candidates for RFA. They studied ten consecutive patients with AF and different degrees of atrial fibrosis, quantified using DCE-CMRI and magnetic resonance angiography and compared the results with the quantification and measurement of 3-D bipolar voltage maps using an electro-anatomic mapping system, which is the standard clinical reference for characterizing the atrial substrate. The discrepancy between the CMRI technique and electro-anatomical mapping was less than 4% for the detection of atrial fibrosis and the LA-fibrosis images in 3-D proved reliable and accurate. This non-invasive method is a clinical alternative to electro-anatomical mapping for the quantification and localization of atrial fibrosis, so the selection of RFA candidates would reduce AF recurrence, the costs and risks of invasive procedures and especially exclude candidates who would not benefit from cardiac ablation.[41]
Recently, a T1 mapping technique based on quantification of the extracellular volume fraction of LA has been proposed. The relaxation time T1 in the posterior wall of LA is shorter in patients with AF than in controls, suggesting that this value might be a surrogate for the degree of loading of LA interstitial fibrosis. However, these preliminary results need to be confirmed, taking into account the limitations of T1 mapping techniques in terms of accuracy and reproducibility.[42] In addition, T1 mapping does not provide a localization of fibrosis and is therefore not suitable for guiding RFA procedures or recognizing gaps. To detect focal fibrosis such as that produced by RFA, DCE is the most promising tool, if used correctly.[1]
3.3. Limitations
The ability of DCE-CMRI to detect atrial fibrosis is controversial, because it should be performed with histological analysis, which is difficult in humans, only being performed in localized areas. Therefore, most studies compare the results of DCE-CMRI with those of voltage maps, taken as a surrogate for histological study. This is affected by various variables such as the contact force, the orientation of the mapping catheter and tip size, as well as the number of recorded voltage points. Another important and problematic point is the cut-off of the voltage that must be established to define atrial scar, which is controversial.[1] The main limitation for clinical application of fibrosis assessment methods is poor intra- and inter-observer reproducibility. Thus, the prevalence of basal DCE in patients referred for a first AF ablation varies between 8.7% with slight enhancement to 47% with moderate enhancement.[36],[43] Also, not all studies that detect post-ablation scar were able to detect gaps. Some authors observed electrophysiological-CMRI concordance of up to 94% using a 3 T fixed pixel based scanner,[44] while others with a 1.5 T scanner and visual assessment of the scar found no relation between the scar and the sites of reconnection of the pulmonary veins.[34] However, with the same 1.5 T equipment and image processing using computational methods, good visualization of gap lesions has been described, which correlated well with the recovery of local electrograms or electrical conduction in the pulmonary veins.[45] Kuppahally et al.,[46] as previously indicated, found no difference in the number of patients with paroxysmal and persistent AF when classified as having mild and moderate-severe LA structural remodeling. However, in the DECAAF study,[47] the number of patients with paroxysmal AF was surprisingly higher in the group with the greatest extent of fibrosis. The lack of standardized image acquisition protocols for CRMI can affect the reproducibility of the results of different operators and the comparison between patients, altering the accuracy of the analysis. In CRMI, image processing is even less standardized than image acquisition. Visual evaluation is highly operator-dependent and inter-observer variability is high, especially in the identification of non-homogeneous patchy or grey areas of DCE, or in the detection of small reconnections between gaps. Some of these computational techniques are based on a variable (from 2 to 4 SD above the intensity of the reference pixel) and on slice-by-slice thresholds, and are based on the opinion of an expert regarding the choice of an appropriate value.[43],[47] This makes the methods subjective and prone to user variability. Numerous sources of discordance can be found in image acquisition and processing, with several challenges pending in an attempt to achieve a more consistent analysis, eliminating differences between different operators. With new software, technological advances, and improved CMRI resolution, it is likely that images will be processed more accurately with automatic methods. Until then, and to obtain reliable and clinically applicable results, the use of standardized protocols is necessary to ensure uniformity in the acquisition and processing of images.[1]
Acknowledgments
The authors thank Dr. Rosa González Colino from Department of Cardiology, Hospital Son Espases, Illes Balears and Dr. Jordi Estornell from Department of Radiology, Hospital Universitario de Canarias, for allowing us to use Figure 8 of the present review. The authors declare no conflict of interest and no relationships with industry.
Footnotes
This article is part of a Special Issue “Atrial fibrillation in the elderly”.
Guest Editors: Manuel Martínez-Sellés & Antoni Bayés de Luna
References
- 1.Pontecorboli G, Figueras I, Ventura RM, et al. Use of delayed-enhancement magnetic resonance imaging for fibrosis detection in the atria: a review. Europace. 2016;155:469–473. doi: 10.1093/europace/euw053. [DOI] [PubMed] [Google Scholar]
- 2.Longobardo L, Todaro MC, Zito C, et al. Role of imaging in assessment of atrial fibrosis in patients with atrial fibrillation: State-of-the-art review. Eur Heart J Cardiovasc Imaging. 2014;15:1–5. doi: 10.1093/ehjci/jet116. [DOI] [PubMed] [Google Scholar]
- 3.Kottkamp H. Human atrial fibrillation substrate: towards a specific fibrotic atrial cardiomyopathy. Eur Heart J. 2013;34:2731–2738. doi: 10.1093/eurheartj/eht194. [DOI] [PubMed] [Google Scholar]
- 4.Calenda BW, Fuster V, Halperin JL, Granger CB. Stroke risk assessment in atrial fibrillation: risk factors and markers of atrial myopathy. Nat Rev Cardiol. 2016;13:549–559. doi: 10.1038/nrcardio.2016.106. [DOI] [PubMed] [Google Scholar]
- 5.Lip GYH, Windecker S, Huber K, et al. Management of antithrombotic therapy in atrial fibrillation patients presenting with acute coronary syndrome and/or undergoing percutaneous coronary or valve interventions: a joint consensus document of the European Society of Cardiology Working Group on Thrombosis, European Heart Rhythm Association (EHRA), European Association of Percutaneous Cardiovascular Interventions (EAPCI) and European Association of Acute Cardiac Care (ACCA) endorsed by the Heart Rhythm Society (HRS) and Asia-Pacific Heart Rhythm Society (APHRS) Eur Heart J. 2014;35:3155–3179. doi: 10.1093/eurheartj/ehu298. [DOI] [PubMed] [Google Scholar]
- 6.January CT, Wann LS, Alpert JS, et al. 2014 AHA/ACC/HRS guideline for the management of patients with atrial fibrillation: executive summary: a report of the American College of Cardiology/American Heart Association task force on practice guidelines and the heart rhythm society. Circulation. 2014:2071–2104. doi: 10.1161/CIR.0000000000000040. [DOI] [PubMed] [Google Scholar]
- 7.Corradi D. Atrial fibrillation from the pathologist's perspective. Cardiovasc Pathol. 2014;23:71–84. doi: 10.1016/j.carpath.2013.12.001. [DOI] [PubMed] [Google Scholar]
- 8.Kirchhof P, Benussi S, Kotecha D, et al. 2016 ESC Guidelines for the management of atrial fibrillation developed in collaboration with EACTS. Eur Heart J. 2016;37:2893–2962. doi: 10.1093/eurheartj/ehw210. [DOI] [PubMed] [Google Scholar]
- 9.Goette A, Staack T, Röcken C, et al. Increased expression of extracellular signal-regulated kinase and angiotensin-converting enzyme in human atria during atrial fibrillation. J Am Coll Cardiol. 2000;35:1669–1677. doi: 10.1016/s0735-1097(00)00611-2. [DOI] [PubMed] [Google Scholar]
- 10.Allessie MA, De Groot NMS, Houben RPM, et al. Electropathological substrate of long-standing persistent atrial fibrillation in patients with structural heart disease longitudinal dissociation. Circ Arrhythmia Electrophysiol. 2010;3:606–615. doi: 10.1161/CIRCEP.109.910125. [DOI] [PubMed] [Google Scholar]
- 11.Spach MS, Josephson ME. Initiating reentry: the role of nonuniform anisotropy in small circuits. J Cardiovasc Electrophysiol. 1994;5:182–209. doi: 10.1111/j.1540-8167.1994.tb01157.x. [DOI] [PubMed] [Google Scholar]
- 12.Anné W, Willems R, Roskams T, et al. Matrix metalloproteinases and atrial remodeling in patients with mitral valve disease and atrial fibrillation. Cardiovasc Res. 2005;67:655–666. doi: 10.1016/j.cardiores.2005.04.016. [DOI] [PubMed] [Google Scholar]
- 13.Hirsh BJ, Copeland-Halperin RS, Halperin JL. Fibrotic atrial cardiomyopathy, atrial fibrillation, and thromboembolism: Mechanistic links and clinical inferences. J Am Coll Cardiol. 2015;65:2239–2251. doi: 10.1016/j.jacc.2015.03.557. [DOI] [PubMed] [Google Scholar]
- 14.Donal E, Lip GYH, Galderisi M, et al. EACVI/EHRA expert consensus document on the role of multi-modality imaging for the evaluation of patients with atrial fibrillation. Eur Heart J Cardiovasc Imaging. 2016;17:355–383. doi: 10.1093/ehjci/jev354. [DOI] [PubMed] [Google Scholar]
- 15.Todaro MC, Choudhuri I, Belohlavek M, et al. New echocardiographic techniques for evaluation of left atrial mechanics. Eur Heart J Cardiovasc Imaging. 2012;13:973–984. doi: 10.1093/ehjci/jes174. [DOI] [PMC free article] [PubMed] [Google Scholar]
- 16.Blume GG, McLeod CJ, Barnes ME, et al. Left atrial function: physiology, assessment, and clinical implications. Eur J Echocardiogr. 2011;12:421–430. doi: 10.1093/ejechocard/jeq175. [DOI] [PubMed] [Google Scholar]
- 17.Cameli M, Lisi M, Righini FM, et al. Usefulness of atrial deformation analysis to predict left atrial fibrosis and endocardial thickness in patients undergoing mitral valve operations for severe mitral regurgitation secondary to mitral valve prolapse. Am J Cardiol. 2013;111:595–601. doi: 10.1016/j.amjcard.2012.10.049. [DOI] [PubMed] [Google Scholar]
- 18.Sun JP, Yang Y, Guo R, et al. Left atrial regional phasic strain, strain rate and velocity by speckle-tracking echocardiography: normal values and effects of aging in a large group of normal subjects. Int J Cardiol. 2013;168:3473–3479. doi: 10.1016/j.ijcard.2013.04.167. [DOI] [PubMed] [Google Scholar]
- 19.Saraiva RM, Demirkol S, Buakhamsri A, et al. Left atrial strain measured by two-dimensional speckle tracking represents a new tool to evaluate left atrial function. J Am Soc Echocardiogr. 2010;23:172–180. doi: 10.1016/j.echo.2009.11.003. [DOI] [PubMed] [Google Scholar]
- 20.Vianna-Pinton R, Moreno CA, Baxter CM, et al. Two-dimensional speckle-tracking echocardiography of the left atrium: feasibility and regional contraction and relaxation differences in normal subjects. J Am Soc Echocardiogr. 2009;22:299–305. doi: 10.1016/j.echo.2008.12.017. [DOI] [PubMed] [Google Scholar]
- 21.Hirose T, Kawasaki M, Tanaka R, et al. Left atrial function assessed by speckle tracking echocardiography as a predictor of new-onset non-valvular atrial fibrillation: results from a prospective study in 580 adults. Eur Heart J Cardiovasc Imaging. 2012;13:243–250. doi: 10.1093/ejechocard/jer251. [DOI] [PubMed] [Google Scholar]
- 22.Sarvari SI, Haugaa KH, Stokke TM, et al. Strain echocardiographic assessment of left atrial function predicts recurrence of atrial fibrillation. Eur Heart J Cardiovasc Imaging. 2016;17:660–667. doi: 10.1093/ehjci/jev185. [DOI] [PMC free article] [PubMed] [Google Scholar]
- 23.Yasuda R, Murata M, Roberts R, et al. Left atrial strain is a powerful predictor of atrial fibrillation recurrence after catheter ablation: study of a heterogeneous population with sinus rhythm or atrial fibrillation. Eur Heart J Cardiovasc Imaging. 2015;16:1008–1014. doi: 10.1093/ehjci/jev028. [DOI] [PubMed] [Google Scholar]
- 24.Kuppahally SS, Akoum N, Burgon NS, et al. Left atrial strain and strain rate in patients with paroxysmal and persistent atrial fibrillation: relationship to left atrial structural remodeling detected by delayed-enhancement MRI. Circ Cardiovasc Imaging. 2010;3:231–239. doi: 10.1161/CIRCIMAGING.109.865683. [DOI] [PubMed] [Google Scholar]
- 25.Verhorst PM, Kamp O, Welling RC, et al. Transesophageal echocardiographic predictors for maintenance of sinus rhythm after electrical cardioversion of atrial fibrillation. Am J Cardiol. 1997;79:1355–1359. doi: 10.1016/s0002-9149(97)00139-2. [DOI] [PubMed] [Google Scholar]
- 26.Di Salvo G, Caso P, Lo Piccolo R, et al. Atrial myocardial deformation properties predict maintenance of sinus rhythm after external cardioversion of recent-onset lone atrial fibrillation: a color Doppler myocardial imaging and transthoracic and transesophageal echocardiographic study. Circulation. 2005;112:387–395. doi: 10.1161/CIRCULATIONAHA.104.463125. [DOI] [PubMed] [Google Scholar]
- 27.Voigt JU, Pedrizzetti G, Lysyansky P, et al. Definitions for a common standard for 2D speckle tracking echocardiography: consensus document of the EACVI/ASE/Industry Task Force to standardize deformation imaging. Eur Heart J Cardiovasc Imaging. 2015;16:1–11. doi: 10.1093/ehjci/jeu184. [DOI] [PubMed] [Google Scholar]
- 28.Boldt A, Wetzel U, Lauschke J, et al. Fibrosis in left atrial tissue of patients with atrial fibrillation with and without underlying mitral valve disease. Heart. 2004;90:400–405. doi: 10.1136/hrt.2003.015347. [DOI] [PMC free article] [PubMed] [Google Scholar]
- 29.Zlochiver S, Muñoz V, Vikstrom KL, et al. Electrotonic myofibroblast-to-myocyte coupling increases propensity to reentrant arrhythmias in two-dimensional cardiac monolayers. Biophys J. 2008;95:4469–4480. doi: 10.1529/biophysj.108.136473. [DOI] [PMC free article] [PubMed] [Google Scholar]
- 30.Daccarett M, Badger TJ, Akoum N, et al. Association of left atrial fibrosis detected by delayed-enhancement magnetic resonance imaging and the risk of stroke in patients with atrial fibrillation. J Am Coll Cardiol. 2011;57:831–838. doi: 10.1016/j.jacc.2010.09.049. [DOI] [PMC free article] [PubMed] [Google Scholar]
- 31.Kim RJ, Wu E, Rafael A, et al. The use of contrast-enhanced magnetic resonance imaging to identify reversible myocardial dysfunction. N Eng J Med. 2000;343:1445–1453. doi: 10.1056/NEJM200011163432003. [DOI] [PubMed] [Google Scholar]
- 32.Setser RM, Bexell DG, O'Donnell TP, et al. Quantitative assessment of myocardial scar in delayed enhancement magnetic resonance imaging. J Magn Reson Imaging. 2003;18:434–441. doi: 10.1002/jmri.10391. [DOI] [PubMed] [Google Scholar]
- 33.Peters DC, Wylie J V, Hauser TH, et al. Detection of pulmonary vein and left atrial scar after catheter ablation with three-dimensional navigator-gated delayed enhancement MR imaging: initial experience. Radiology. 2007;243:690–695. doi: 10.1148/radiol.2433060417. [DOI] [PubMed] [Google Scholar]
- 34.Spragg DD, Khurram I, Zimmerman SL, et al. Initial experience with magnetic resonance imaging of atrial scar and co-registration with electroanatomic voltage mapping during atrial fibrillation: Success and limitations. Hear Rhythm. 2012;9:2003–2009. doi: 10.1016/j.hrthm.2012.08.039. [DOI] [PubMed] [Google Scholar]
- 35.Agner BFR, Kühl JT, Linde JJ, et al. Assessment of left atrial volume and function in patients with permanent atrial fibrillation: Comparison of cardiac magnetic resonance imaging, 320-slice multi-detector computed tomography, and transthoracic echocardiography. Eur Heart J Cardiovasc Imaging. 2014;15:532–540. doi: 10.1093/ehjci/jet239. [DOI] [PubMed] [Google Scholar]
- 36.Oakes RS, Badger TJ, Kholmovski EG, et al. Detection and quantification of left atrial structural remodeling with delayed-enhancement magnetic resonance imaging in patients with atrial fibrillation. Circulation. 2009;119:1758–1767. doi: 10.1161/CIRCULATIONAHA.108.811877. [DOI] [PMC free article] [PubMed] [Google Scholar]
- 37.Mahnkopf C, Badger TJ, Burgon NS, et al. Evaluation of the left atrial substrate in patients with lone atrial fibrillation using delayed-enhanced MRI: Implications for disease progression and response to catheter ablation. Hear Rhythm. 2010;7:1475–1481. doi: 10.1016/j.hrthm.2010.06.030. [DOI] [PMC free article] [PubMed] [Google Scholar]
- 38.Jadidi AS, Cochet H, Shah AJ, et al. Inverse relationship between fractionated electrograms and atrial fibrosis in persistent atrial fibrillation: combined magnetic resonance imaging and high-density mapping. J Am Coll Cardiol. 2013;62:802–812. doi: 10.1016/j.jacc.2013.03.081. [DOI] [PubMed] [Google Scholar]
- 39.Hunter RJ, Jones DA, Boubertakh R, et al. Diagnostic accuracy of cardiac magnetic resonance imaging in the detection and characterization of left atrial catheter ablation lesions: a multicenter experience. J Cardiovasc Electrophysiol. 2013;24:396–403. doi: 10.1111/jce.12063. [DOI] [PubMed] [Google Scholar]
- 40.Akoum N, McGann C, Vergara G, et al. Atrial fibrosis quantified using late Gadolinium enhancement MRI is associated with sinus node dysfunction requiring pacemaker implant. J Cardiovasc Electrophysiol. 2012;23:44–50. doi: 10.1111/j.1540-8167.2011.02140.x. [DOI] [PMC free article] [PubMed] [Google Scholar]
- 41.Ravanelli D, Dal Piaz EC, Centonze M, et al. A novel skeleton based quantification and 3-D volumetric visualization of left atrium fibrosis using late gadolinium enhancement magnetic resonance imaging. IEEE Trans Med Imaging. 2014;33:566–576. doi: 10.1109/TMI.2013.2290324. [DOI] [PubMed] [Google Scholar]
- 42.Beinart R, Khurram IM, Liu S, et al. Cardiac magnetic resonance T1 mapping of left atrial myocardium. Hear Rhythm. 2013;10:1325–1331. doi: 10.1016/j.hrthm.2013.05.003. [DOI] [PMC free article] [PubMed] [Google Scholar]
- 43.McGann CJ, Kholmovski EG, Oakes RS, et al. New Magnetic resonance imaging-based method for defining the extent of left atrial wall injury after the ablation of atrial fibrillation. J Am Coll Cardiol. 2008;52:1263–1271. doi: 10.1016/j.jacc.2008.05.062. [DOI] [PubMed] [Google Scholar]
- 44.Bisbal F, Guiu E, Cabanas-Grandío P, et al. CMR-guided approach to localize and ablate gaps in repeat AF ablation procedure. JACC Cardiovasc Imaging. 2014;7:653–663. doi: 10.1016/j.jcmg.2014.01.014. [DOI] [PubMed] [Google Scholar]
- 45.Badger TJ, Daccarett M, Akoum NW, et al. Evaluation of left atrial lesions after initial and repeat atrial fibrillation ablation; Lessons learned from delayed-enhancement MRI in repeat ablation procedures. Circ Arrhythmia Electrophysiol. 2010;3:249–259. doi: 10.1161/CIRCEP.109.868356. [DOI] [PMC free article] [PubMed] [Google Scholar]
- 46.Kuppahally SS, Akoum N, Badger TJ, et al. Echocardiographic left atrial reverse remodeling after catheter ablation of atrial fibrillation is predicted by preablation delayed enhancement of left atrium by magnetic resonance imaging. Am Heart J. 2010;160:877–884. doi: 10.1016/j.ahj.2010.07.003. [DOI] [PMC free article] [PubMed] [Google Scholar]
- 47.Marrouche NF, Wilber D, Hindricks G, et al. Association of atrial tissue fibrosis identified by delayed enhancement MRI and atrial fibrillation catheter ablation: the DECAAF study. JAMA. 2014;311:498–506. doi: 10.1001/jama.2014.3. [DOI] [PubMed] [Google Scholar]


