Abstract.
Bone metastases are a frequent occurrence with cancer, and early detection can guide the patient’s treatment regimen. Metastatic bone disease can present in density extremes as sclerotic (high density) and lytic (low density) or in a continuum with an admixture of both sclerotic and lytic components. We design a framework to detect and characterize the varying spectrum of presentation of spine metastasis on positron emission tomography/computed tomography (PET/CT) data. A technique is proposed to synthesize CT and PET images to enhance the lesion appearance for computer detection. A combination of watershed, graph cut, and level set algorithms is first run to obtain the initial detections. Detections are then sent to multiple classifiers for sclerotic, lytic, and mixed lesions. The system was tested on 44 cases with 225 sclerotic, 139 lytic, and 92 mixed lesions. The results showed that sensitivity (false positive per patient) was 0.81 (2.1), 0.81 (1.3), and 0.76 (2.1) for sclerotic, lytic, and mixed lesions, respectively. It also demonstrates that using PET/CT data significantly improves the computer aided detection performance over using CT alone.
Keywords: computer-aided detection, spine metastasis, positron emission tomography/computed tomography synthesis
1. Introduction
Approximately 400,000 patients per year in the United States are diagnosed with bone metastases. Metastatic lesions to the bone are identified in up to 70% of patients with advanced breast and prostate cancer.1,2 Within the skeletal system, the most common location of skeletal metastases is the spine. Secondary skeletal complications due to solid tumor metastases to the spine may include pathologic fractures, bone associated pain, hematopoietic and metabolic abnormalities, and nerve compression. Early detection and treatment of spinal metastases before the significant morbidities occur can improve patient outcomes.3
The x-ray beam attenuation or correlative density appearance of a metastatic lesion in bone may occur anywhere along a continuum from lytic to sclerotic, with a natural history of type interconversion.4 The destructive processes of metastatic disease to the skeletal structures can biomechanically weaken bone and result in pathologic fractures. Lytic metastatic lesions weaken bone via destruction of the substrate osseous architectural elements. Osteoblastic metastases weaken bone by the replacement of native bone matrix with disorganized and irregularly mineralized matrix in the form of woven bone. A particular patient may present with simultaneous sclerotic, lytic, and mixed density metastatic lesions, lending importance to an integrated detection system.
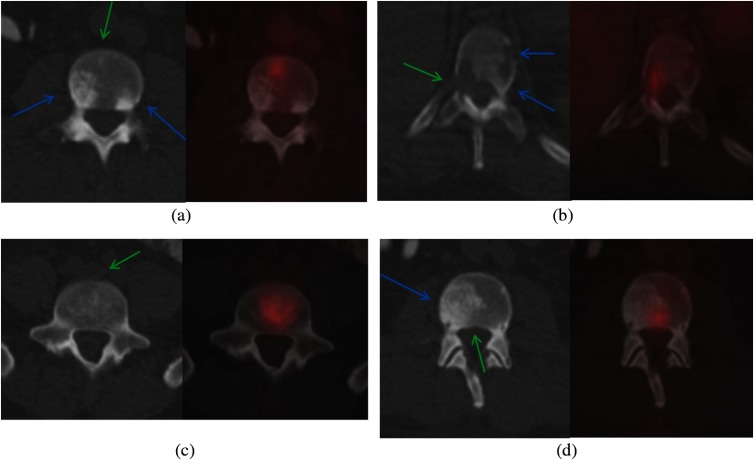
The physical characteristics of bone metastases, such as x-ray beam attenuation (surrogate density) and tissue magnetic characteristics, are exploited with currently available noninvasive medical imaging modalities for primary detection and detailed characterization for type classification. The primary screening modality employed to evaluate neck and back pain is plain film radiography. However, up to 40% of bone metastases are not apparent utilizing this imaging modality. A superior level of soft tissue contrast is available with magnetic resonance imaging (MRI), optimizing visualization of neoplastic deposits in the bone marrow at an early stage, as well as soft tissue spinal pathology such as epidural tumors and injury of the spinal cord. There are disadvantages of MRI, however, including specific image artifacts, longer scan times, and exclusion of patients with certain pacemakers and aneurysm coils. The ability to detect the increased metabolism of glucose in neoplastic cells relative to nonneoplastic cells allows [18F] fluoro-2-deoxy-d-glucose positron emission tomography (FDG-PET) to detect metabolically active metastatic lesions, but the usefulness of FDG-PET as a stand-alone modality is limited by its low spatial resolution. As an x-ray attenuation modality with excellent spatial resolution, computed tomography (CT) imaging allows visualization of the distribution and extent of spinal metastatic disease via detection of osseous destruction or reactive sclerosis. There are marrow-based lesions, however, which have not reached a stage of macroscopically detectable destruction visible on CT, and thus these lesions are not apparent using CT as a sole method of visualization. To increase the sensitivity and specificity for lesion detection and characterization relative to FDG-PET and CT as independent modalities, integrated PET/CT imaging scanners have been created. In a PET/CT scanner, PET and CT data are acquired at the same session and in a fashion such that the images can be spatially coregistered. Combining the high spatial resolution of CT for accurate visualization of anatomy with the metabolic/physiologic tissue data of PET imaging allows detection of metabolically active marrow-based tumors and assessment of the malignant potential of CT-apparent lesions. More accurate information can be obtained from PET/CT relative to CT as a stand-alone modality in early detection of bone metastatic lesions, via the improvement of tumor staging of .5 In this paper, we aim to develop a fully automated and highly accurate system to detect varying spectrum of spine metastases on PET/CT. Lytic, sclerotic, and mixed spine metastases examples on PET/CT imaging are demonstrated in Fig. 1.
Fig. 1.
Spine metastases on PET/CT. (a) and (c) CT and (b) and (d) PET/CT fusion. (a) Multiple sclerotic lesions, two without PET activity (blue arrows), one showing PET activity (green arrow); (b) multiple lytic lesions, one showing PET activity (green arrow), two not showing activity (blue arrows); (c) mixed lesion showing heterogeneity; and (d) mixed lesion with both sclerotic (blue arrow) and nearly imperceptible lytic components (green arrow).
The spine is a complex, physically extended, multisegmented articulating structure, viewed in clinical medical practice over hundreds of images in multiple projections and in multiple tissue scaled visualization “windows,” and lesion presentation may be subtle and unexpected. As such, traditional detection of spinal metastases by qualitative visualization inspection can be a challenge, particularly with the addition of workplace time constraints. There have been few computer aided detection (CAD) systems focusing on spine metastasis detection. Most methods target only one type of metastasis, either lytic or sclerotic. For lytic lesion CAD, O'Connor et al.6 developed a detection method for lytic bone metastasis using regular CT images. Based on a dynamic graph search, they traced the spinal cord to establish a local spine coordinate system. Potential lytic bone lesions were detected using a watershed algorithm. Wels et al.7 presented a multistage lytic spinal lesion detection on CT by applying multiple random forests while maintaining sensitivity at each stage. Online feature filtering was adopted to select the most efficient features at each stage. Jerebko et al.8 developed a lytic metastasis detection system on MRI based on multiple instance learning and Fisher’s linear discriminant analysis. Toth et al.9 proposed an efficient visualization algorithm for radiologists to rapidly detect sclerotic bone metastasis on CT by stripping the cortical shell and multiplanar reformation of the remaining marrow. Whyne et al.10 characterized the extent of metastatic disease using histogram analysis of the vertebral centrum intensity distribution of CT. They first established the density distribution in healthy vertebrae and built a patient specific model, which was then used to segment tumor tissue and characterize the extent of disease. The group later applied the technique to detect changes in lytic metastases from one cohort of patients taking bisphosphonates and one control cohort.11 For sclerotic lesion CAD, Weise et al.12 and Burns et al.13 developed a sclerotic metastasis detection system on CT and examined the etiology of false negative and false positive detections. Roth et al.14 then proposed a deep convolutional neural network approach to reduce the number of false positives in the sclerotic metastasis CAD. The data were augmented through random aggregation for the deep learning framework. A few other investigations tackled both lytic and sclerotic lesions. Huang and Chiang15 adopted a general multilayer perceptron neural network with three-layer back propagation to detect lytic and sclerotic, but not mixed, lesions in one classification. The technique was on two-dimensional (2-D) slices, and cortical shells were stripped before 11 texture features and 22 interslice texture difference features were extracted. Hammon et al.16 developed a system that detected lytic and sclerotic lesions separately using three cascade random forest-based discriminative models. Both low-level Haar-like features and higher level shape and texture features were extracted from sagittal images. Our group presented preliminary clinical results for mixed type spinal metastases in an Radiological Society of North America abstract.17
Several investigations5,18,19 have shown that FDG PET provides useful information for assessing and monitoring spinal metastasis. The reference standard clinical practice of PET/CT interpretation incorporates fused PET and CT images, created by color blending of a grayscale underlay image (CT) and pseudocolor overlay image (PET), using physiologic and anatomic data in symbiosis to increase the detection sensitivity of neoplastic processes. These images are created to optimize qualitative human visual/optical evaluation. In this paper, we propose a method to arithmetically synthesize PET and CT to enhance the appearance of bone metastasis for computer assessment, in a process parallel to the fusion of PET and CT images for human visual assessment, but designed to utilize the characteristics of computer “vision” evaluation. Furthermore, we design a unified multiclassifier framework that detects the varying spectrum of appearance of metastatic lesions, including important mixed type lesions that were understudied in previous CAD research.
2. Methods
2.1. System Overview
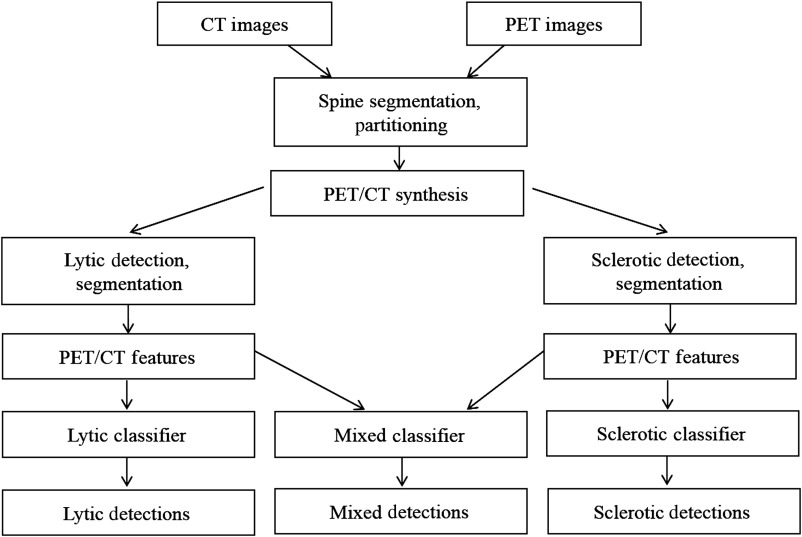
Figure 2 shows the block diagram of our spine metastasis CAD system. First, the spine is segmented and partitioned into vertebrae on the CT image (Sec. 2.2). After that, CT and PET images are synthesized to form lytic-enhanced and sclerotic-enhanced images (Sec. 2.3). The lytic and sclerotic candidates are detected and segmented using watershed, graph cut, and level set algorithms in a unified framework with different parameter settings (Sec. 2.4). After high-level features from CT and PET are extracted, they are sent to lytic lesion and sclerotic lesion classifiers, respectively (Sec. 2.5). If both lytic and sclerotic detections occur in bounded overlapping anatomic neighborhoods, they are merged and sent to a mixed lesion classifier. The three classifiers are trained using data labeled by radiologists.
Fig. 2.
System flowchart. Refer to Sec. 2.1 for brief system overview.
2.2. Spine Segmentation and Partitioning
Spine segmentation is conducted on the CT image, where bony structures show good contrast against surrounding soft tissues.20 An adaptive thresholding method is first applied to mask the majority of bone pixels. Then, the largest connected component in the image is retained as the initial spine segmentation. The spinal canal is then extracted using a directed acyclic graph (DAG) search for the longest path from the thoracic to lumbar spine. The DAG is constructed with nodes anatomically mapped as spinal canal candidates, which are low-intensity regions enclosed by bony structures, and edges determined as overlap between spinal canal candidates on adjacent slices. The centerline of the spinal canal is then computed and smoothed using a Bernstein spline.21 The vertebral region is then segmented around the spinal canal using a vertebral template consisting of substructures of vertebral body, transverse processes, and a spinous process.20
To partition the spine column into vertebrae, curved planar reformations (CPR)22 in both sagittal and coronal directions are computed along the centerline of the spinal canal. Aggregated intensity profiles (AIP) along the normal direction of the projected centerline on the sagittal and coronal CPR are computed, and dynamic programming is performed to locate the vertebral disks that correspond to valleys in the AIP.
2.3. Positron Emission Tomography/Computed Tomography Synthesis
As shown in Fig. 1, bone metastases manifest pathologically distinct characteristics on CT and PET images. Although most bone metastases are distinguishable on CT, some are difficult to detect merely using CT [Fig. 1(a)]. For certain lesions, PET provides complementary and enhancing information. To make use both of CT and PET in the detection, we create a synthetic image by enhancing the CT image with PET standardized uptake value (SUV) uptake.
The PET image is first resampled to the CT resolution. For sclerotic lesions, we need to increase the CT value to enhance its appearance, while for lytic lesions, we need to decrease the CT value. Therefore, we generate two synthetic CT images, one for each type of metastasis. The synthesis process can be formulated as
| (1) |
where is the CT value, is the PET SUV value, and is the CT/PET synthesis value. is the mean CT value for cortical bones, and is the mean CT value for medullary bones, which can be computed from the spine segmentation in Sec. 2.1. and are the maximum and minimum PET SUV value in the image. is the weight for enhancing, which is set empirically from the training cases. We set for sclerotic PET/CT synthesis and for lytic synthesis. The synthesis process is, therefore, patient and study specific since it is normalized by the max SUV of the PET study and bone density of the CT study. The enhancement is bounded by the contrast between cortical and medullary bones to prevent distortion of the overall appearance of vertebra. Figure 3 shows the PET/CT synthesis for lytic and sclerotic lesions in Fig. 1.
Fig. 3.
PET/CT synthesis. (a) Sclerotic synthesis of Fig. 1(a), sclerotic lesion becomes visible (arrow); (b) lytic synthesis of Fig. 1(b), mixed lesion is enhanced (arrow); (c) sclerotic synthesis of Fig. 1(c), mixed lesion is enhanced; and (d) lytic synthesis of Fig. 1(d), lytic lesion is enhanced.
2.4. Lesion Candidate Detection and Segmentation
The lesion candidate detection and segmentation algorithm is summarized as followed. The detection processes are restricted to the segmented spine region on the PET/CT synthesis image. A general framework is developed for both lytic and sclerotic detections. First, a watershed algorithm is applied to extract the initial candidates, followed by a graph cut algorithm to obtain 2-D detections on each axial slice. The resulting 2-D candidates are then stacked to form three-dimensional (3-D) detections, and a 3-D level set algorithm is performed to refine the segmentation. Lytic and sclerotic candidates are detected in two separate passes with different parameter settings on the corresponding CT/PET synthesis. In places where both lytic and sclerotic detections appear in overlapping anatomic neighborhoods, they are merged to form mixed detections.
The watershed algorithm23 views the gradient of the image intensity as a topographic surface to extract relatively homogeneous regions of the image called catchment basins, which are candidates for lesions. The algorithm can be adapted for both lytic and sclerotic lesions. Low intensity patches surrounded by high intensity patches are potential lytic detections. Similarly, high intensity patches surrounded by low intensity patches are potential sclerotic detections.
Watershed results are often over-segmented, and a graph-cuts strategy24 is adopted to merge watershed patches into detections. Without loss of generality, sclerotic detections are used as examples in the following description. Each watershed patch is labeled as either foreground () or background (). In the case of sclerotic detections, any patch with intensity higher than all its surrounding patches will be initialized as . The rest are initialized as . An adjacency graph is constructed by representing watershed patches as nodes that are connected by edges indicating the adjacency of the patches. A minimal graph cut of is equivalent to a labeling scheme that minimizes an energy function
| (2) |
where is the set of watershed patches, is the set of pairs of adjacent patches on the foreground and background boundary, () are two adjacent patches, and and are their labels assigned as either or . is a labeling scheme to be optimized. is a smoothness term that penalizes regions with similar intensity distribution for having different labels
| (3) |
where , with and being the standard deviation intensity of the foreground and background, respectively. is the difference of the cumulative histogram between patch and . is a data term that penalizes a patch with low intensity marked as foreground or a patch with high intensity marked as background (for sclerotic detections)
| (4) |
where is the mean intensity of patch in the CT/PET synthesis and and are the means of the background and foreground patches, respectively. The resulting partition [] yields an optimized way of merging watershed patches in which regions corresponding to nodes in are regarded as potential detections. and are the weights for background and foreground terms, respectively, (, in our setting).
Graph cut results are then stacked up into a 3-D detection. The stacked 3-D detections are used as the initialization for a geodesic level set algorithm.25 A smooth 3-D surface is computed at the zero level set after the algorithm converges to get the detection segmentation. Level-set segmentation is an essential step in the CAD system to ensure accurate feature extraction.
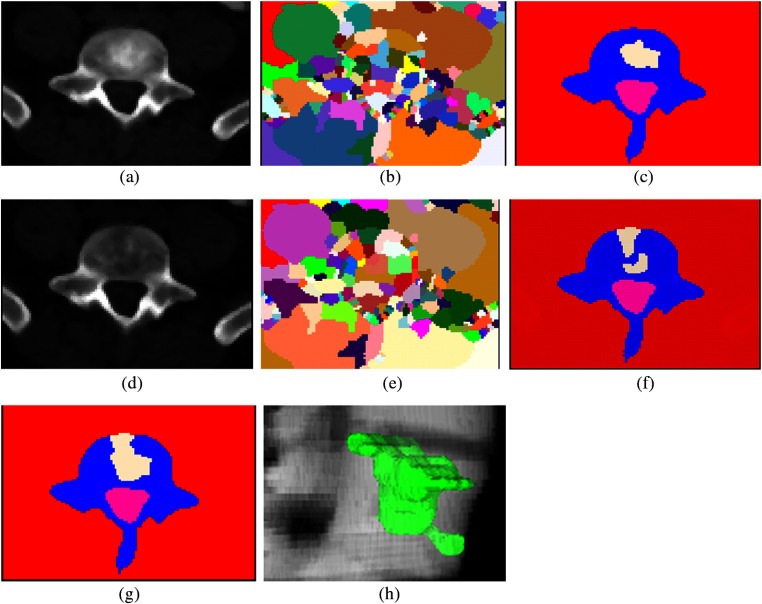
Two parallel processes are executed, one for sclerotic detections and one for lytic detections on their corresponding PET/CT synthesis. If both sclerotic and lytic detections present in the same neighborhood, they are merged and form new mixed detections. The detection and segmentation process is shown in Fig. 4, using one mixed lesion as an example.
Fig. 4.
Lesion candidate detection and segmentation. (a) Sclerotic PET/CT synthesis of Fig. 1(c); (b) watershed result of (a); (c) graph cut result of (b); (d) lytic PET/CT synthesis of Fig. 1(c); (e) watershed result of (d); (f) graph cut result of (e); (g) merging of sclerotic and lytic detections; and (h) 3-D mixed metastasis detection.
2.5. Feature Extraction
High-level features are computed to characterize the detections and distinguish true lesions from false findings. Based on our observations and knowledge of bone metastases, we devised a set of 31 quantitative features in three categories: shape (11), intensity (10), location (7), and SUV (3), listed in Table 1. Shape features measure the 3-D sizes (volume, surfaceArea, primaryAxisLength, and secondaryAxisLength), the length ratios (aspectRatio), sphericity (sphericity), and irregularity (shapeComplexity) of the detections. Intensity features measure the statistical voxel intensity distribution within (mean, stdev, skewness, kurtosis, and interiorIntensity), on the border (borderIntensity), outside (outsideIntensity), and in a banded neighborhood (neighborIntensity) of the detections. Location features measure the distance to boundary (distToBoundary), relative location to the center of the vertebra body (relCoord), whether it is on pedicle (onPedicle), the ratio of boundaries touching the bounding box (outerBorderRatio), the cortical bone (cortical BorderRatio), and the spinal cord (cordBorderRatio) of the detections. SUV features are standard uptake values from PET images (SUVmax, SUVmean, and SUVmin). Features are computed from the original CT and PET images, not the synthesis images.
Table 1.
Quantitative features for bone metastasis (detail explanation in Sec. 2.5).
| Shape | Intensity | Location | SUV |
|---|---|---|---|
| surfaceArea | meanIntensity | distToBoundary | SUVmax |
| volume | stdevIntensity | relCoordx | SUVmean |
| primaryAxisLength | skewnessIntensity | relCoordy | SUVStdev |
| secondaryAxisLength | kurtosisIntensity | onPedicle | |
| aspectRatio10 | interiorIntensity | outerBorderRatio | |
| aspectRatio20 | borderIntensity | corticalBorderRatio | |
| aspectRatio21 | outsideIntensity | cordBorderRatio | |
| sphericity | outsideIntensityDev | ||
| shapeComplexity_f1 | innerOuterContrast | ||
| shapeComplexity_f2 | neighborIntensity | ||
| shapeComplexity_f21 |
2.6. Multiclassifier
We use support vector machines for classification.26 We train three independent classifiers using training detections from the sclerotic, lytic, and mixed pipelines in our framework. In the testing phase, three sets of detections and features are generated and multiple classifiers (sclerotic, lytic, and mixed) are applied, respectively.
3. Results
3.1. Data Sets
Our study was compliant with the Health Insurance Portability and Accountability Act and conducted with Institutional Review Board approval. Informed consent was waived in our retrospective study analyzing previously performed imaging studies.
The data set included 44 clinical routine PET/CT scans (21 men, 23 women, mean age 53 years, ranging from 21 to 68 years). Twenty-six cases had spine metastases identified by radiologists, and 18 cases were control cases with no lesions. The data were acquired on GE Medical System Discovery RX with no intravenous contrast. CT scanning parameters were 120 kVp, 3.75 mm slice thickness with 0.98 to 1.37-mm in-plane resolution. PET image slice thickness was 3.27 mm with 5.47 mm in-plane resolution.
3.2. Performance Evaluation
225 sclerotic, 139 lytic, and 92 mixed spine metastases were manually marked and segmented as the reference data by author JB, a board certified radiologist with 10 years of experience, and author VS, a trained physician under the supervision of JB. The lesions were electronically marked on the CT images using visual integration of the CT and PET images. A single point was placed on the centroid of each lesion. Additionally, each lesion was segmented by electronic tracing of the lesion margin on every slice, on the CT only.
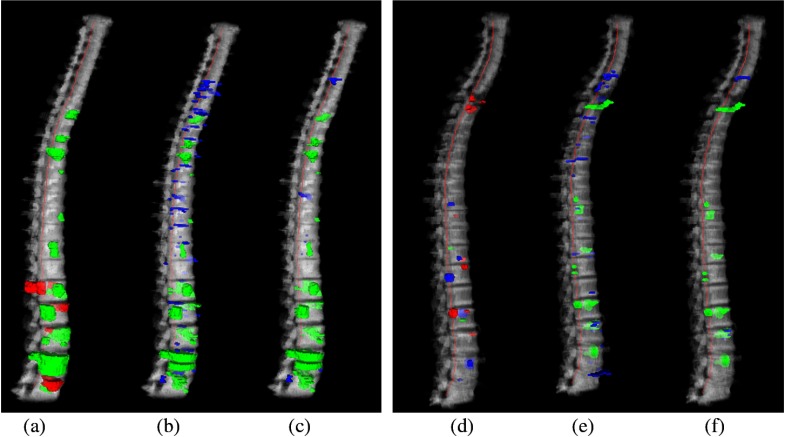
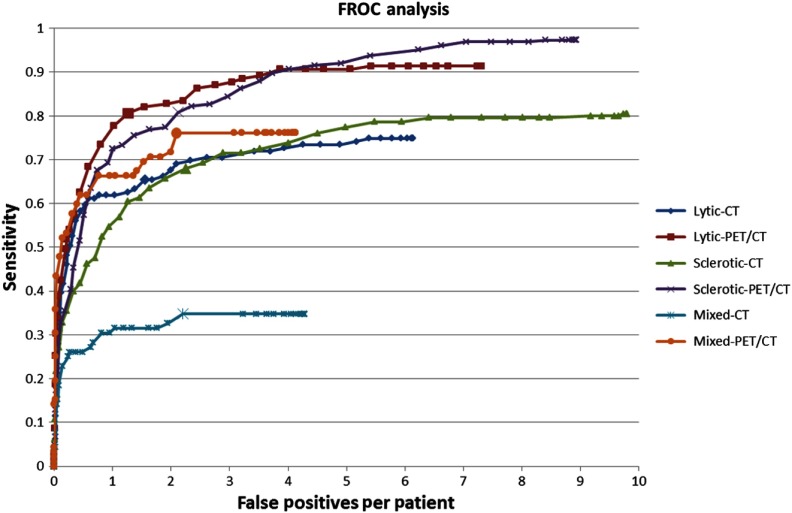
Ten-fold cross validation was conducted, and free-response receiver operating characteristic (FROC) analysis was used to evaluate the performance. 3-D reconstructions of reference data and CAD detections for two cases are shown in Fig. 5. The performance is summarized in Table 2. When the PET/CT synthesis was used, the sensitivities [false positive rate (FPR), false positive per patient] were 0.81 (2.1), 0.81 (1.3), and 0.76 (2.1) for sclerotic, lytic, and mixed lesions, respectively. When only the CT image was used, the sensitivities (false positive per patient) were 0.68 (2.2), 0.65 (1.5), and 0.35 (2.2) for sclerotic, lytic, and mixed lesions, respectively. Figure 6 shows the FROC analysis for CAD performance of lytic, sclerotic, and mixed lesions and for using PET/CT synthesis and using CT alone. The performance difference between using PET/CT synthesis and CT alone was statistically significant () for all three types of lesions. Figure 7 shows examples of lesions that were detected on PET/CT synthesis but not on CT alone, where CT alone does not provide sufficient contrast.
Fig. 5.
Reference data and CAD detections for two cases. (a)–(c) Case 1: a 40-year-old male, with primarily sclerotic lesions; (d)–(f) case 2: a 61-year-old male, with primarily lytic and mixed lesions. (a) and (d) 3-D rendering of reference lesions superimposed on the segmented spine column, green: sclerotic, blue: lytic, red: mixed lesions; (b) and (e) CAD detections before classification, and (c) and (f) CAD detections after classification. Green: true positive detections and blue: false positive detections. True positives are determined by the overlap with the reference lesion segmentation.
Table 2.
Performance summary. Sensitivity (false positive rate).
| Sclerotic | Lytic | Mixed | |
|---|---|---|---|
| CT only | 0.68 (2.2) | 0.65 (1.5) | 0.35 (2.2) |
| PET/CT synthesis | 0.81 (2.1) | 0.81 (1.3) | 0.76 (2.1) |
Fig. 6.
FROC analysis.
Fig. 7.
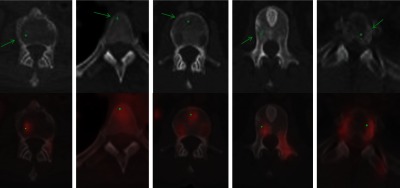
Lesions detected on PET/CT synthesis but not on CT alone. Green arrows point to lesions with green dots marking the center of the lesions. First row: CT and second row: PET/CT fusion.
False positive detections were due to bone islands, degenerative osteophytes, Schmorl nodes, vertebral disks, and basivertebral veins, as shown in Fig. 8.
Fig. 8.
False positive etiology. Green arrows point to false positive detections with green dots marking the center of the detections. (a) Bone island, (b) degenerative osteophyte, (c) Schmorl node, (d) vertebral disk, and (e) basivertebral vein.
4. Discussion
In this paper, we describe a fully automated detection system for spinal metastases on PET/CT examinations. This system introduces software architecture for simultaneous detection of the three patterns of architectural alteration/anatomic destruction of native bone structure by metastases apparent on CT (lytic, sclerotic, and mixed density) and PET/CT synthesis methodology in a unified system framework.
The development of a system that simultaneously detects sclerotic, lytic, and mixed density metastases is critical. Cancer patients may present with all three lesion types on a particular PET/CT examination, corresponding, for example, to metachronous lesion development, and the disease character and total tumor burden are important from the diagnostic and prognostic perspective. The lytic or sclerotic parts of a mixed lesion alone may be missed by the lytic or sclerotic classifier due to the size and complex texture. We propose merging the lytic and sclerotic parts and devise a dedicated classifier for mixed lesions. Our results show that this scheme improves the mixed lesion sensitivity by 16.9%.
PET imaging contributes important additional feature information regarding the metabolic activity of metastatic lesions by acting as a measure of lesion aggressiveness, beyond the anatomic/morphologic data of spine metastases obtained from stand-alone CT and MRI images. Additionally, in parallel to the increased sensitivity for detection seen in clinical practice using fused images, we have found that the inclusion of PET activity increases the sensitivity for lesion detection by the integrated detection system here. This system, when integrating lesion PET activity features with CT anatomic/morphologic features, compared to lesion assessment based only on CT features, increased the sensitivity for detection of sclerotic lesions by the system from 68% to 81% at a similar FPR. Similarly, the sensitivity for lytic lesion detection increased from 65% to 81%, and the sensitivity for mixed lesion detection increased from 35% to 76%, again at similar FPRs.
We develop a sophisticate algorithm for initial detection and segmentation. The algorithm integrates advanced techniques such as watershed, graph cut, and level sets. Effective initial detections by watershed and graph cut greatly reduce the burden for following classification. Due to the complex appearance of the lesions, simple thresholding will generate many false positives. Furthermore, it is not possible to find a threshold that will work for all cases. The level-set technique generates smooth surfaces for the detection, which is essential for accurate feature extraction.
Compared to prior computer image analysis frameworks, including O'Connor, Wels, Jerebko, Whyne, Burns, Roth, Huang, and Hammon,6,9,10,13–16 that focus on the detection of spine metastases on stand-alone CT and MRI images, this system integrates lesion PET activity features with CT anatomic/morphologic features to optimize detection sensitivity and prognostic implication. Additionally, compared to prior CT-based detection systems designed for sclerotic lesion detection,9,13,14 lytic lesion detection,6,7 and sclerotic/lytic but not mixed type detection,15,16 this system uses a triple classifier process to detect all three lesion types: lytic, sclerotic, and mixed. Additionally, compared to Ref. 9, this is a fully automated system, and, compared to Ref. 10, this system detects individual lesions, allowing individual analysis. Table 3 compares our proposed system with prior CAD methods.
Table 3.
System comparison.
| Method | Lesion type | Data size | Modality | Validation | Sensitivity FPR/specificity |
|---|---|---|---|---|---|
| Proposed method | Lytic, sclerotic, mixed | 44 patients, 456 lesions | PET/CT | Ten-fold cross validation | 81% (2.1), 81% (1.3), 76% (2.1) for lytic, sclerotic, mixed |
| O'Connor et al. 6 | Lytic | 50 patients, 28 lesions | CT | Separate test set | 94% (4.5) |
| Wel et al.7 | Lytic | 34 patients, 105 lesions | CT | Ninefold cross validation | 75% (3.0) |
| Jerebko et al.8 | Lytic | 42 patients, 21 lesions | MRI | Separate test set | 84% (5) |
| Burns et al.13 | Sclerotic | 49 patients, 532 lesions | CT | Separate test set | 79% (10.9) |
| Roth et al.14 | Sclerotic | 59 patients, 532 lesions | CT | Fivefold cross validation | 80% (9.5) |
| Huang and Chiang15 | Lytic, sclerotic | 35 patients, 192 lesions | CT | Fivefold cross validation | 79% (90%) |
| Hammonet al.16 | Lytic, sclerotic | 50 patients, 214 lesions | CT | Separate test set | 88% (3.7), 83% (3.5) for lytic and sclerotic |
There are some limitations in this work, which are both process related and system algorithm related. First, there was relatively low intrinsic spatial resolution on the CT images, both in-plane and through-plane. Most CT scans obtained as part of a fused PET/CT study are performed with low-dose CT protocol, associated with lower signal-to-noise (SNR) and lower in-plane spatial resolution. Additionally, images are typically formatted to 3.75 mm section thickness. However, as with other helical CT scans, patient scan data are stored as high density 3-D volume data in the CT scanner memory and may be reformatted to a higher density through-plane resolution by reformatting section thickness to 1 to 2 mm in future studies. Additionally, data analyzed here are formatted for interpretation within the PET/CT standard of a wide field-of-view whole body scan, with loss of in-plane resolution form source data. Images specifically formatted to the field-of-view of the anatomic structure of interest, such as a small field-of-view spine protocol, would greatly increase in-plane resolution. The decreased SNR is likely not amenable to correction, as an artifact of the low-dose protocol performed in these patients is likely to have multiple serial images over the course of years. Second, the system was only tested on FDG-PET/CT examinations. While FDG-PET/CT is the most commonly clinically used radiotracer imaging agent, alternatives such as NaF-PET/CT also exist. There is variant activity and sensitivity for detection of lytic versus sclerotic lesions depending on the specific PET active agent, with FDG-PET demonstrating lower sensitivity for detection of sclerotic lesions. Thus, the benefit of modality synthesis for lesion detection may be lower for sclerotic lesions (at least on FDG-PET) relative to sclerotic lesions. However, although not tested here, this system has potential for application to NaF-PET scans as well. A third limitation may arise from intrinsic (physiologic) or extrinsic (intentional) movement of the patient between the time of the CT and PET portions of the examination, resulting in misregistration. While intrinsic movement is not amenable to restriction, spatially focal extrinsic movement may be attenuated by CT technologist reinforcement of the importance of stillness during the examination to the patient. Global extrinsic movement may be lessened by application of a postscan image coregistration algorithm. We only extract SUVmean, SUVmax, and SUVmin from PET for the entire detection. Those features are fairly robust to small motion and somewhat alleviate the misregistration problem.
In current clinical practice, lesions are detected by visual inspection of images and measured manually using PACS tools, a time consuming and potentially difficult process. Assessment of bone lesions without a soft tissue component, based on our anecdotal experience, most commonly involves measuring one or two linear spatial dimensions and perhaps noting the peak SUV value, but this is inconstant and dependent on the individual radiologist/nuclear medicine physician. The challenge is to create a system for detection while allowing a uniform extraction of detailed quantitative information from the lesions to guide patient management.
The system discussed in the paper is the first step, or proof of process, in addressing a larger clinical question: How do we quantitatively assess metastatic lesions in the bone on PET/CT imaging? We overtly discuss lesion detection in this paper, as the first step in quantitative assessment. Volume and other physical parameters are measured implicitly as part of the process of SVM lesion classification and are a part of the benefit that this system provides for future use in quantitative analysis of metastatic disease.
In conclusion, there are three main contributions of this paper: (1) we developed a fully automated spine lesion detection system; (2) we designed and validated a system utilizing a unified multiclassifier framework that detects and classifies the varying spectrum of bone metastasis in the spine as manifested on CT images, including sclerotic, mixed, and lytic lesions; and (3) we additionally integrated PET feature data through a fusion synthesis process parallel to clinical PET/CT fusion, to enhance the detection and analysis of spine metastasis on PET/CT imaging.
Acknowledgments
This work was supported in part by the Intramural Research Program of the National Institutes of Health Clinical Center.
Biography
Biographies for the authors are not available.
Disclosures
The authors have no relevant financial interests in the manuscript and no other potential conflicts of interest to disclose.
References
- 1.Roodman G. D., “Mechanisms of bone metastasis,” N. Engl. J. Med. 350, 1655–1664 (2004). 10.1056/NEJMra030831 [DOI] [PubMed] [Google Scholar]
- 2.Yao J., Burns J., Summers R. M., “Computer-aided detection of bone metastasis in the thoracolumbar spine,” in Spinal Imaging and Image Analysis, Yao J., Li S., Eds., Springer International Publishing, Switzerland: (2015). [Google Scholar]
- 3.Bilsky M. H., et al. , “The diagnosis and treatment of metastatic spinal tumor,” Oncologist 4(6), 459–469 (1999). [PubMed] [Google Scholar]
- 4.Mundy G. R., “Metastasis to bone: causes, consequences and therapeutic opportunities,” Nat. Rev. Cancer 2, 584–593 (2002). 10.1038/nrc867 [DOI] [PubMed] [Google Scholar]
- 5.Evangelista L., et al. , “Early bone marrow metastasis detection: the additional value of FDG-PET/CT vs. CT imaging,” Biomed. Pharmacother. 66, 448–453 (2012). 10.1016/j.biopha.2012.06.004 [DOI] [PubMed] [Google Scholar]
- 6.O'Connor S. D., Yao J., Summers R. M., “Lytic metastases in thoracolumbar spine: computer aided detection at CTA preliminary study,” Radiology 242(3), 811–816 (2007). 10.1148/radiol.2423060260 [DOI] [PubMed] [Google Scholar]
- 7.Wels M., et al. , “Multi-stage osteolytic spinal bone lesion detection from CT data with internal sensitivity control,” Proc. SPIE 8315, 831513 (2012). 10.1117/12.911169 [DOI] [Google Scholar]
- 8.Jerebko A., et al. , “Robust parametric modeling approach based on domain knowledge for computer aided detection of vertebrae column metastases in MRI,” Inf. Process. Med. Imaging 20, 713–724 (2007). 10.1007/978-3-540-73273-0_59 [DOI] [PubMed] [Google Scholar]
- 9.Toth D. F., et al. , “Rapid detection of bone metastasis at thoracoabdominal CT: accuracy and efficiency of a new visualization algorithm,” Radiology 270(3), 825–833 (2014). 10.1148/radiol.13130789 [DOI] [PubMed] [Google Scholar]
- 10.Whyne C., et al. , “Quantitative characterization of metastatic disease in the spine. Part II. Histogrambased analyses,” Med. Phys. 34(8), 3279–3285 (2007). 10.1118/1.2756939 [DOI] [PubMed] [Google Scholar]
- 11.Skrinskas T., et al. , “Automated CT-based analysis to detect changes in the prevalence of lytic bone metastases from breast cancer,” Clin. Exp. Metastasis 26, 97–103 (2009). 10.1007/s10585-008-9219-6 [DOI] [PubMed] [Google Scholar]
- 12.Wiese T., et al. , “Detection of sclerotic bone metastases in the spine using watershed algorithm and graph cut,” Proc. SPIE 8315, 831512 (2012). 10.1117/12.911700 [DOI] [Google Scholar]
- 13.Burns J., et al. , “Detection of sclerotic metastases in the thoracolumbar spine on computed tomography,” Radiology 268(1), 69–78 (2013). 10.1148/radiol.13121351 [DOI] [PMC free article] [PubMed] [Google Scholar]
- 14.Roth H. R., et al. , “Detection of sclerotic spine metastases via random aggregation of deep convolutional neural network classifications,” Lect. Notes Comput. Vision Biomech. 20, 3–12 (2015). 10.1007/978-3-319-14148-0 [DOI] [Google Scholar]
- 15.Huang S.-F., Chiang K.-H., “Automatic detection of bone metastasis in vertebrae by using CT images,” in Proc. of the World Congress on Engineering, London, UK (2012). [Google Scholar]
- 16.Hammon M., et al. , “Automatic detection of lytic and blastic thoracolumbar spine metastases on computed tomography,” Eur. Radiol. 23, 1862–1870 (2013). 10.1007/s00330-013-2774-5 [DOI] [PMC free article] [PubMed] [Google Scholar]
- 17.Burns J., Yao J., Summers R., Computational Detection, Analysis, and Classification of Lytic, Sclerotic and Mixed Spinal Metastases on PET/CT Imaging,” Radiological Society of North America (RSNA), Chicago: (2016). [Google Scholar]
- 18.Gwak H. S., et al. , “Usefulness of 18F-fluorodeoxyglucose PET for radiosurgery planning and response monitoring in patients with recurrent spinal metastasis,” Minim. Invas. Neurosurg. 49, 127–134 (2006). 10.1055/s-2006-932181 [DOI] [PubMed] [Google Scholar]
- 19.Taira A. V., et al. , “Detection of bone metastases: assessment of integrated FDG PET/CT imaging,” Radiology 243(1), 204–211 (2007). 10.1148/radiol.2431052104 [DOI] [PubMed] [Google Scholar]
- 20.Yao J., O'Connor S. D., Summers R. M., “Automated spinal column extraction and partitioning,” in 3rd IEEE Int. Symp. on Biomedical Imaging: Nano to Macro (2006). [Google Scholar]
- 21.Farin G., Curves and Surfaces for Computer Aided Geometric Design, Academic Press, San Diego: (1993). [Google Scholar]
- 22.Kanitsar A., et al. , “CPR—curved planar reformation,” in IEEE Visualization, Boston, MA: (2002). [Google Scholar]
- 23.Vincent L., Soille P., “Watersheds in digital spaces: an efficient algorithm based on immersion simulations,” IEEE Trans. Pattern Anal. Mach. Intell. 13(6), 583–598 (1991). 10.1109/34.87344 [DOI] [Google Scholar]
- 24.Boykov Y., Kolmogorov V., “An experimental comparison of min-cut/max-flow algorithms for energy minimization in vision,” IEEE Pattern Anal. Mach. Intell. 26(9), 1124–1137 (2004). 10.1109/TPAMI.2004.60 [DOI] [PubMed] [Google Scholar]
- 25.Sethian J. A., Level Set Methods and Fast Marching Methods, Cambridge University Press, Cambridge, United Kingdom: (1999). [Google Scholar]
- 26.Chang C.-C., Lin C.-J., “LIBSVM: a library for support vector machines,” ACM Trans. Intell. Syst. Technol. 2(27), 1–27 (2011). 10.1145/1961189 [DOI] [Google Scholar]


